| Param | Original file | Final file |
|---|---|---|
| Filename | modeM0/AS1G06_130T01_9000000782_06063cztM0_level2.evt | modeM0/AS1G06_130T01_9000000782_06063cztM0_level2_quad_clean.evt |
| Size (bytes) | 437,348,160 | 118,002,240 |
| Size | 417.1 MB | 112.5 MB |
| Events in quadrant A | 3,516,935 | 792,432 |
| Events in quadrant B | 3,448,439 | 805,286 |
| Events in quadrant C | 2,795,956 | 786,588 |
| Events in quadrant D | 3,059,834 | 754,401 |
| Mode SS | |||
|---|---|---|---|
| Quadrant | BADHDUFLAG | Total packets | Discarded packets |
| A | 0 | 128 | 0 |
| B | 0 | 128 | 0 |
| C | 0 | 128 | 0 |
| D | 0 | 128 | 0 |
| Mode M9 | |||
|---|---|---|---|
| Quadrant | BADHDUFLAG | Total packets | Discarded packets |
| A | 0 | 12 | 0 |
| B | 0 | 12 | 0 |
| C | 0 | 12 | 0 |
| D | 0 | 12 | 0 |
| Mode M0 | |||
|---|---|---|---|
| Quadrant | BADHDUFLAG | Total packets | Discarded packets |
| A | 0 | 14485 | 4 |
| B | 0 | 14359 | 1 |
| C | 0 | 12807 | 1 |
| D | 0 | 13540 | 1 |
| Quadrant | Total seconds | Saturated seconds | Saturation percentage |
|---|---|---|---|
| A | 6232 | 62 | 0.994865% |
| B | 6233 | 98 | 1.572277% |
| C | 6233 | 18 | 0.288785% |
| D | 6233 | 32 | 0.513396% |
Noise dominated data is calculated using 1-second bins in cleaned event files. If a bin has >2000 counts, and if more than 50% of those come from <1% of pixels, then it is considered to be noise-dominated and hence unusable.
| Quadrant | # 1 sec bins | Bins with >0 counts | Bins with >2000 counts | High rate bins dominated by noise | Noise dominated (total time) | Noise dominated (detector-on time) | Marked lightcurve |
|---|---|---|---|---|---|---|---|
| A | 7473 | 6234 | 8 | 8 | 0.11% | 0.13% | 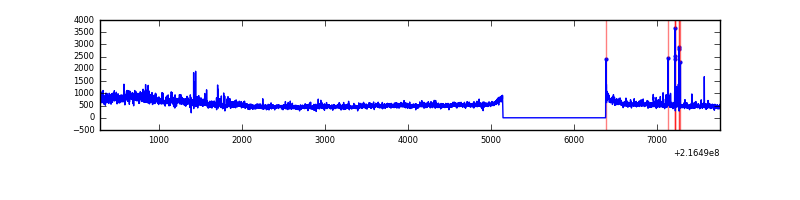 |
| B | 7473 | 6234 | 46 | 46 | 0.62% | 0.74% | 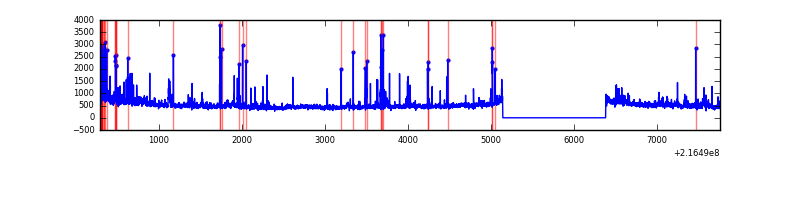 |
| C | 7473 | 6234 | 0 | 0 | 0.00% | 0.00% | 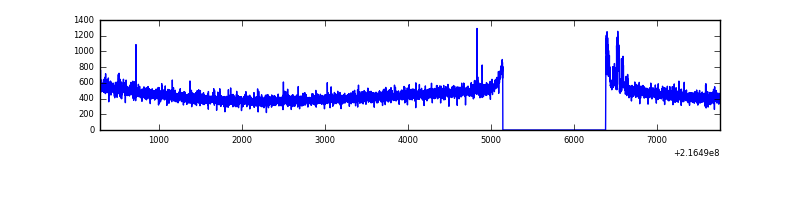 |
| D | 7473 | 6234 | 17 | 17 | 0.23% | 0.27% | 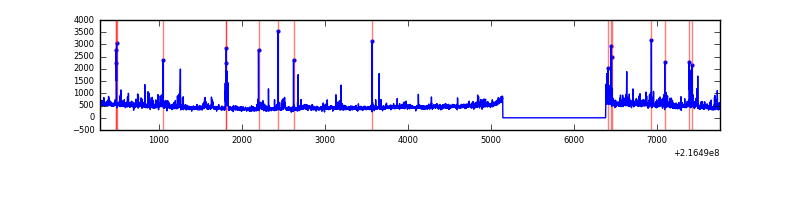 |
Top three noisy pixels from each quadrant. If the there are fewer than three noisy pixels in the level2.evt file, extra rows are filled as -1
| Pixel properties | Quadrant properties | ||||||
|---|---|---|---|---|---|---|---|
| Quadrant | DetID | PixID | Counts | Sigma | Mean | Median | Sigma |
| A | 8 | 15 | 651699 | 4373.79 | 728 | 714 | 148.8 |
| A | 4 | 2 | 50330 | 333.36 | 728 | 714 | 148.8 |
| A | 12 | 194 | 7180 | 43.44 | 728 | 714 | 148.8 |
| B | 3 | 64 | 336674 | 2427.87 | 737 | 722 | 138.4 |
| B | 0 | 214 | 71148 | 508.95 | 737 | 722 | 138.4 |
| B | 15 | 204 | 67771 | 484.55 | 737 | 722 | 138.4 |
| C | 9 | 54 | 36213 | 220.04 | 702 | 704 | 161.4 |
| C | 1 | 16 | 14619 | 86.23 | 702 | 704 | 161.4 |
| C | 13 | 61 | 5770 | 31.39 | 702 | 704 | 161.4 |
| D | 12 | 221 | 112733 | 656.67 | 698 | 673 | 170.6 |
| D | 11 | 241 | 78840 | 458.06 | 698 | 673 | 170.6 |
| D | 1 | 2 | 44365 | 256.03 | 698 | 673 | 170.6 |
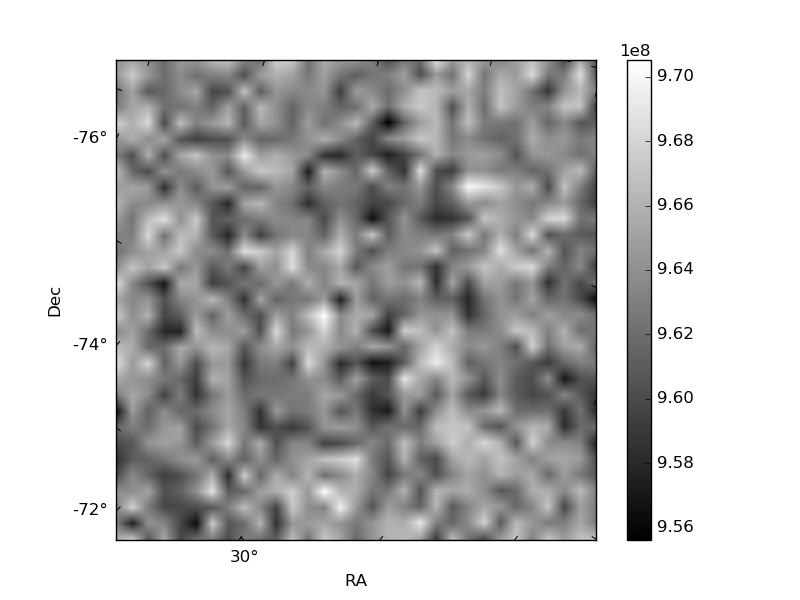
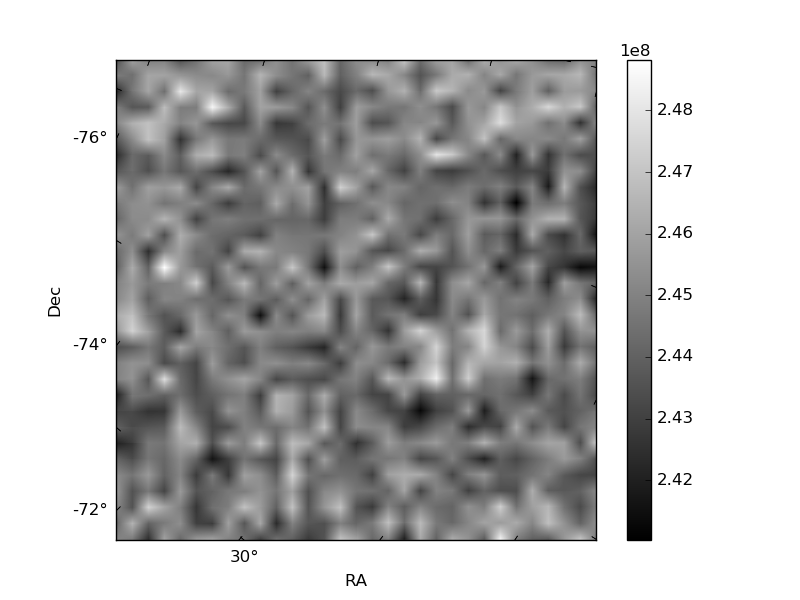
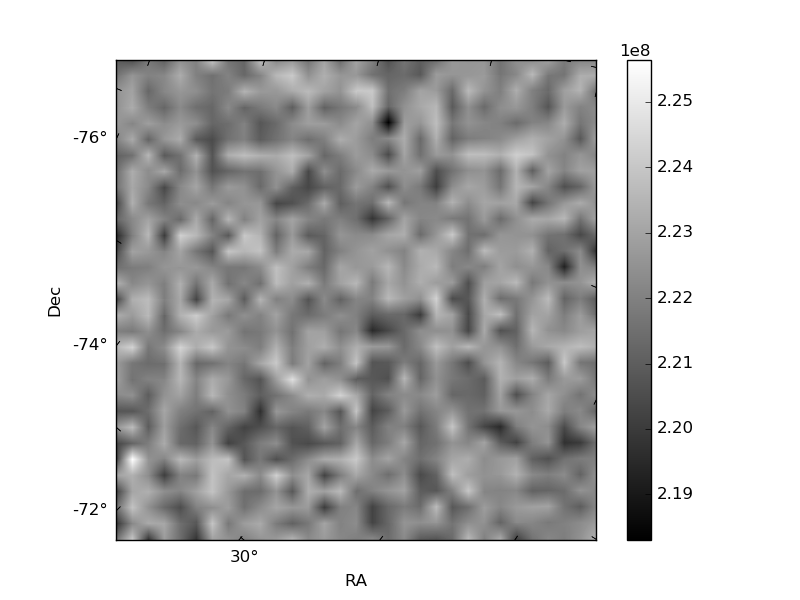
Histogram calculated using DETX and DETY for each event in the final _common_clean file
| Quadrant A | 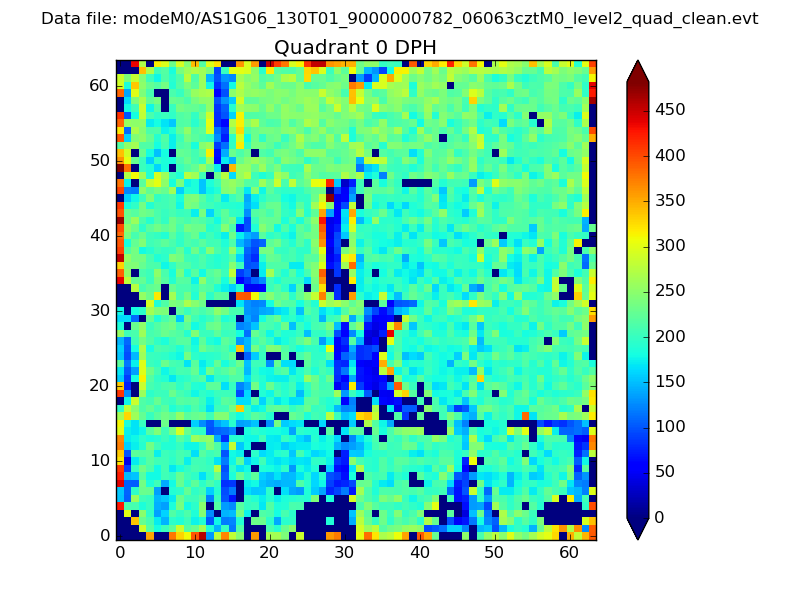 |
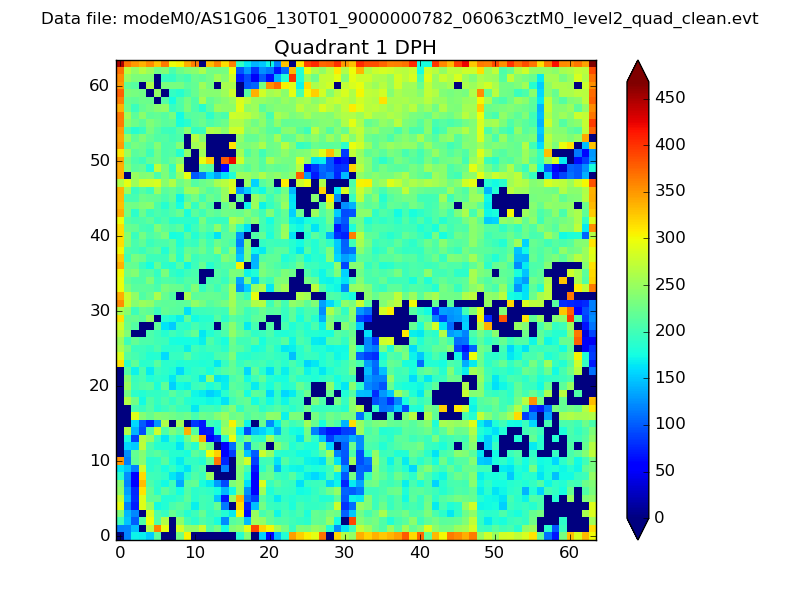 |
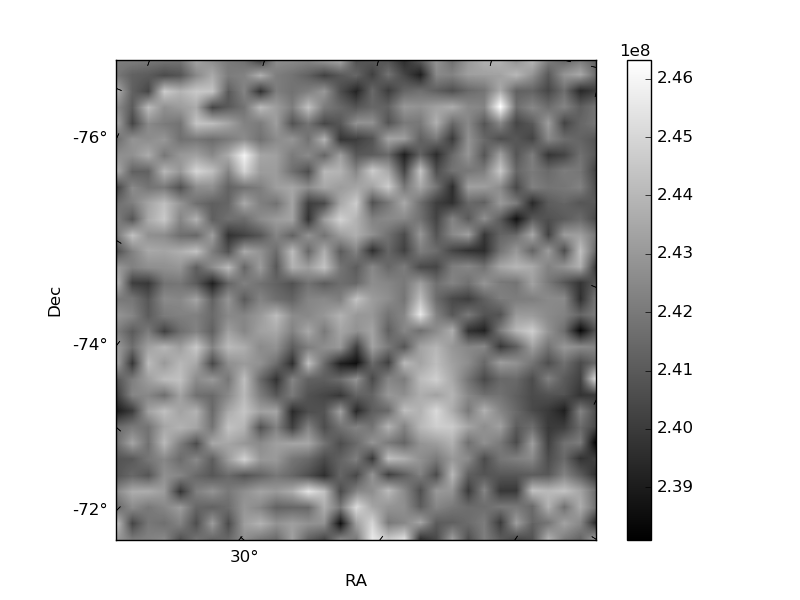
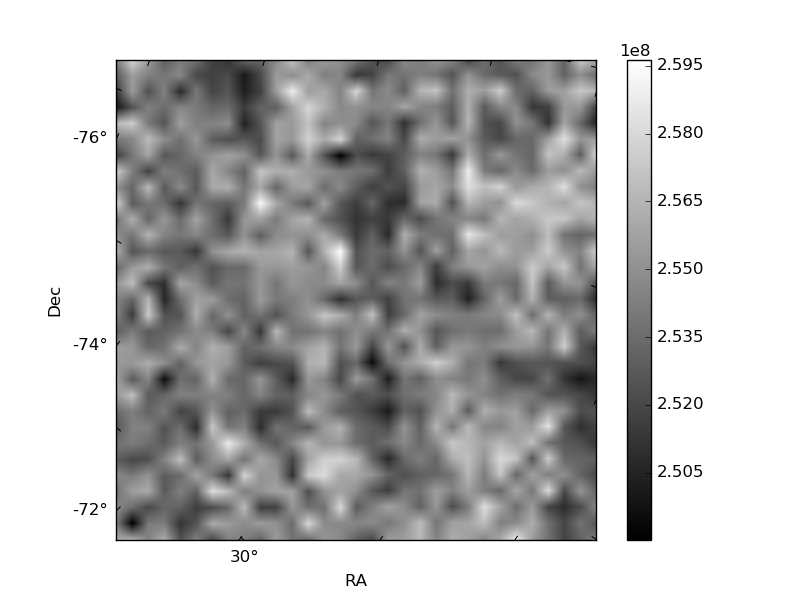
Quadrant B |
|---|---|---|---|
| Quadrant D | 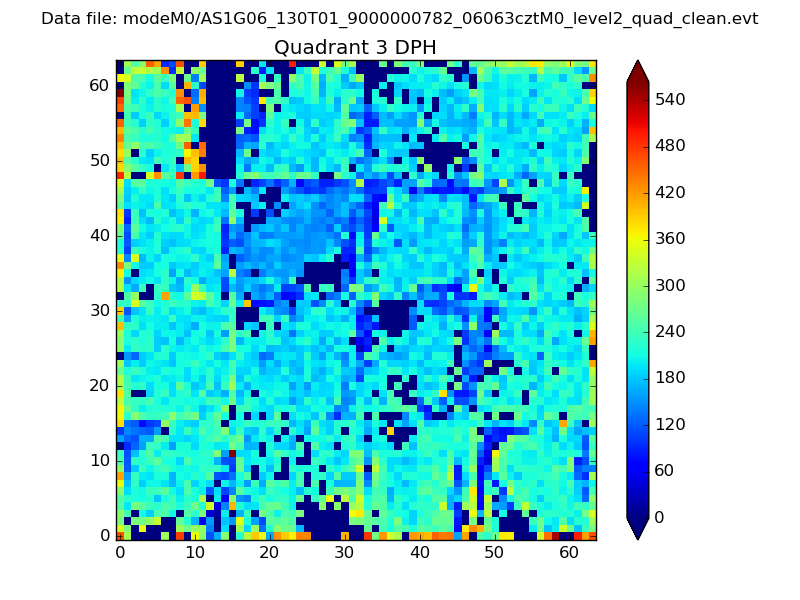 |
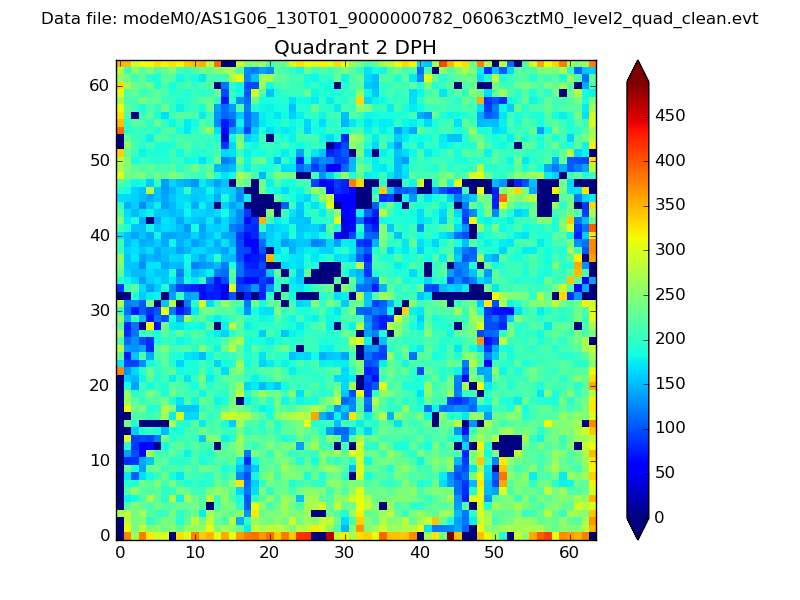 |
Quadrant C |
| Plot type | Count rate plots | Images |
|---|---|---|
| Comparison with Poisson distribution Blue bars denote a histogram of data divided into 1 sec bins. Red curve is a Poisson curve with rate = median count rate of data. |
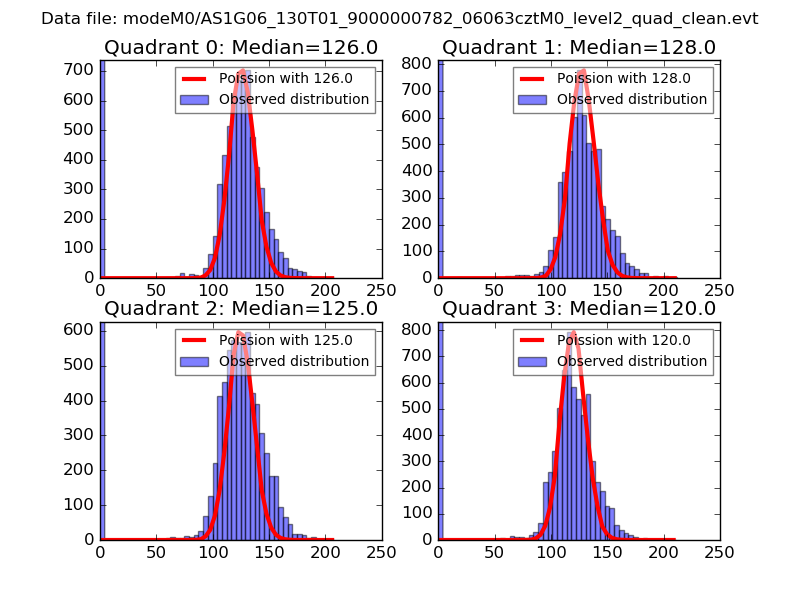 |
 |
| Quadrant-wise count rates Data is divided into 100 sec bins |
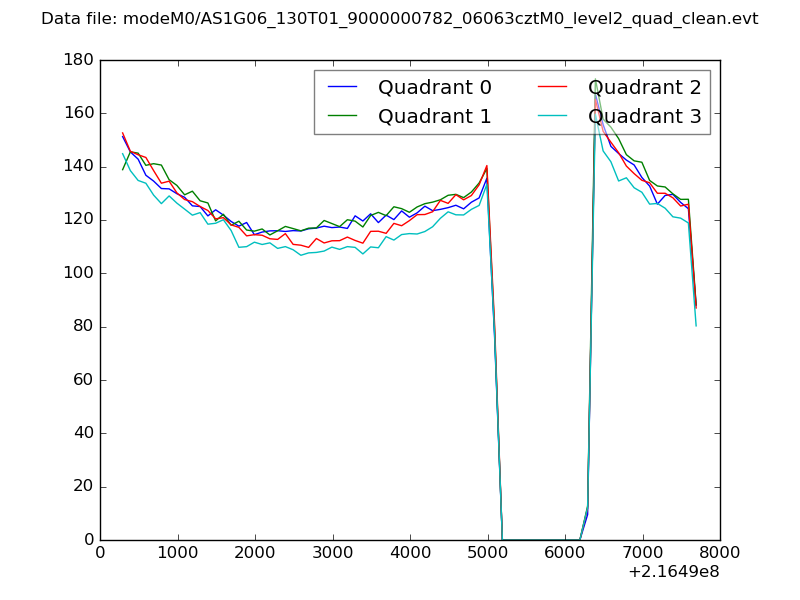 |
|
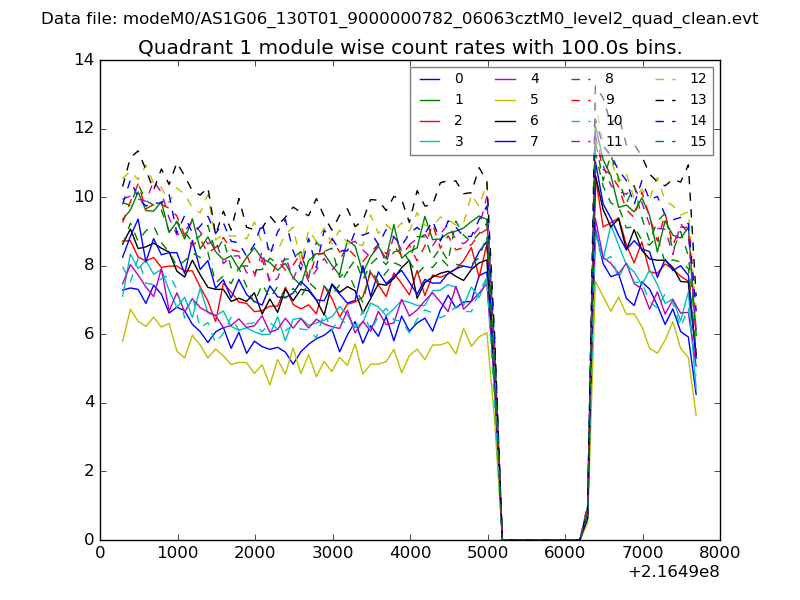
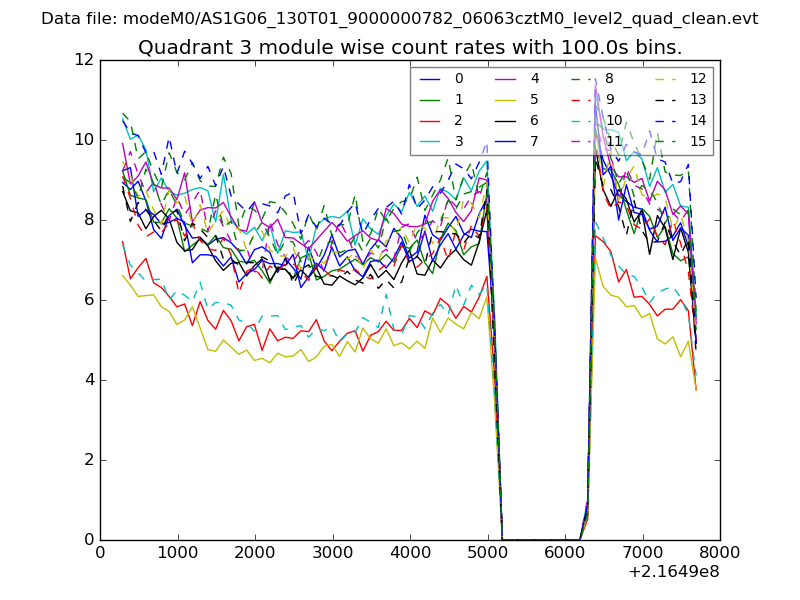
| Module-wise count rates for Quadrant A Data is divided into 100 sec bins |
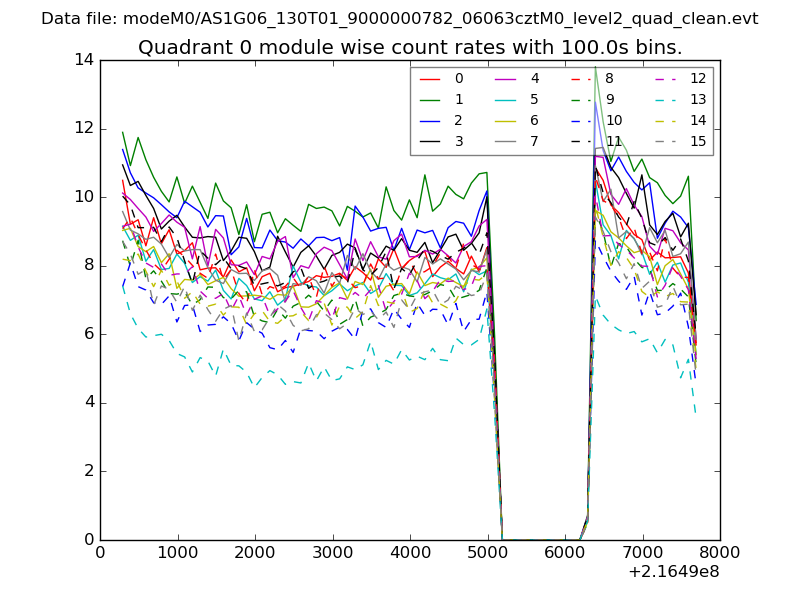 |
 |
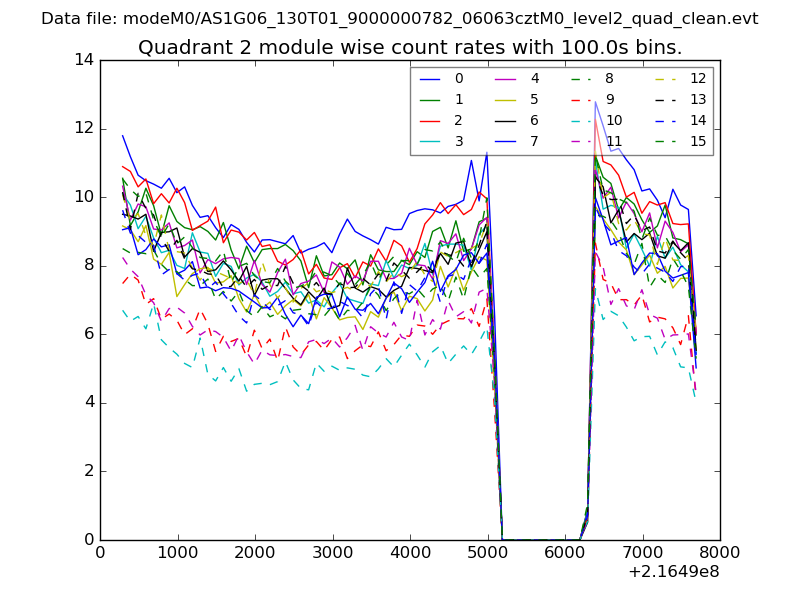
| Module-wise count rates for Quadrant B Data is divided into 100 sec bins |
 |
 |
| Module-wise count rates for Quadrant C Data is divided into 100 sec bins |
 |
 |
| Module-wise count rates for Quadrant D Data is divided into 100 sec bins |
 |
 |
| Parameter | Plot |
|---|---|
| CZT HV Monitor | 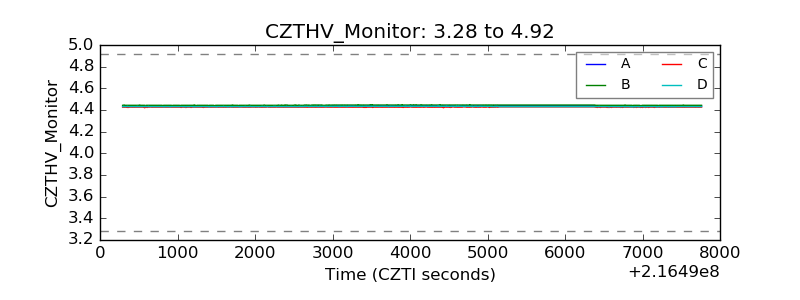 |
| D_VDD | 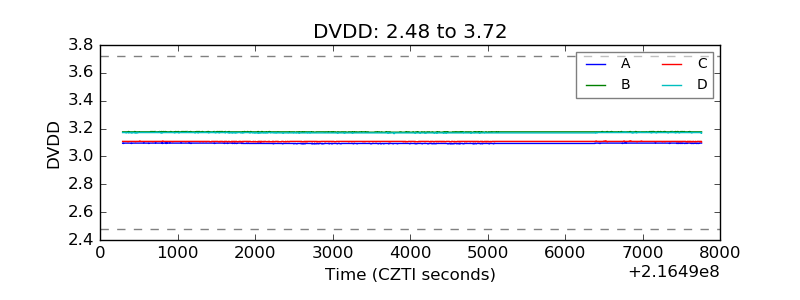 |
| Temperature 1 | 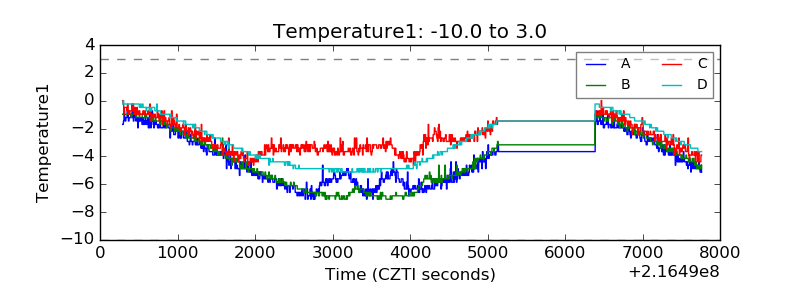 |
| Veto HV Monitor | 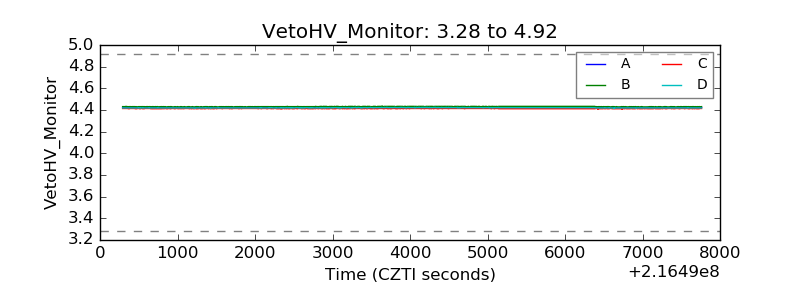 |
| Veto LLD | 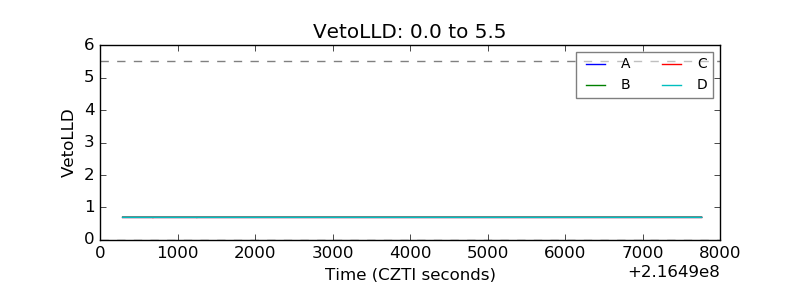 |
| Alpha Counter | 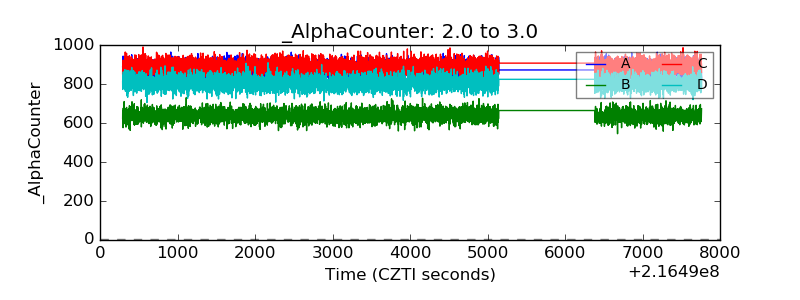 |
| _CPM_Rate | 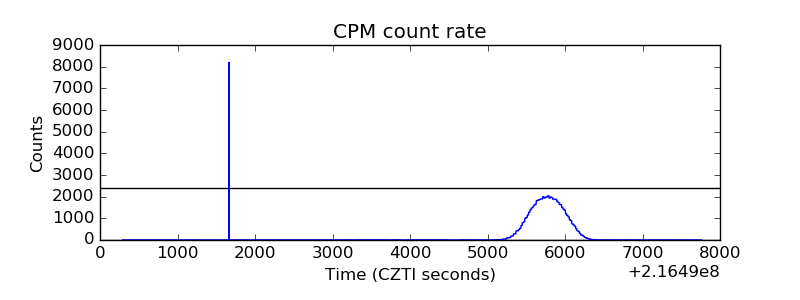 |
| CZT Counter |  |
| +2.5 Volts monitor |  |
| +5 Volts monitor |  |
| _ROLL_ROT | 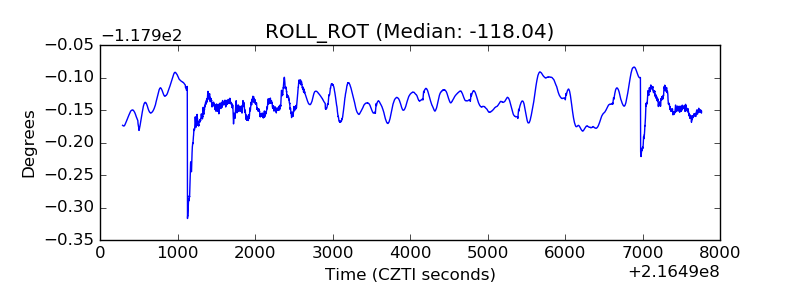 |
| _Roll_DEC | 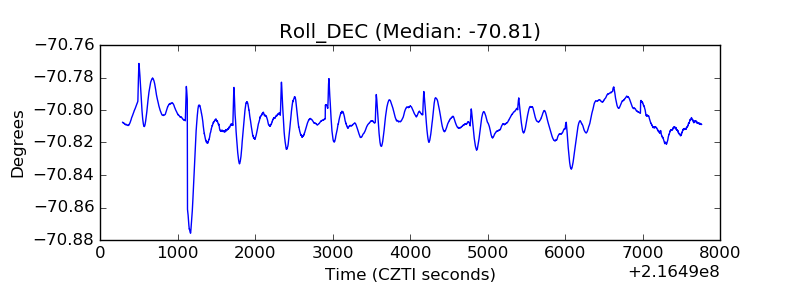 |
| _Roll_RA | 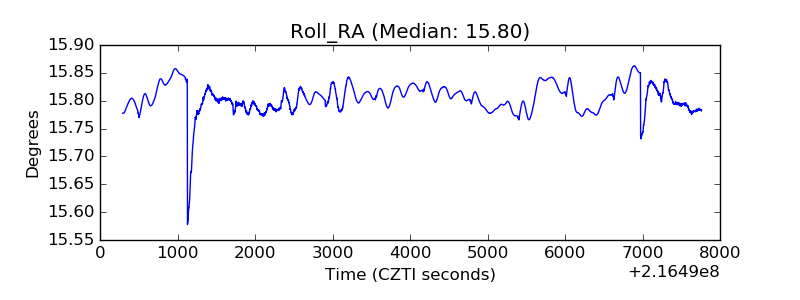 |
| Veto Counter | 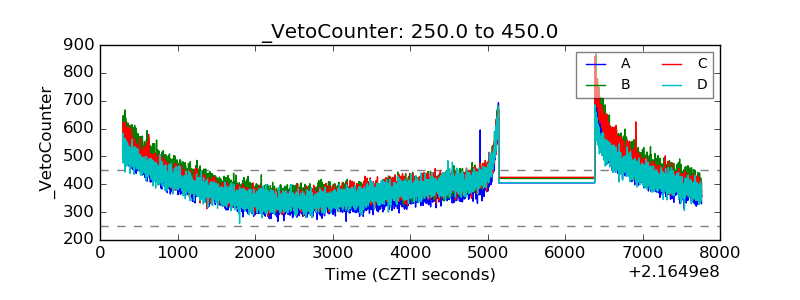 |