| Param | Original file | Final file |
|---|---|---|
| Filename | modeM0/AS1G06_130T01_9000000782_06065cztM0_level2.evt | modeM0/AS1G06_130T01_9000000782_06065cztM0_level2_quad_clean.evt |
| Size (bytes) | 448,770,240 | 117,002,880 |
| Size | 428.0 MB | 111.6 MB |
| Events in quadrant A | 3,017,155 | 785,390 |
| Events in quadrant B | 4,021,323 | 790,171 |
| Events in quadrant C | 2,828,746 | 786,889 |
| Events in quadrant D | 3,298,293 | 744,126 |
| Mode SS | |||
|---|---|---|---|
| Quadrant | BADHDUFLAG | Total packets | Discarded packets |
| A | 0 | 128 | 0 |
| B | 0 | 128 | 0 |
| C | 0 | 128 | 0 |
| D | 0 | 128 | 0 |
| Mode M9 | |||
|---|---|---|---|
| Quadrant | BADHDUFLAG | Total packets | Discarded packets |
| A | 0 | 19 | 0 |
| B | 0 | 19 | 0 |
| C | 0 | 19 | 0 |
| D | 0 | 20 | 0 |
| Mode M0 | |||
|---|---|---|---|
| Quadrant | BADHDUFLAG | Total packets | Discarded packets |
| A | 0 | 13327 | 3 |
| B | 0 | 16259 | 2 |
| C | 0 | 12999 | 2 |
| D | 0 | 14279 | 2 |
| Quadrant | Total seconds | Saturated seconds | Saturation percentage |
|---|---|---|---|
| A | 6257 | 50 | 0.799105% |
| B | 6257 | 303 | 4.842576% |
| C | 6257 | 44 | 0.703212% |
| D | 6257 | 85 | 1.358479% |
Noise dominated data is calculated using 1-second bins in cleaned event files. If a bin has >2000 counts, and if more than 50% of those come from <1% of pixels, then it is considered to be noise-dominated and hence unusable.
| Quadrant | # 1 sec bins | Bins with >0 counts | Bins with >2000 counts | High rate bins dominated by noise | Noise dominated (total time) | Noise dominated (detector-on time) | Marked lightcurve |
|---|---|---|---|---|---|---|---|
| A | 7497 | 6258 | 1 | 1 | 0.01% | 0.02% | 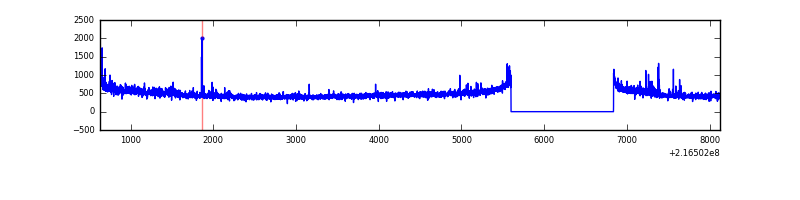 |
| B | 7497 | 6258 | 172 | 172 | 2.29% | 2.75% | 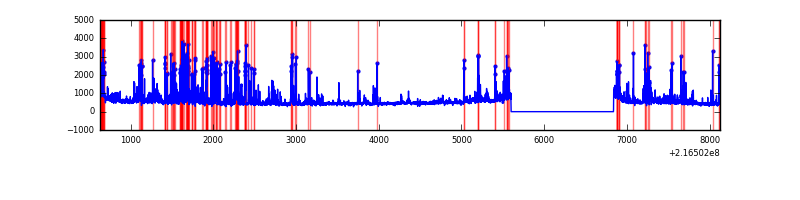 |
| C | 7497 | 6258 | 21 | 21 | 0.28% | 0.34% | 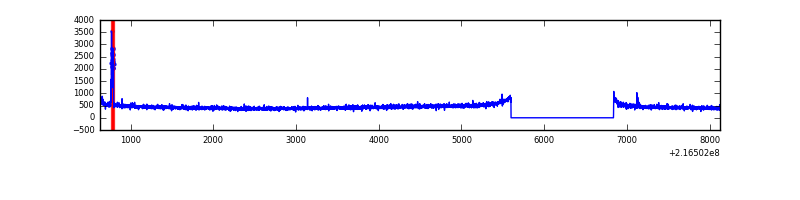 |
| D | 7497 | 6258 | 53 | 53 | 0.71% | 0.85% | 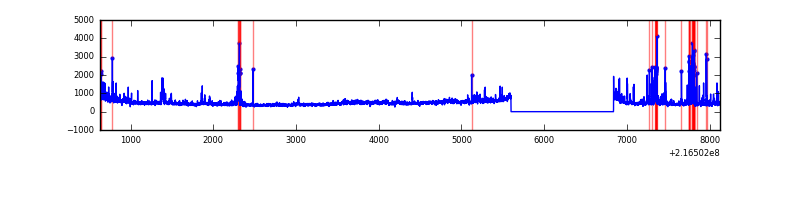 |
Top three noisy pixels from each quadrant. If the there are fewer than three noisy pixels in the level2.evt file, extra rows are filled as -1
| Pixel properties | Quadrant properties | ||||||
|---|---|---|---|---|---|---|---|
| Quadrant | DetID | PixID | Counts | Sigma | Mean | Median | Sigma |
| A | 8 | 15 | 208649 | 1418.8 | 721 | 704 | 146.6 |
| A | 4 | 2 | 18066 | 118.46 | 721 | 704 | 146.6 |
| A | 14 | 111 | 11353 | 72.66 | 721 | 704 | 146.6 |
| B | 3 | 64 | 904395 | 6569.92 | 725 | 708 | 137.5 |
| B | 15 | 204 | 111956 | 808.79 | 725 | 708 | 137.5 |
| B | 4 | 81 | 89654 | 646.65 | 725 | 708 | 137.5 |
| C | 1 | 16 | 67511 | 412.9 | 705 | 707 | 161.8 |
| C | 13 | 61 | 5705 | 30.89 | 705 | 707 | 161.8 |
| C | 9 | 16 | 5699 | 30.85 | 705 | 707 | 161.8 |
| D | 13 | 169 | 234532 | 1352.56 | 695 | 673 | 172.9 |
| D | 12 | 221 | 213864 | 1233.03 | 695 | 673 | 172.9 |
| D | 2 | 33 | 67964 | 389.19 | 695 | 673 | 172.9 |
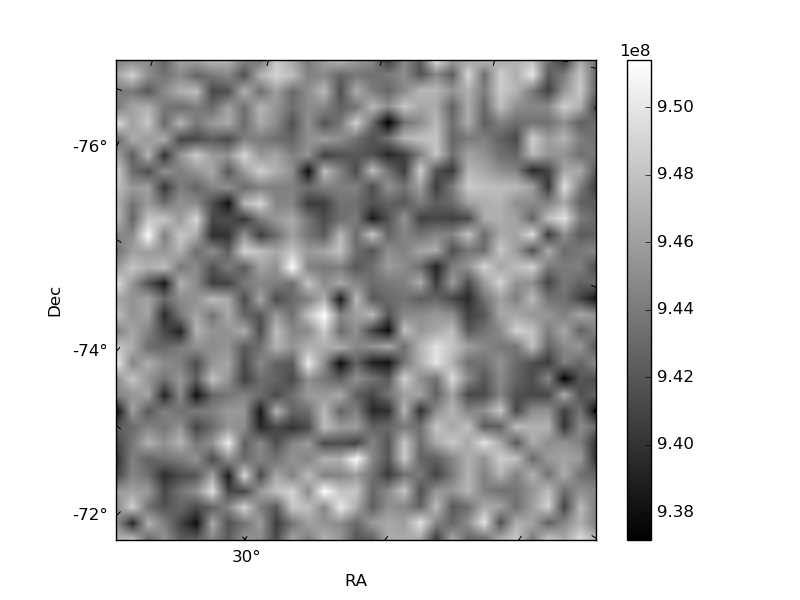
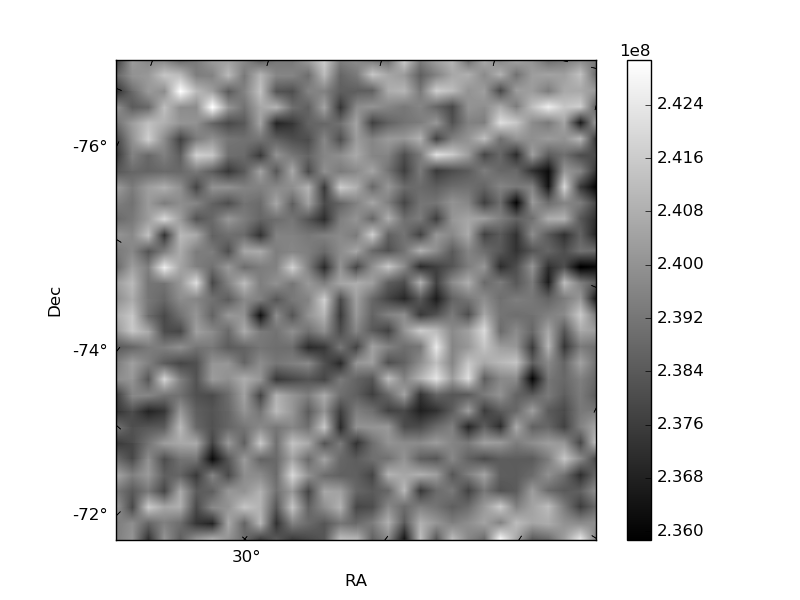
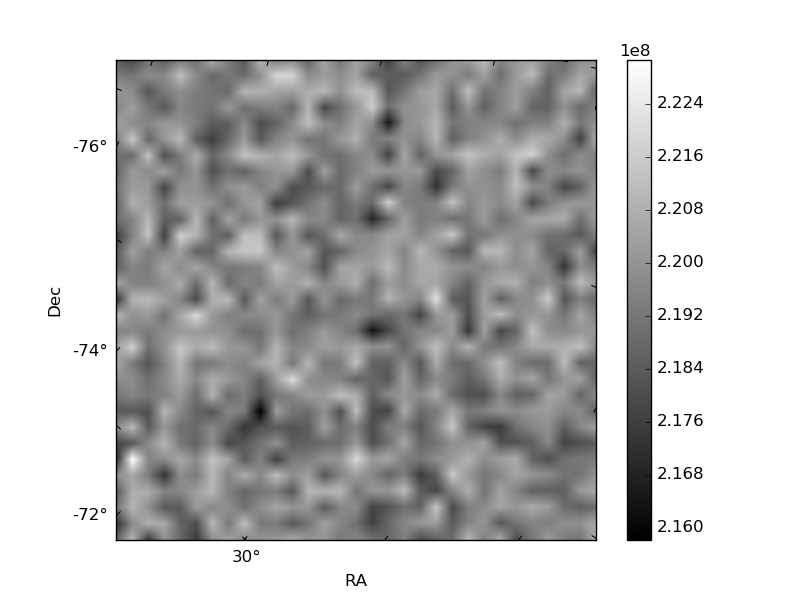
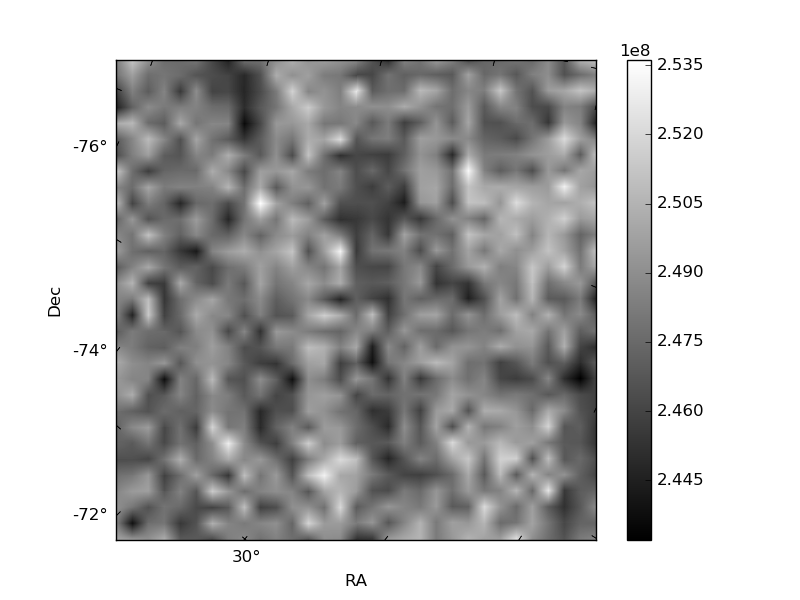
Histogram calculated using DETX and DETY for each event in the final _common_clean file
| Quadrant A | 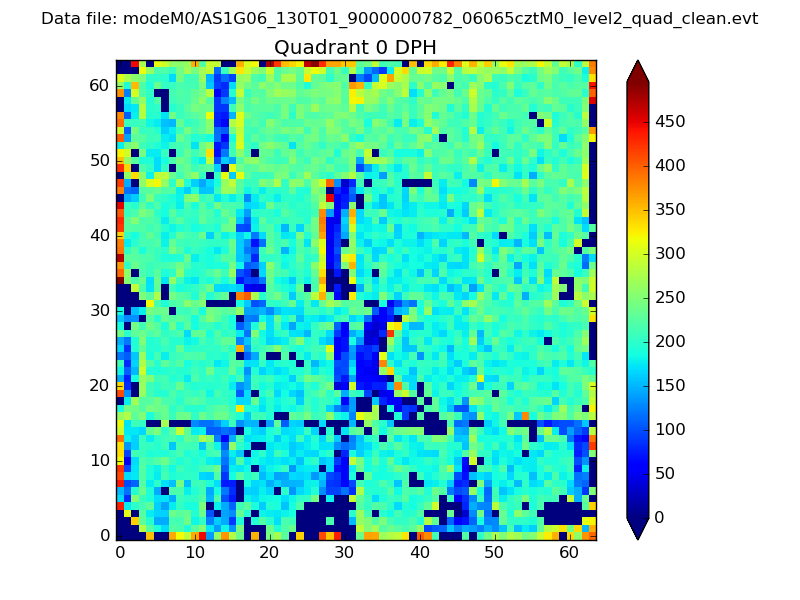 |
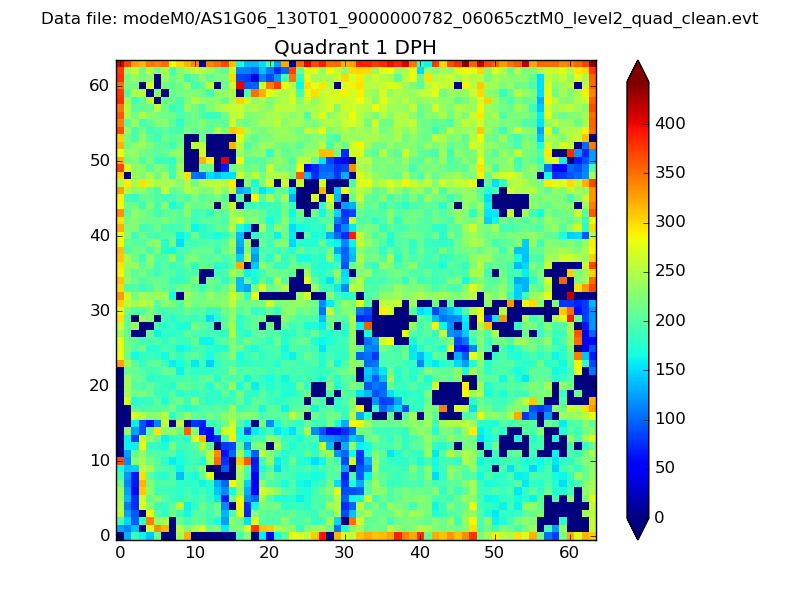 |
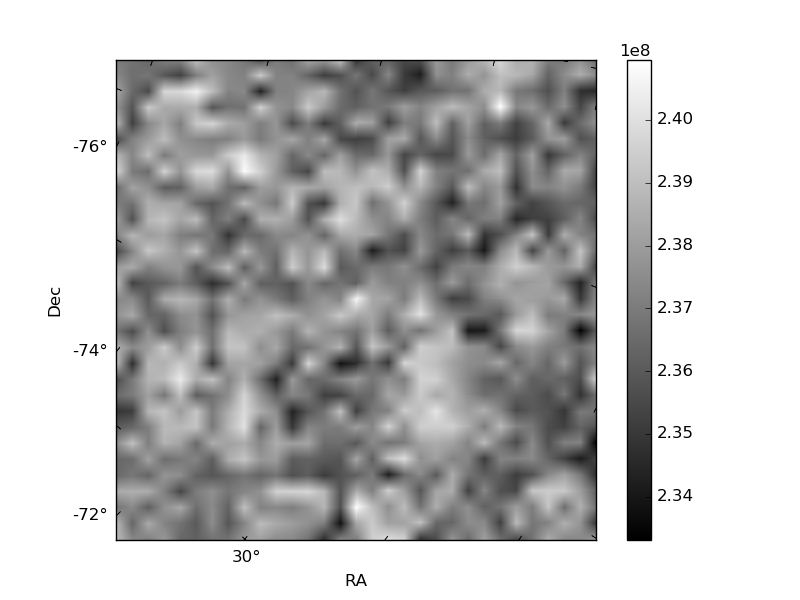
Quadrant B |
|---|---|---|---|
| Quadrant D | 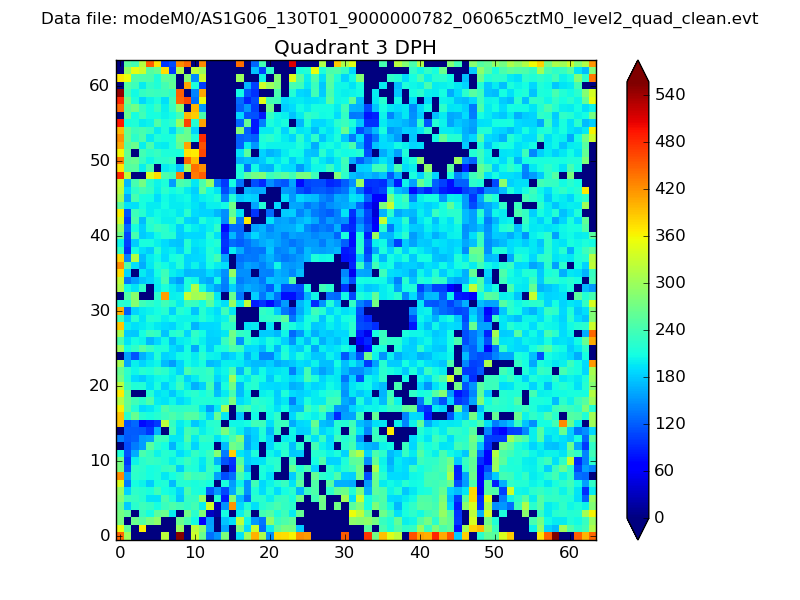 |
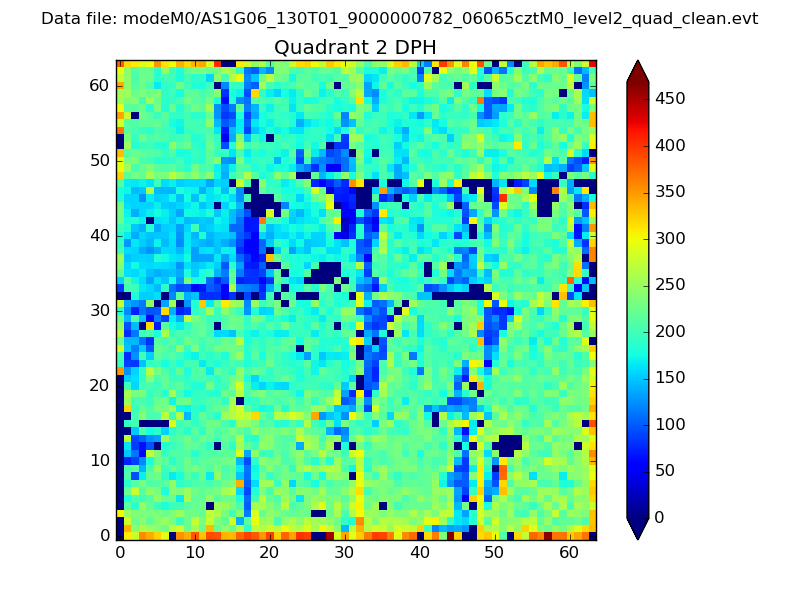 |
Quadrant C |
| Plot type | Count rate plots | Images |
|---|---|---|
| Comparison with Poisson distribution Blue bars denote a histogram of data divided into 1 sec bins. Red curve is a Poisson curve with rate = median count rate of data. |
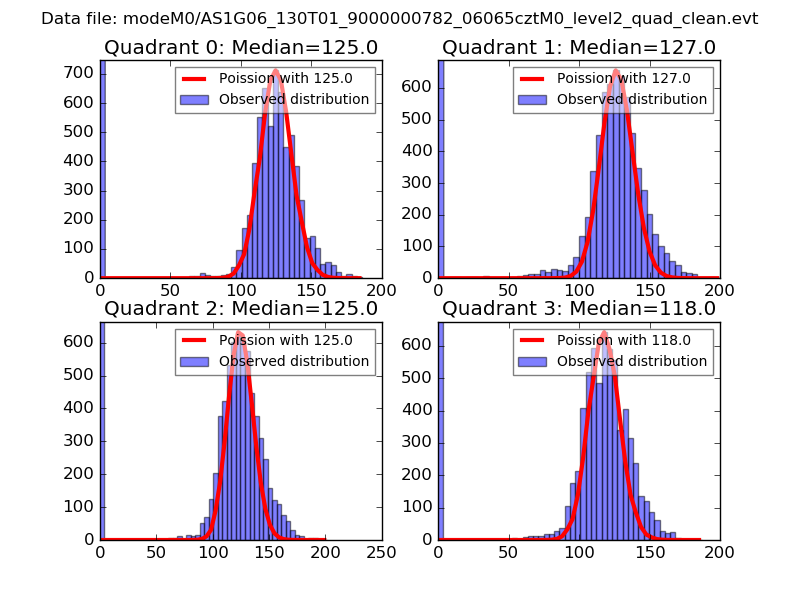 |
 |
| Quadrant-wise count rates Data is divided into 100 sec bins |
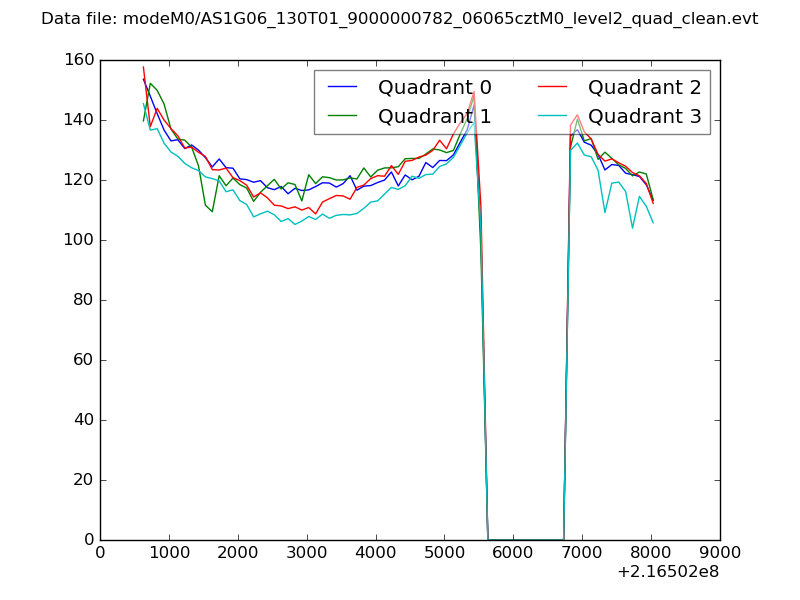 |
|
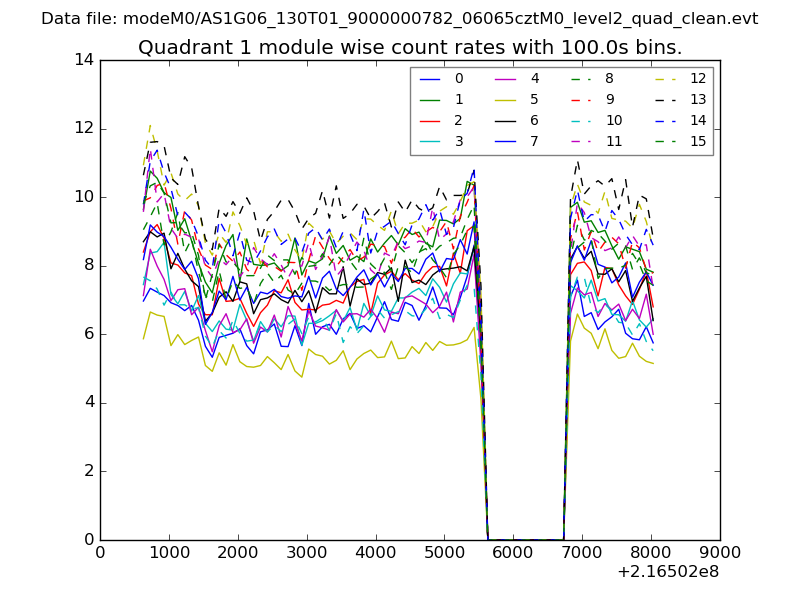
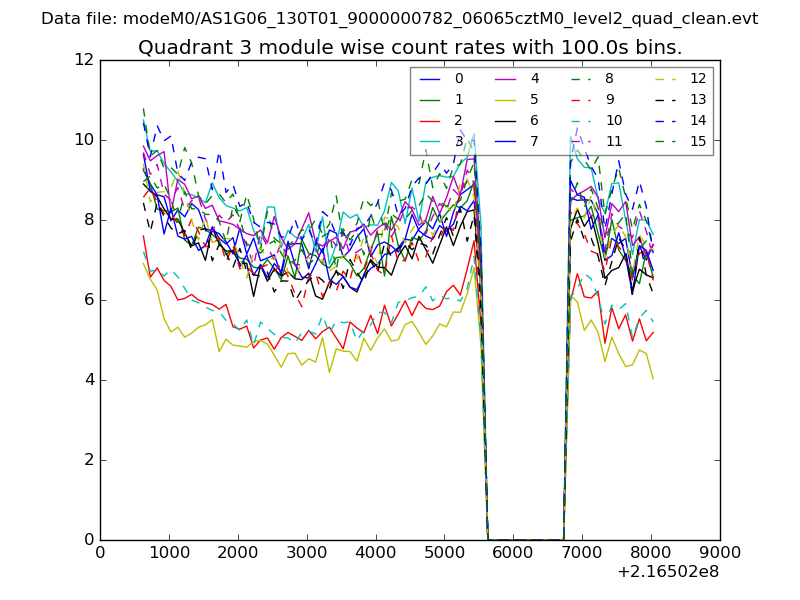
| Module-wise count rates for Quadrant A Data is divided into 100 sec bins |
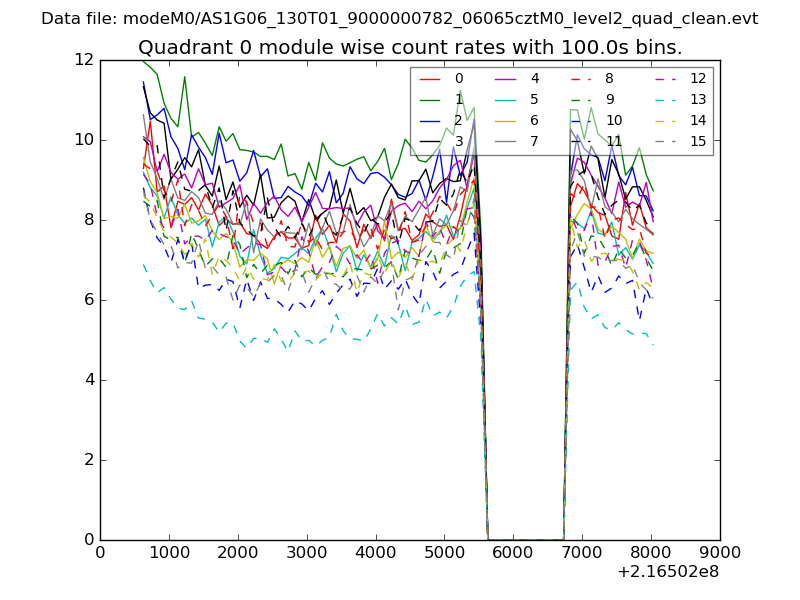 |
 |
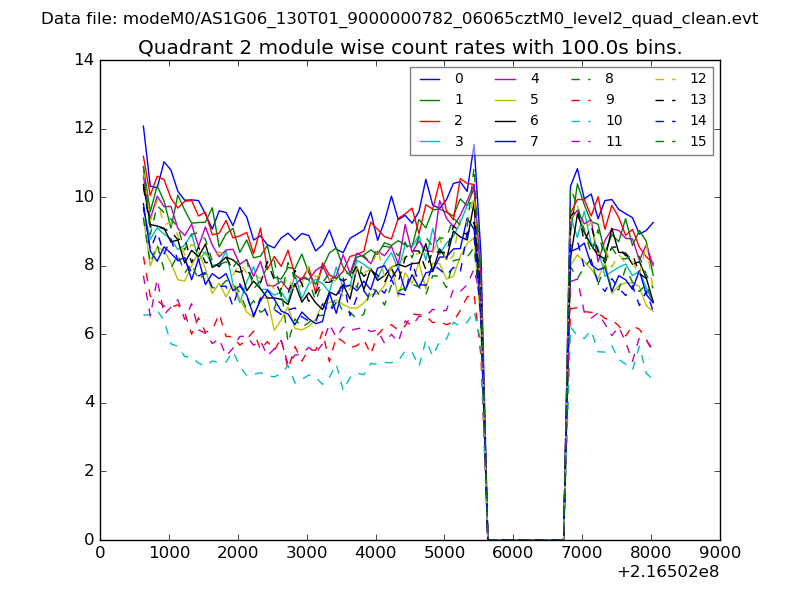
| Module-wise count rates for Quadrant B Data is divided into 100 sec bins |
 |
 |
| Module-wise count rates for Quadrant C Data is divided into 100 sec bins |
 |
 |
| Module-wise count rates for Quadrant D Data is divided into 100 sec bins |
 |
 |
| Parameter | Plot |
|---|---|
| CZT HV Monitor | 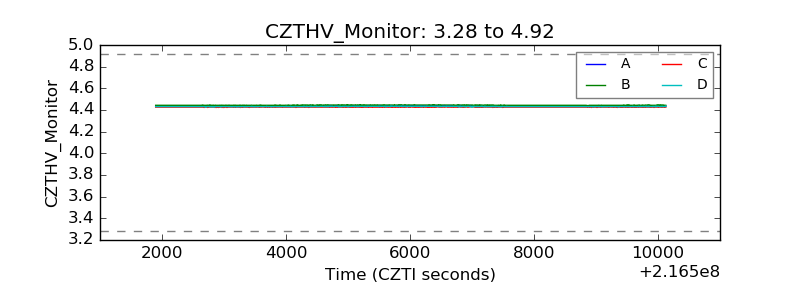 |
| D_VDD | 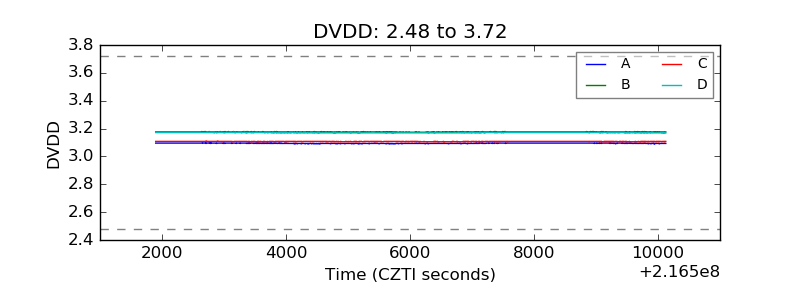 |
| Temperature 1 | 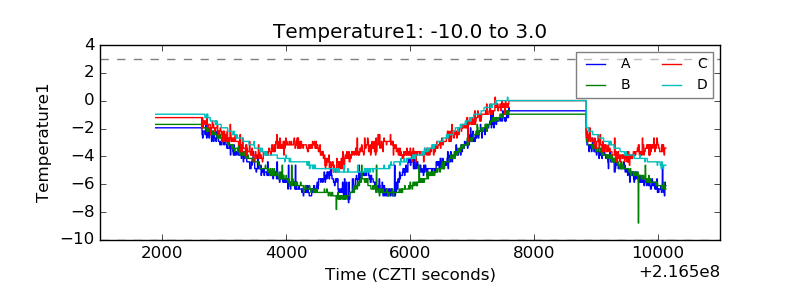 |
| Veto HV Monitor | 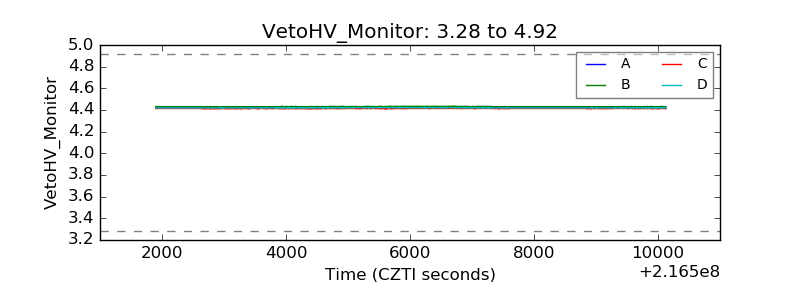 |
| Veto LLD | 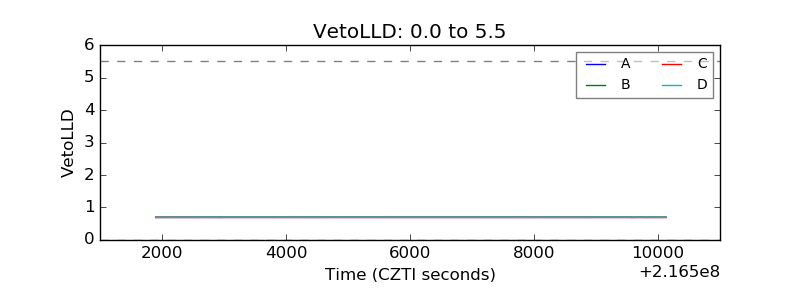 |
| Alpha Counter | 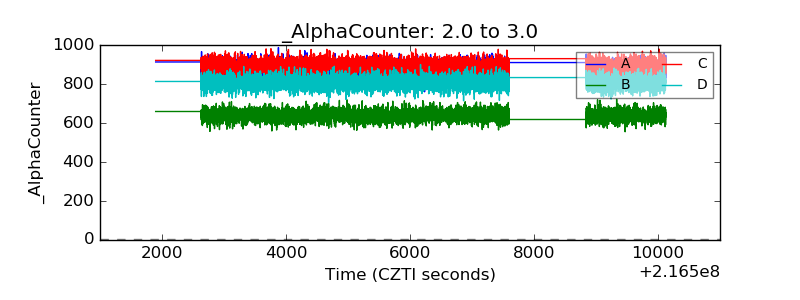 |
| _CPM_Rate | 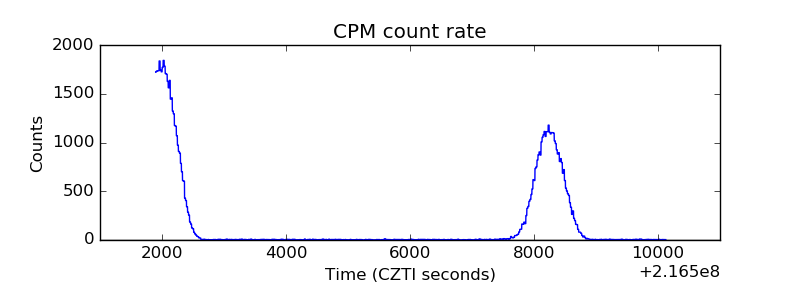 |
| CZT Counter | 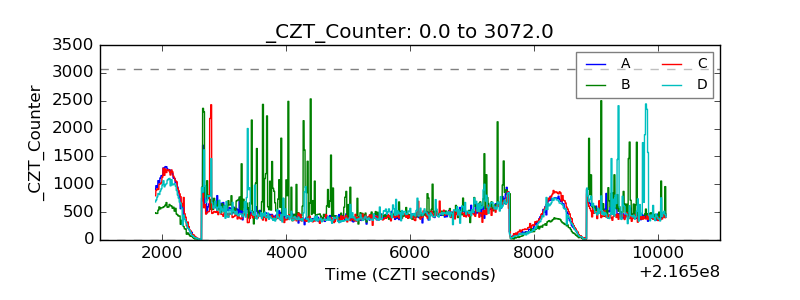 |
| +2.5 Volts monitor | 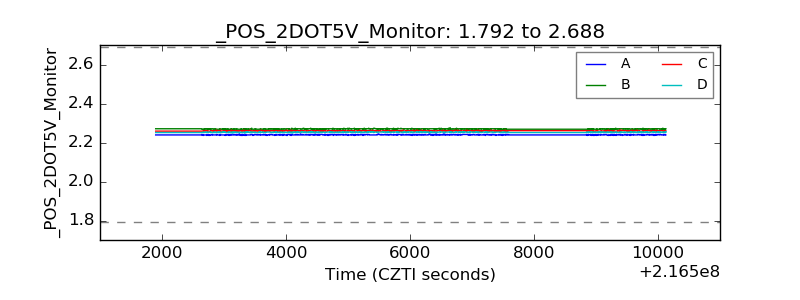 |
| +5 Volts monitor | 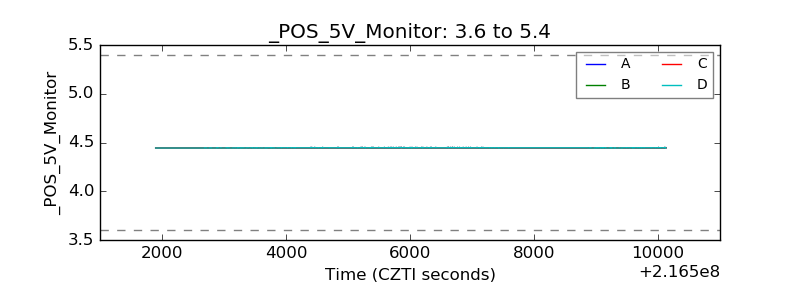 |
| _ROLL_ROT | 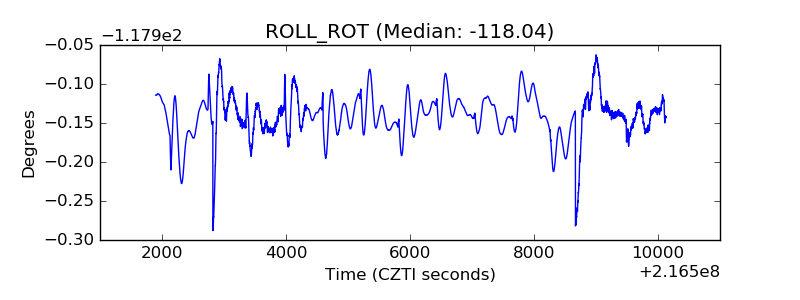 |
| _Roll_DEC | 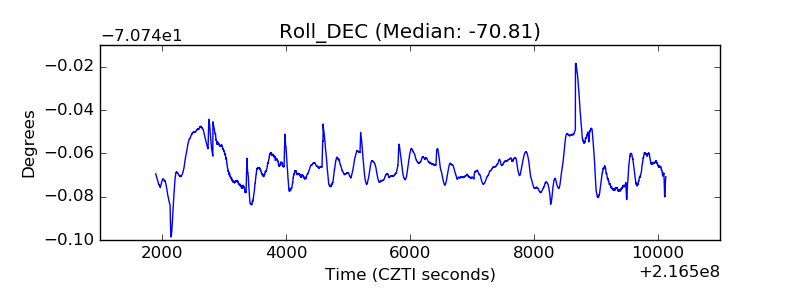 |
| _Roll_RA | 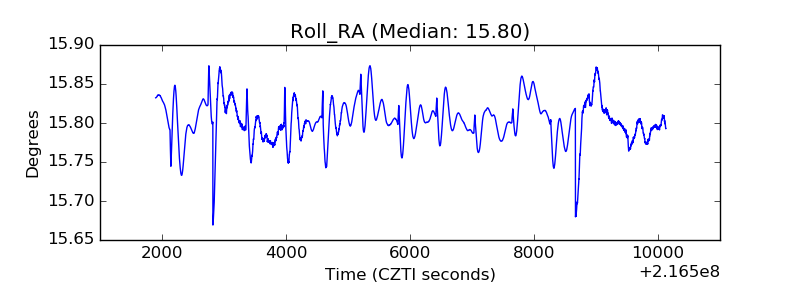 |
| Veto Counter | 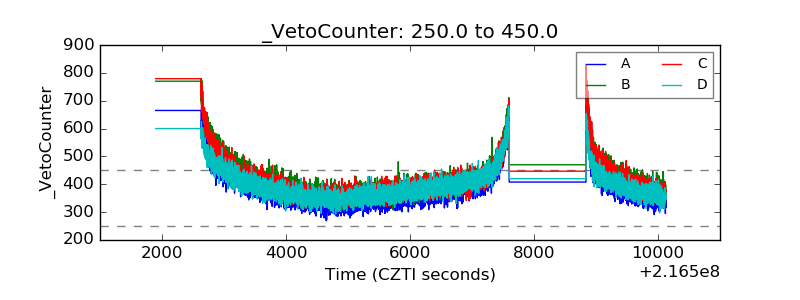 |