| Param | Original file | Final file |
|---|---|---|
| Filename | modeM0/AS1G06_130T01_9000000782_06069cztM0_level2.evt | modeM0/AS1G06_130T01_9000000782_06069cztM0_level2_quad_clean.evt |
| Size (bytes) | 340,286,400 | 92,937,600 |
| Size | 324.5 MB | 88.6 MB |
| Events in quadrant A | 2,445,035 | 616,515 |
| Events in quadrant B | 2,649,412 | 609,165 |
| Events in quadrant C | 2,366,822 | 620,903 |
| Events in quadrant D | 2,478,520 | 592,861 |
| Mode SS | |||
|---|---|---|---|
| Quadrant | BADHDUFLAG | Total packets | Discarded packets |
| A | 0 | 141 | 26 |
| B | 0 | 142 | 36 |
| C | 0 | 142 | 38 |
| D | 0 | 141 | 27 |
| Mode M0 | |||
|---|---|---|---|
| Quadrant | BADHDUFLAG | Total packets | Discarded packets |
| A | 0 | 14587 | 3503 |
| B | 0 | 15488 | 4076 |
| C | 0 | 14457 | 3393 |
| D | 0 | 14955 | 3661 |
| Quadrant | Total seconds | Saturated seconds | Saturation percentage |
|---|---|---|---|
| A | 5350 | 118 | 2.205607% |
| B | 5218 | 157 | 3.008816% |
| C | 5367 | 87 | 1.621017% |
| D | 5335 | 115 | 2.155576% |
Noise dominated data is calculated using 1-second bins in cleaned event files. If a bin has >2000 counts, and if more than 50% of those come from <1% of pixels, then it is considered to be noise-dominated and hence unusable.
| Quadrant | # 1 sec bins | Bins with >0 counts | Bins with >2000 counts | High rate bins dominated by noise | Noise dominated (total time) | Noise dominated (detector-on time) | Marked lightcurve |
|---|---|---|---|---|---|---|---|
| A | 7134 | 6339 | 0 | 0 | 0.00% | 0.00% | 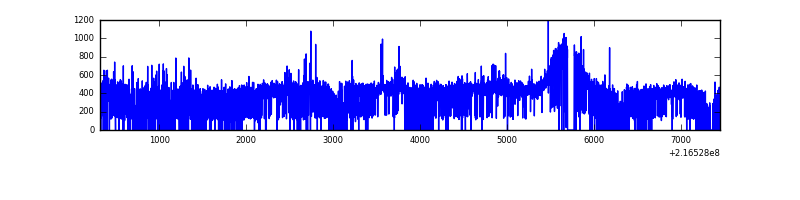 |
| B | 7134 | 6282 | 7 | 7 | 0.10% | 0.11% | 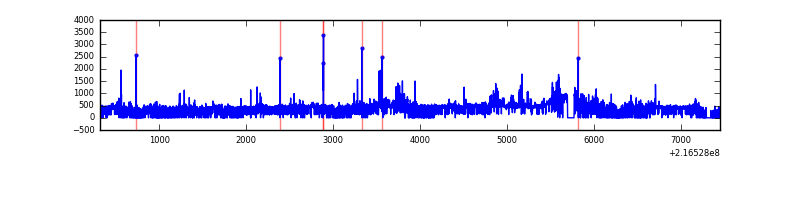 |
| C | 7131 | 6360 | 0 | 0 | 0.00% | 0.00% | 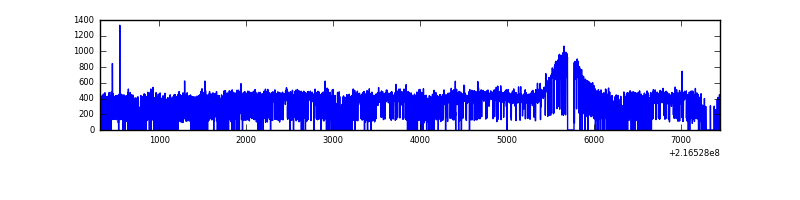 |
| D | 7133 | 6365 | 35 | 35 | 0.49% | 0.55% | 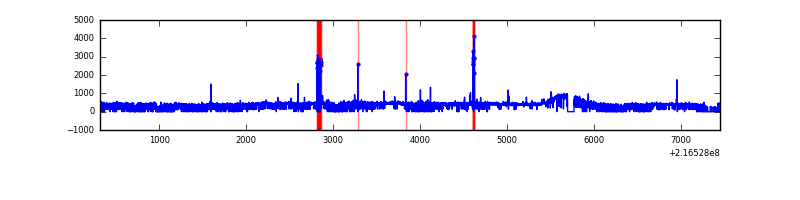 |
Top three noisy pixels from each quadrant. If the there are fewer than three noisy pixels in the level2.evt file, extra rows are filled as -1
| Pixel properties | Quadrant properties | ||||||
|---|---|---|---|---|---|---|---|
| Quadrant | DetID | PixID | Counts | Sigma | Mean | Median | Sigma |
| A | 8 | 15 | 73888 | 574.72 | 612 | 594 | 127.5 |
| A | 13 | 251 | 7721 | 55.88 | 612 | 594 | 127.5 |
| A | 12 | 194 | 6041 | 42.71 | 612 | 594 | 127.5 |
| B | 3 | 64 | 106591 | 911.29 | 600 | 584 | 116.3 |
| B | 4 | 81 | 78684 | 671.39 | 600 | 584 | 116.3 |
| B | 15 | 204 | 58273 | 495.92 | 600 | 584 | 116.3 |
| C | 9 | 54 | 15510 | 106.64 | 600 | 599 | 139.8 |
| C | 13 | 61 | 4727 | 29.52 | 600 | 599 | 139.8 |
| C | 8 | 128 | 3649 | 21.81 | 600 | 599 | 139.8 |
| D | 5 | 239 | 64053 | 429.63 | 595 | 573 | 147.8 |
| D | 10 | 15 | 60991 | 408.91 | 595 | 573 | 147.8 |
| D | 13 | 169 | 47588 | 318.2 | 595 | 573 | 147.8 |
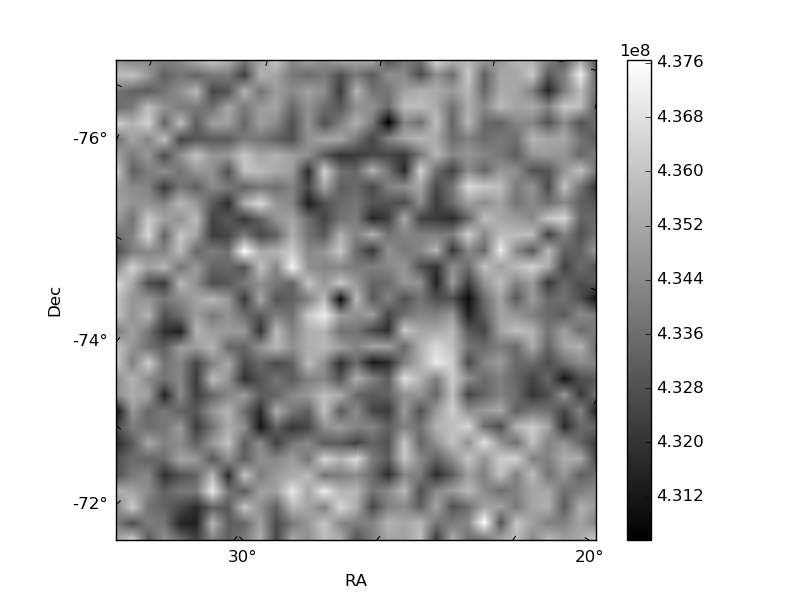
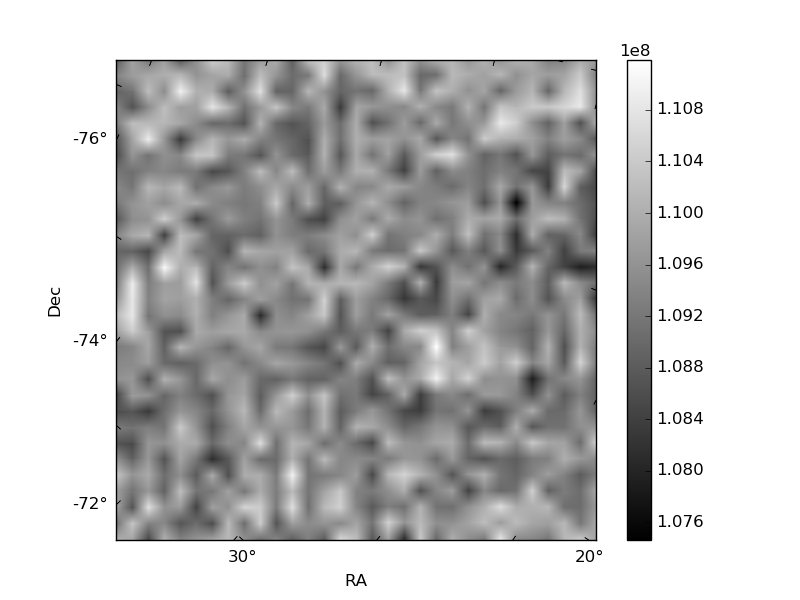
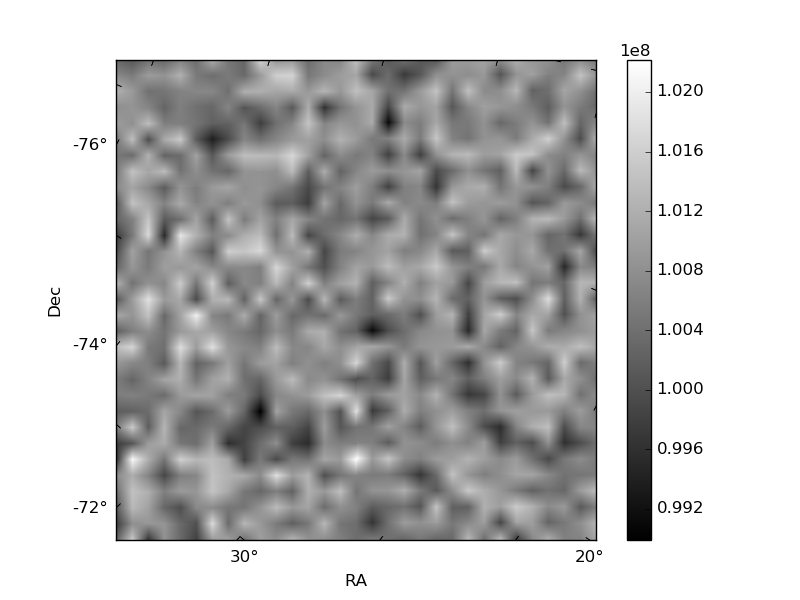
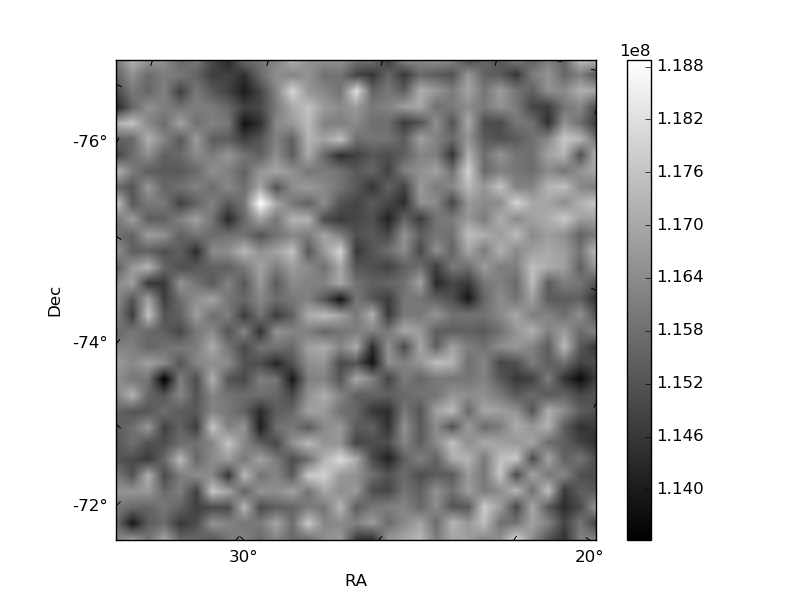
Histogram calculated using DETX and DETY for each event in the final _common_clean file
| Quadrant A | 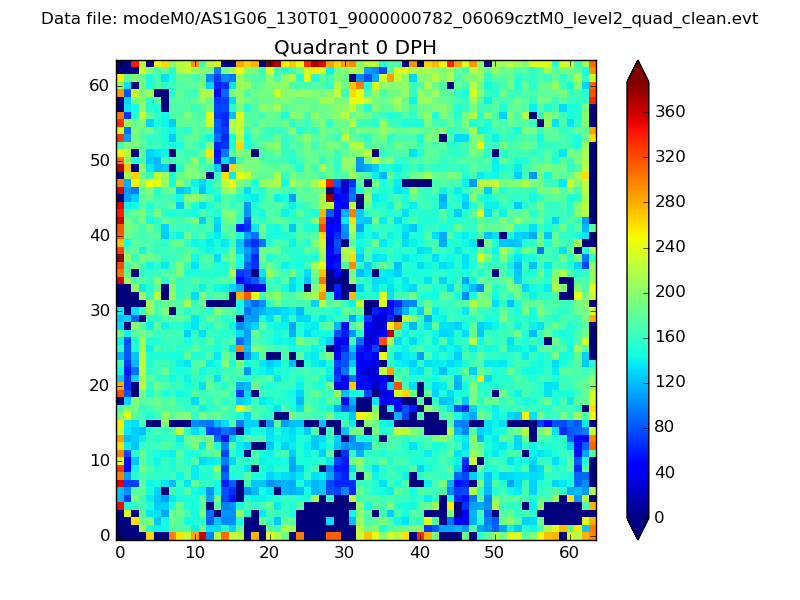 |
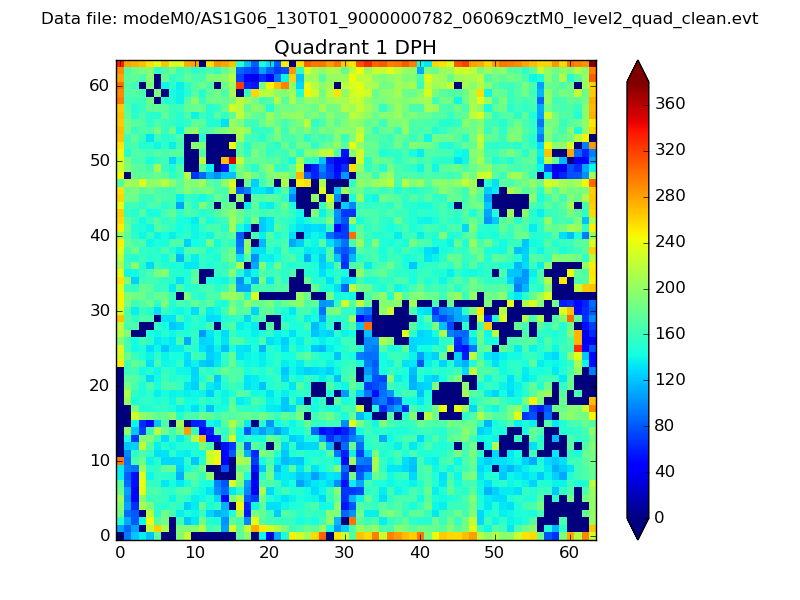 |
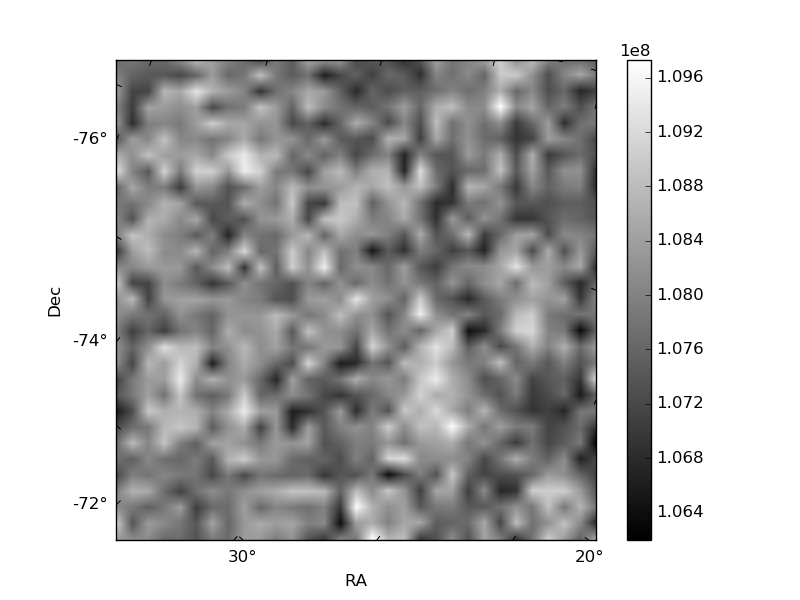
Quadrant B |
|---|---|---|---|
| Quadrant D | 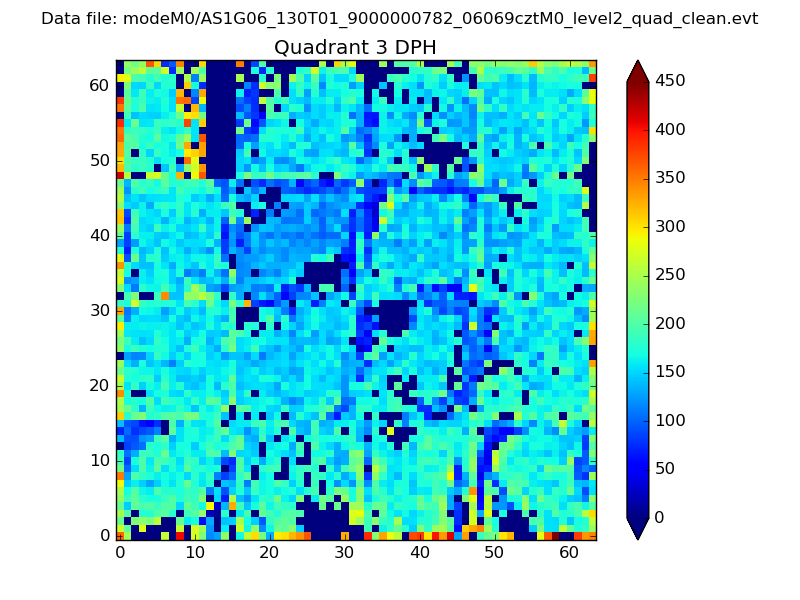 |
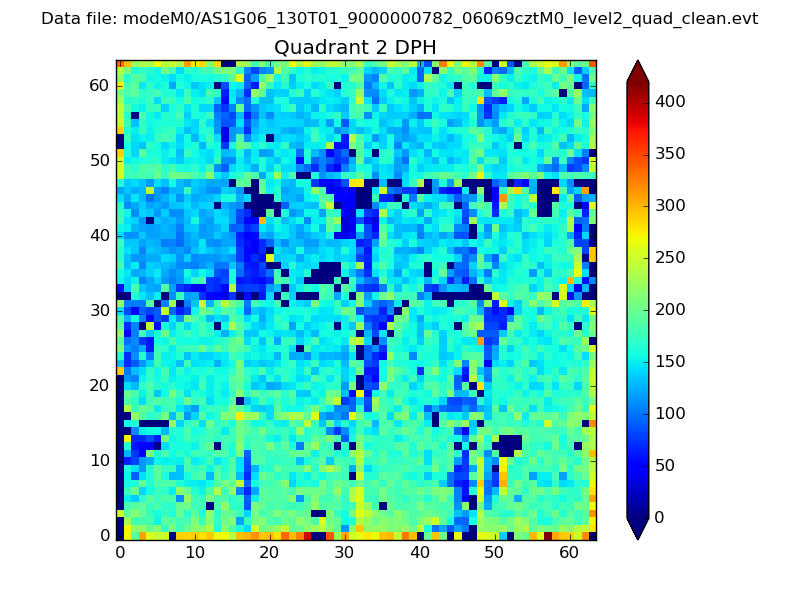 |
Quadrant C |
| Plot type | Count rate plots | Images |
|---|---|---|
| Comparison with Poisson distribution Blue bars denote a histogram of data divided into 1 sec bins. Red curve is a Poisson curve with rate = median count rate of data. |
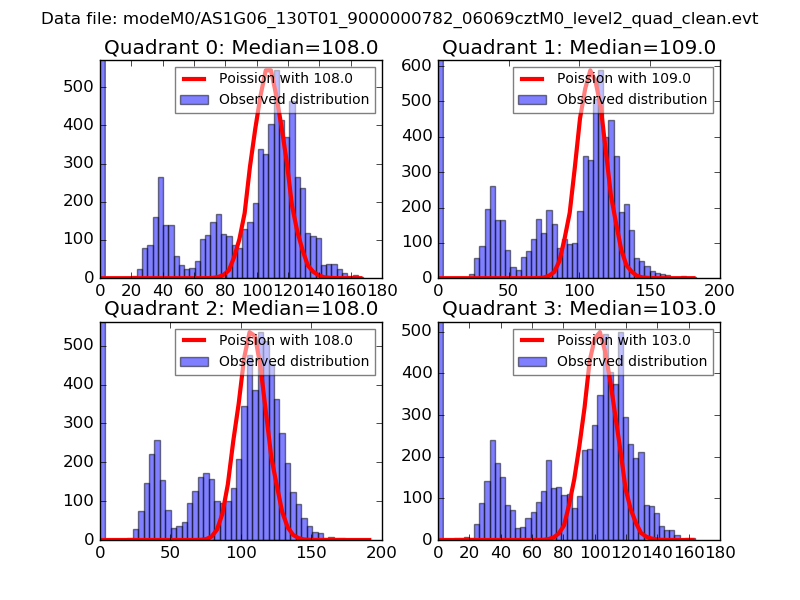 |
 |
| Quadrant-wise count rates Data is divided into 100 sec bins |
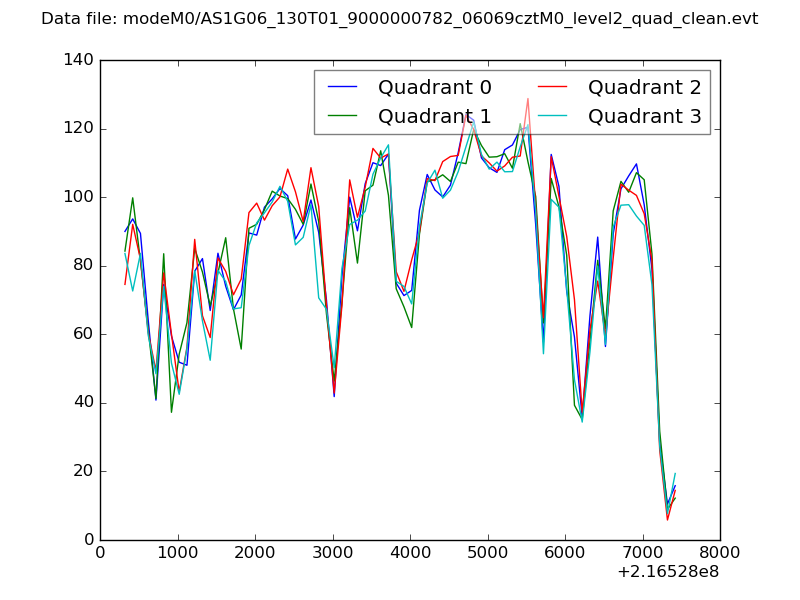 |
|
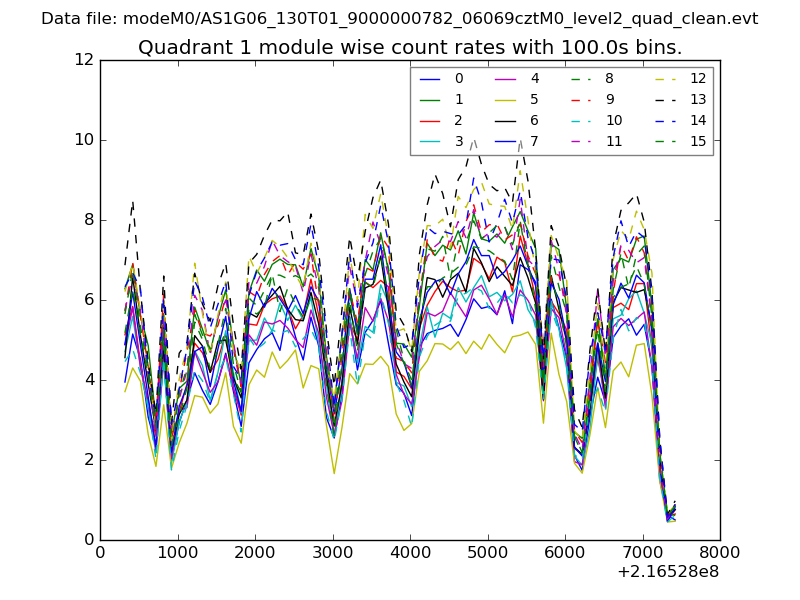
| Module-wise count rates for Quadrant A Data is divided into 100 sec bins |
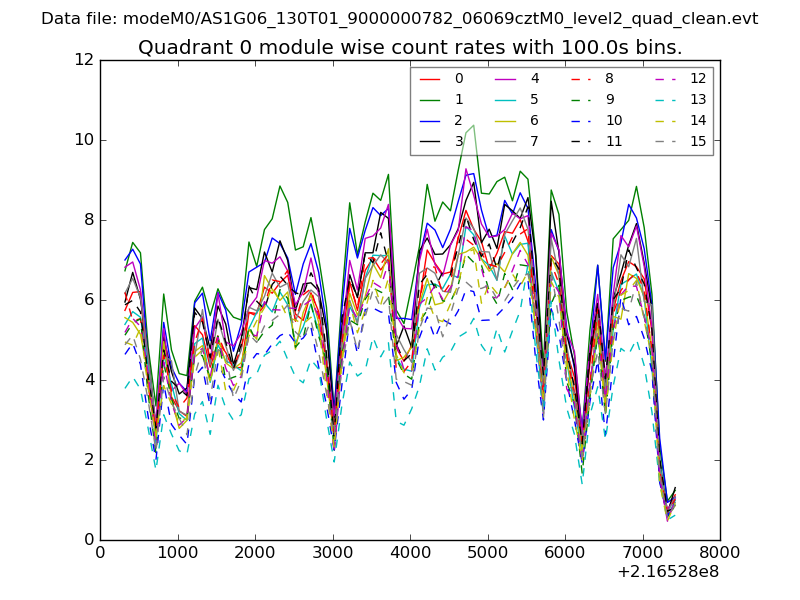 |
 |
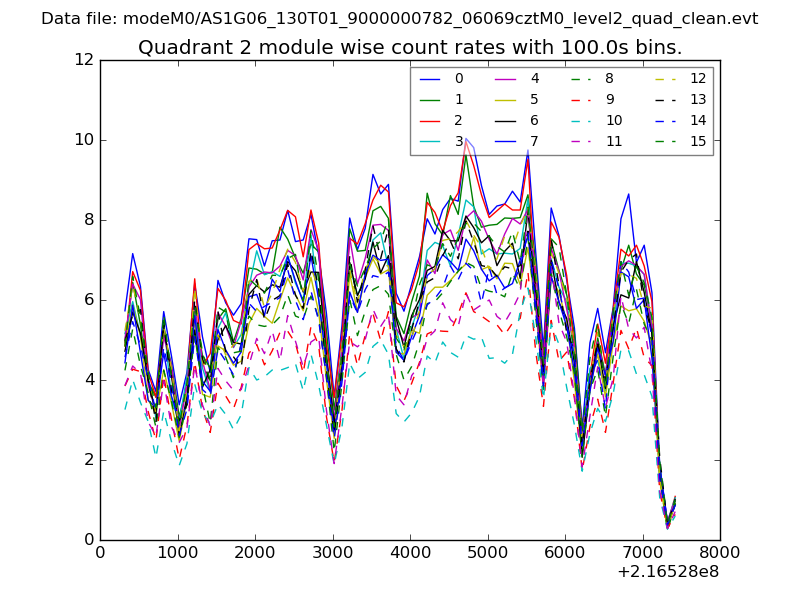
| Module-wise count rates for Quadrant B Data is divided into 100 sec bins |
 |
 |
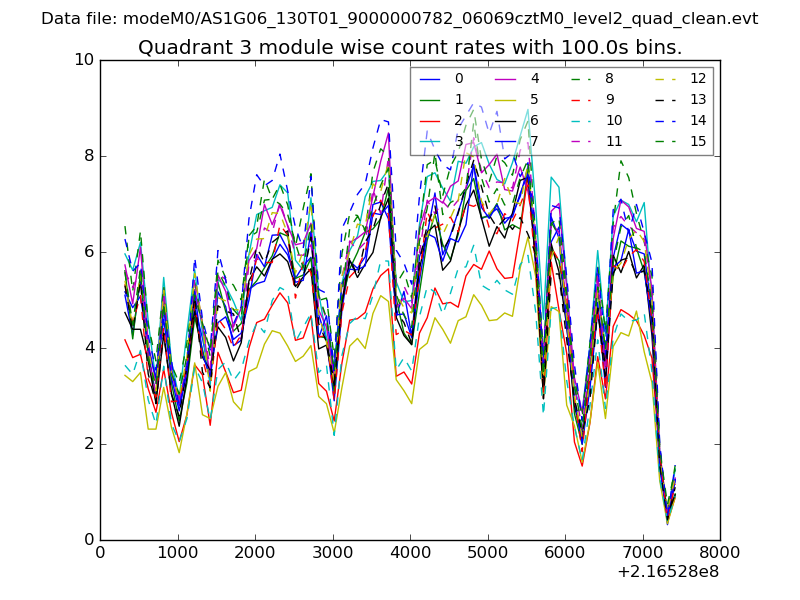
| Module-wise count rates for Quadrant C Data is divided into 100 sec bins |
 |
 |
| Module-wise count rates for Quadrant D Data is divided into 100 sec bins |
 |
 |
| Parameter | Plot |
|---|---|
| CZT HV Monitor | 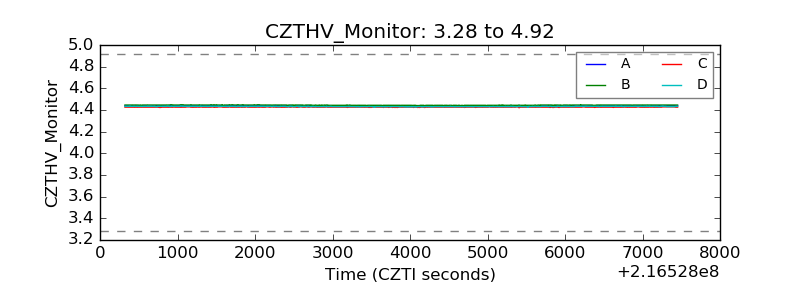 |
| D_VDD | 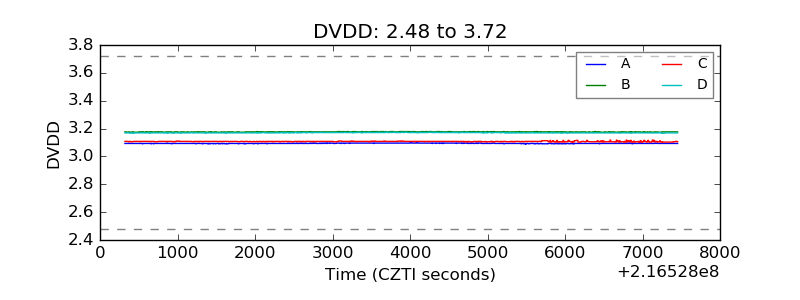 |
| Temperature 1 | 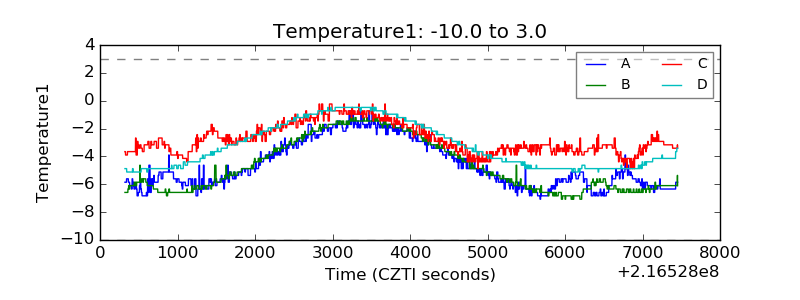 |
| Veto HV Monitor | 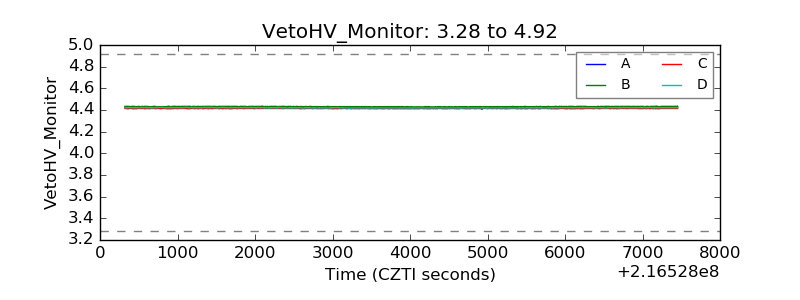 |
| Veto LLD | 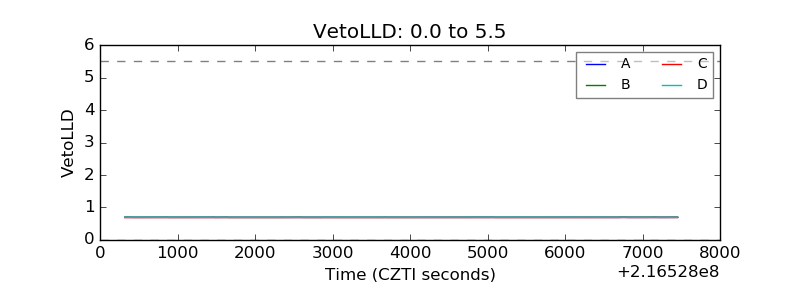 |
| Alpha Counter | 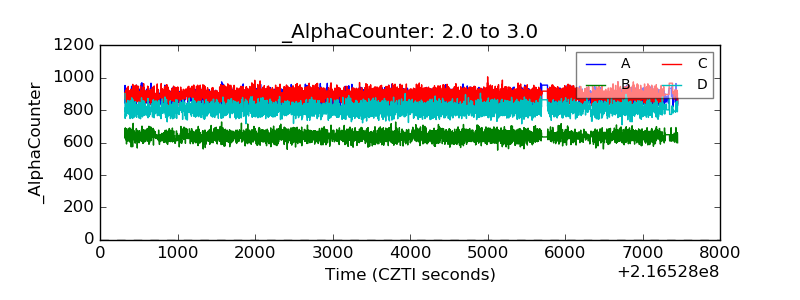 |
| _CPM_Rate | 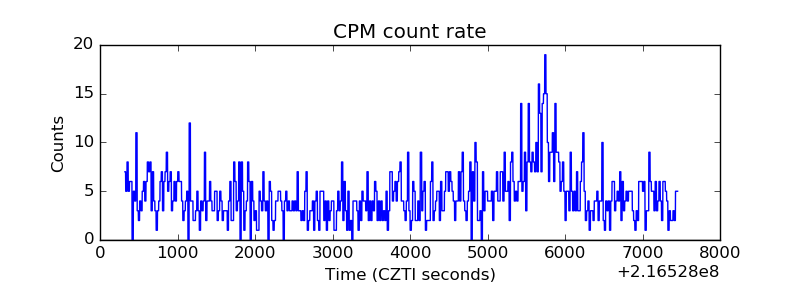 |
| CZT Counter | 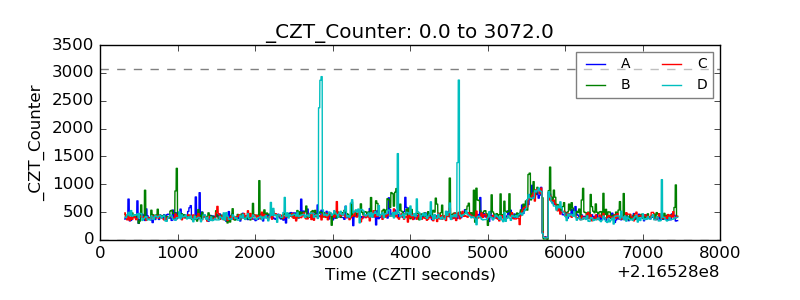 |
| +2.5 Volts monitor | 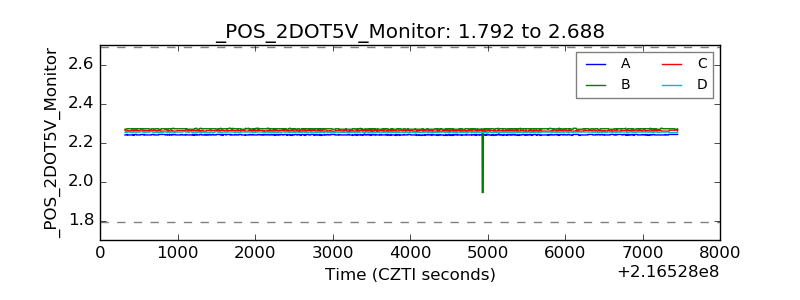 |
| +5 Volts monitor |  |
| _ROLL_ROT | 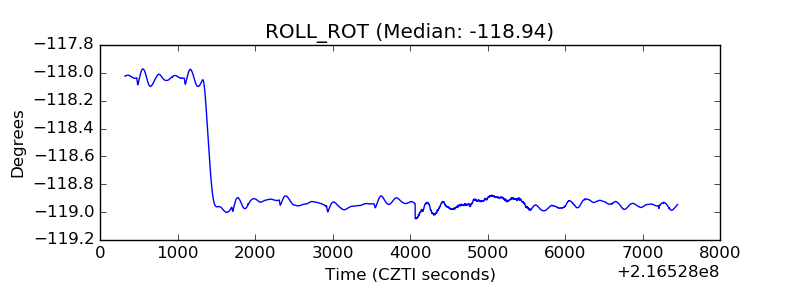 |
| _Roll_DEC | 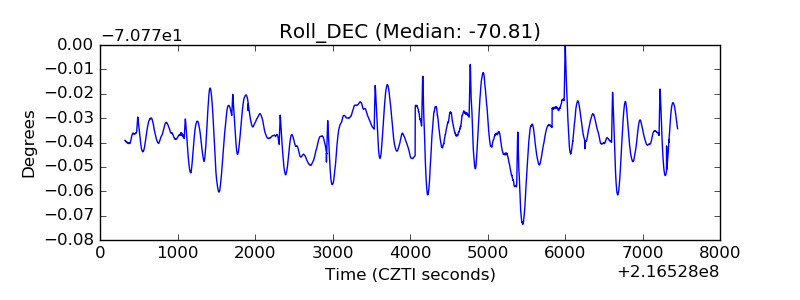 |
| _Roll_RA | 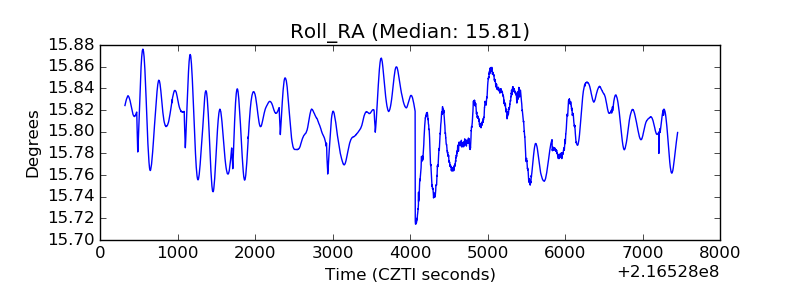 |
| Veto Counter | 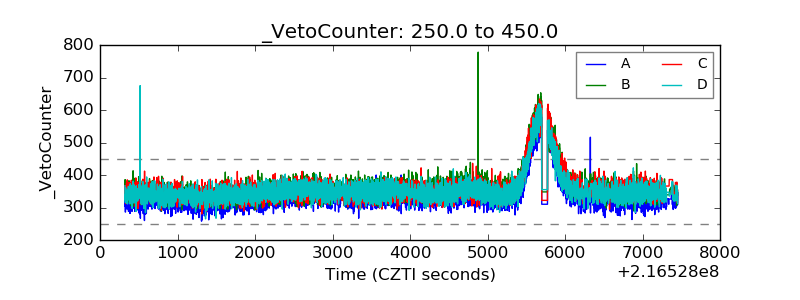 |