| Param | Original file | Final file |
|---|---|---|
| Filename | modeM0/AS1G06_130T01_9000000782_06076cztM0_level2.evt | modeM0/AS1G06_130T01_9000000782_06076cztM0_level2_quad_clean.evt |
| Size (bytes) | 1,230,592,320 | 295,159,680 |
| Size | 1.1 GB | 281.5 MB |
| Events in quadrant A | 7,907,889 | 1,961,777 |
| Events in quadrant B | 9,139,942 | 1,980,448 |
| Events in quadrant C | 9,209,974 | 1,940,717 |
| Events in quadrant D | 9,852,699 | 1,876,620 |
| Mode SS | |||
|---|---|---|---|
| Quadrant | BADHDUFLAG | Total packets | Discarded packets |
| A | 0 | 350 | 0 |
| B | 0 | 350 | 0 |
| C | 0 | 350 | 0 |
| D | 0 | 350 | 0 |
| Mode M9 | |||
|---|---|---|---|
| Quadrant | BADHDUFLAG | Total packets | Discarded packets |
| A | 0 | 4 | 0 |
| B | 0 | 4 | 0 |
| C | 0 | 4 | 0 |
| D | 0 | 4 | 0 |
| Mode M0 | |||
|---|---|---|---|
| Quadrant | BADHDUFLAG | Total packets | Discarded packets |
| A | 0 | 35594 | 2 |
| B | 0 | 38885 | 2 |
| C | 0 | 40095 | 2 |
| D | 0 | 41731 | 4 |
| Quadrant | Total seconds | Saturated seconds | Saturation percentage |
|---|---|---|---|
| A | 17112 | 339 | 1.981066% |
| B | 17112 | 599 | 3.500468% |
| C | 17112 | 877 | 5.125058% |
| D | 17111 | 742 | 4.336392% |
Noise dominated data is calculated using 1-second bins in cleaned event files. If a bin has >2000 counts, and if more than 50% of those come from <1% of pixels, then it is considered to be noise-dominated and hence unusable.
| Quadrant | # 1 sec bins | Bins with >0 counts | Bins with >2000 counts | High rate bins dominated by noise | Noise dominated (total time) | Noise dominated (detector-on time) | Marked lightcurve |
|---|---|---|---|---|---|---|---|
| A | 17417 | 17116 | 1 | 1 | 0.01% | 0.01% | 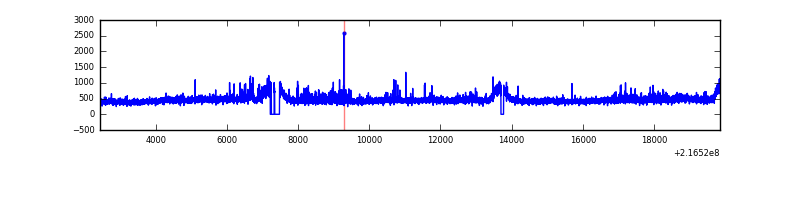 |
| B | 17416 | 17113 | 83 | 83 | 0.48% | 0.49% | 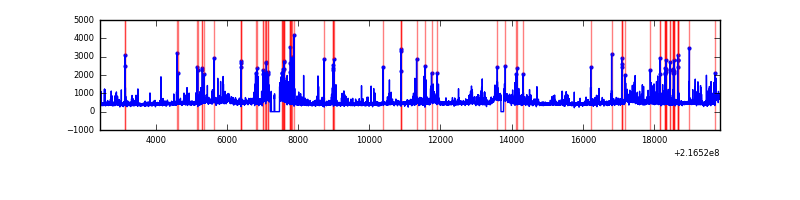 |
| C | 17417 | 17115 | 519 | 519 | 2.98% | 3.03% | 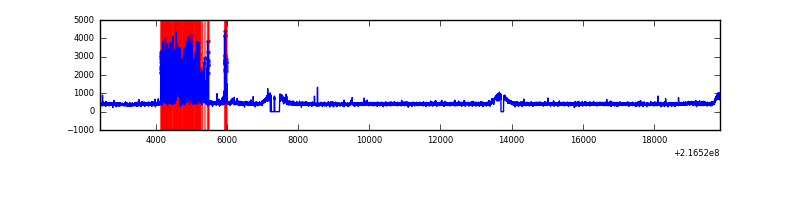 |
| D | 17417 | 17116 | 484 | 484 | 2.78% | 2.83% | 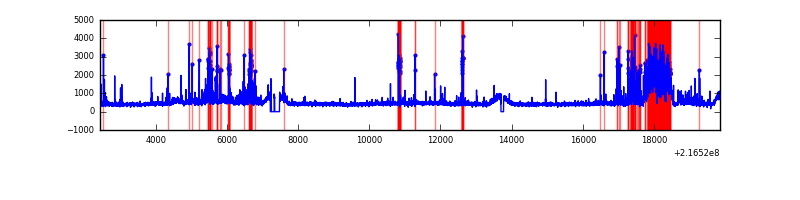 |
Top three noisy pixels from each quadrant. If the there are fewer than three noisy pixels in the level2.evt file, extra rows are filled as -1
| Pixel properties | Quadrant properties | ||||||
|---|---|---|---|---|---|---|---|
| Quadrant | DetID | PixID | Counts | Sigma | Mean | Median | Sigma |
| A | 8 | 15 | 384362 | 958.83 | 1938 | 1886 | 398.9 |
| A | 13 | 251 | 31562 | 74.4 | 1938 | 1886 | 398.9 |
| A | 14 | 111 | 21762 | 49.83 | 1938 | 1886 | 398.9 |
| B | 3 | 64 | 645233 | 1728.62 | 1948 | 1895 | 372.2 |
| B | 4 | 81 | 341980 | 913.79 | 1948 | 1895 | 372.2 |
| B | 15 | 204 | 184790 | 491.43 | 1948 | 1895 | 372.2 |
| C | 9 | 16 | 1748140 | 4080.55 | 1864 | 1867 | 428.0 |
| C | 9 | 68 | 112488 | 258.49 | 1864 | 1867 | 428.0 |
| C | 8 | 128 | 25038 | 54.14 | 1864 | 1867 | 428.0 |
| D | 13 | 169 | 1661748 | 3622.26 | 1877 | 1812 | 458.3 |
| D | 2 | 33 | 325267 | 705.83 | 1877 | 1812 | 458.3 |
| D | 2 | 63 | 165547 | 357.3 | 1877 | 1812 | 458.3 |
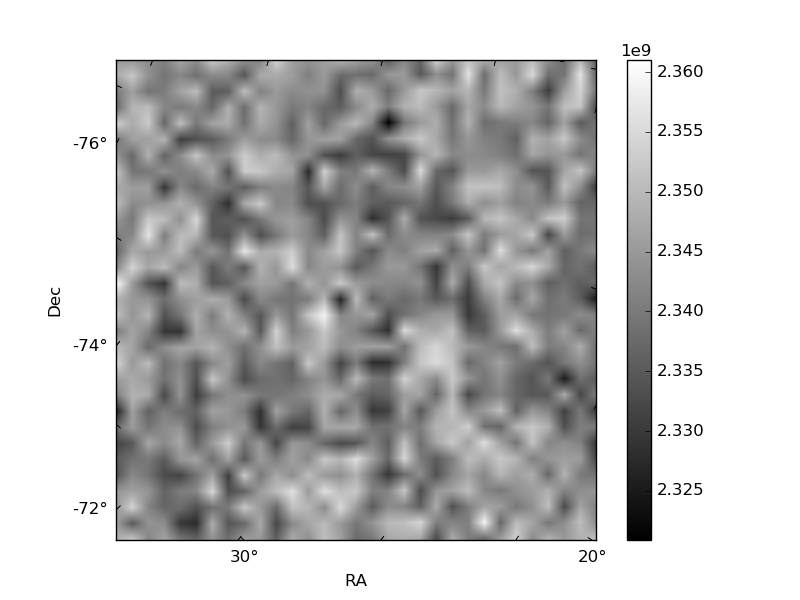
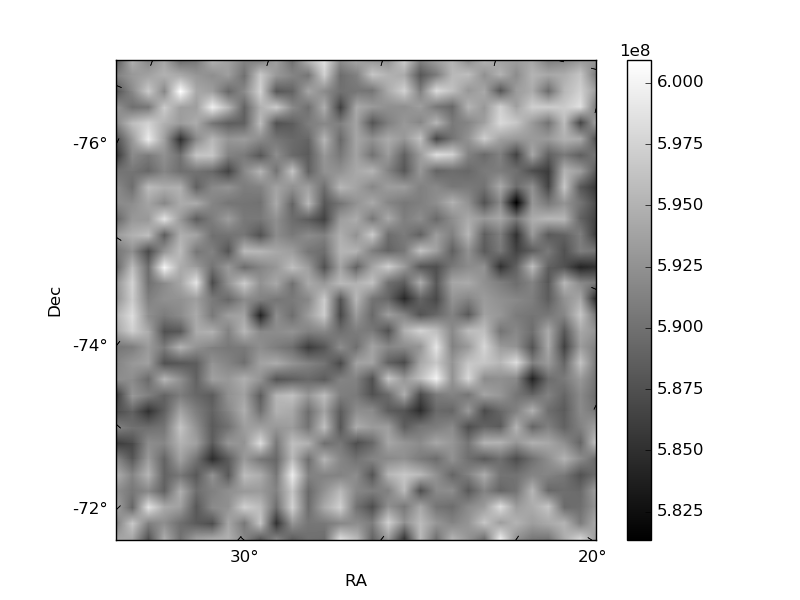
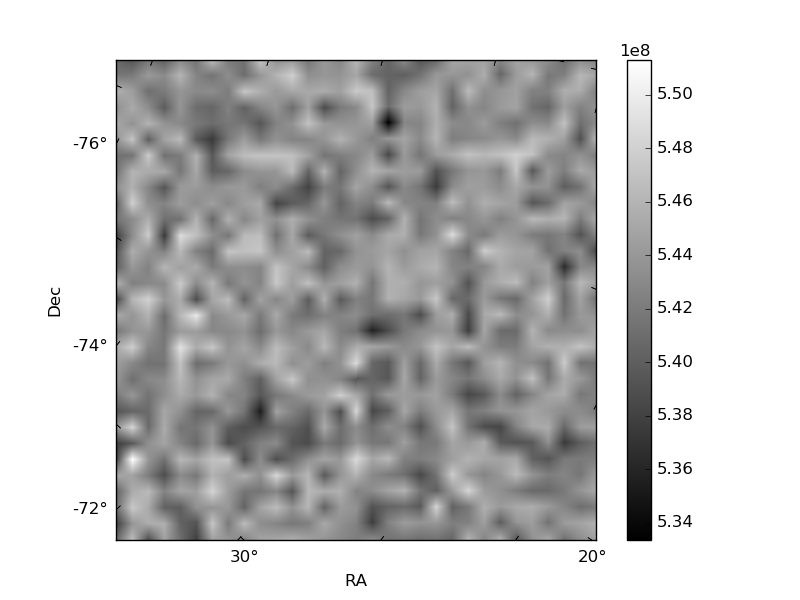
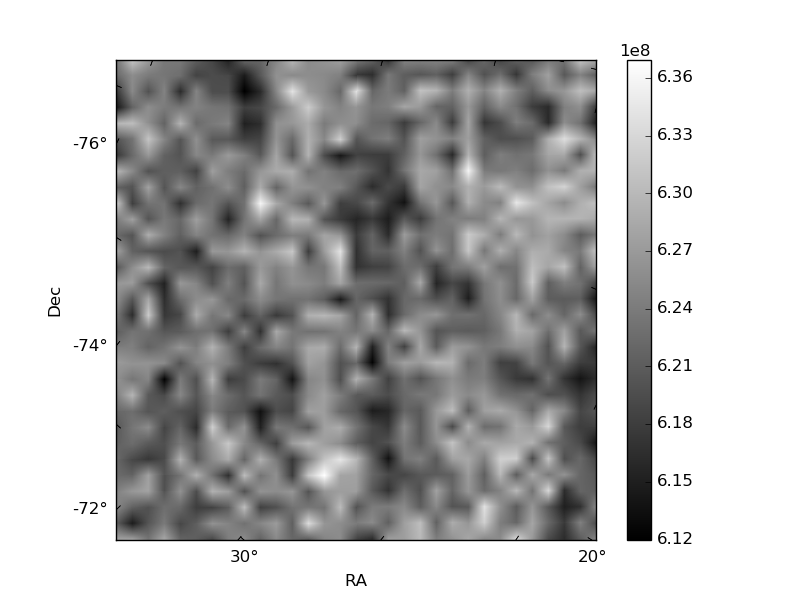
Histogram calculated using DETX and DETY for each event in the final _common_clean file
| Quadrant A | 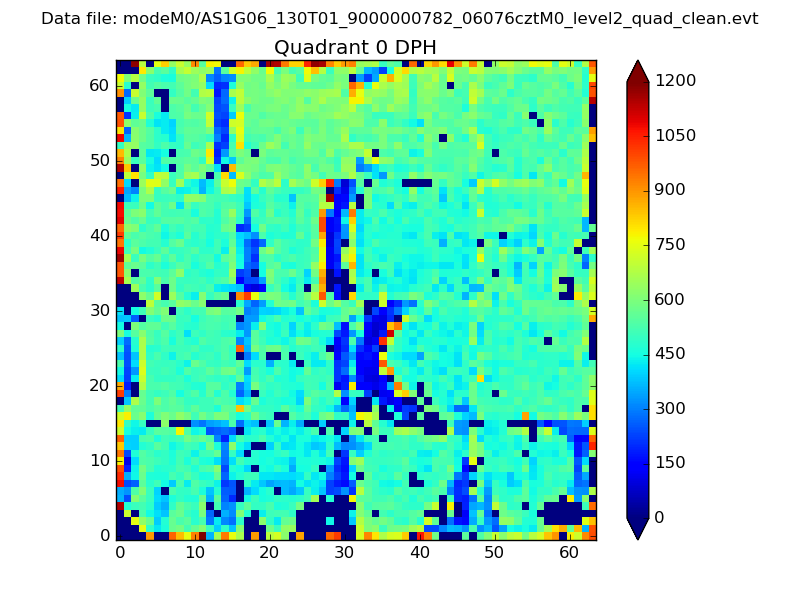 |
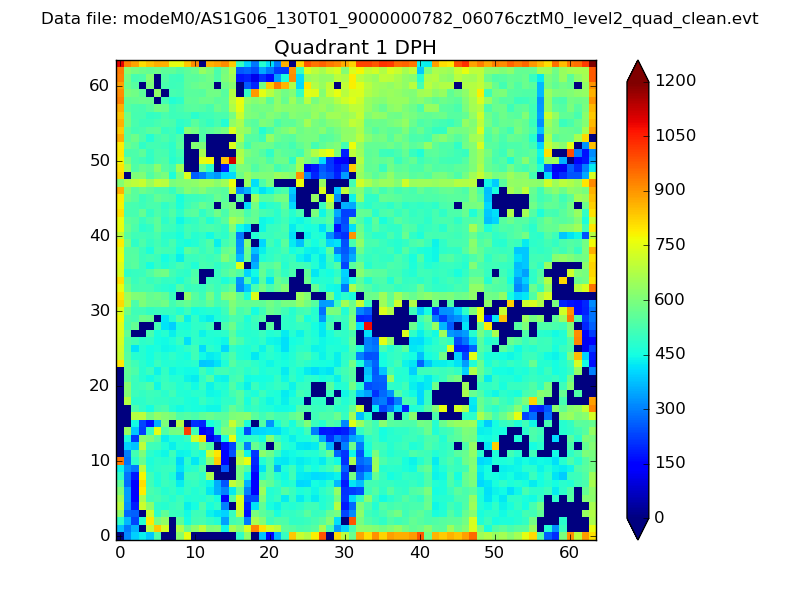 |
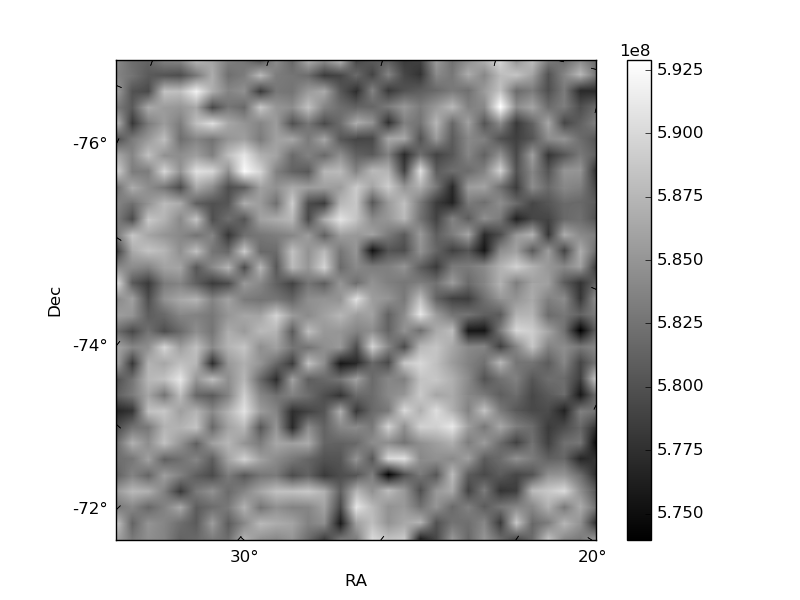
Quadrant B |
|---|---|---|---|
| Quadrant D | 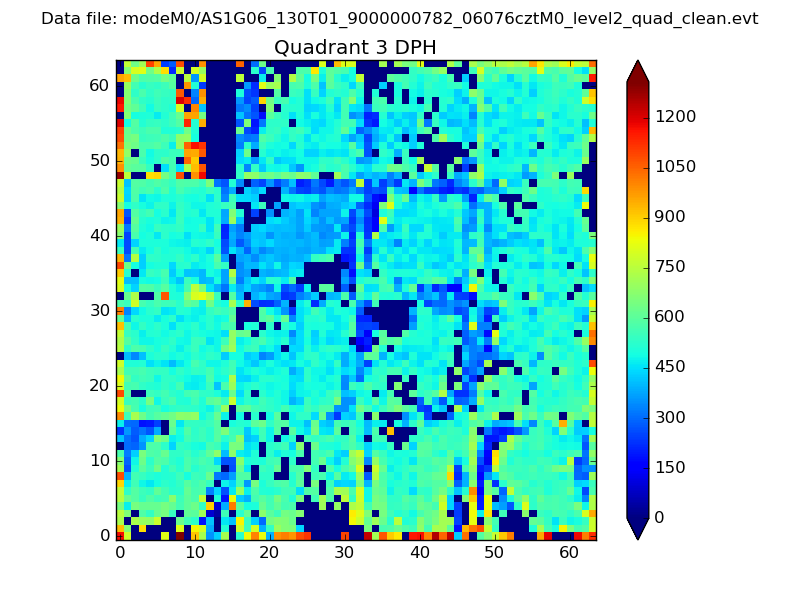 |
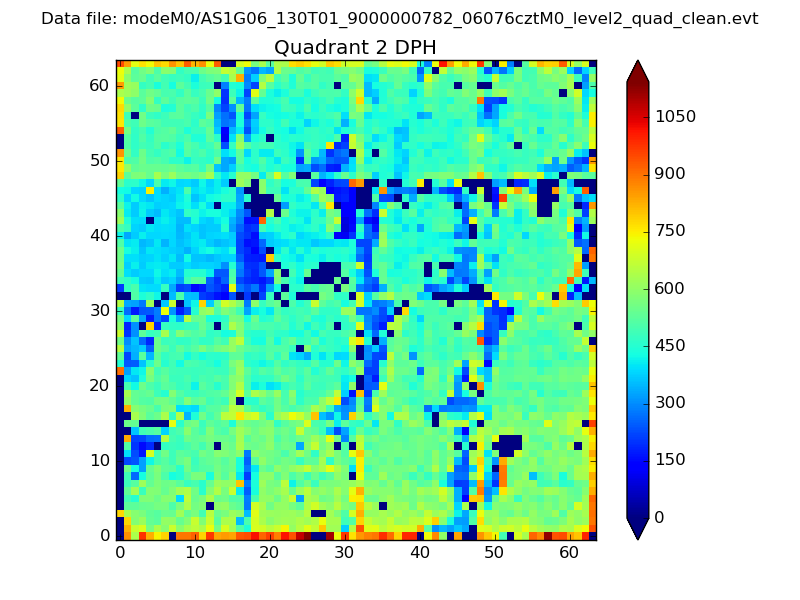 |
Quadrant C |
| Plot type | Count rate plots | Images |
|---|---|---|
| Comparison with Poisson distribution Blue bars denote a histogram of data divided into 1 sec bins. Red curve is a Poisson curve with rate = median count rate of data. |
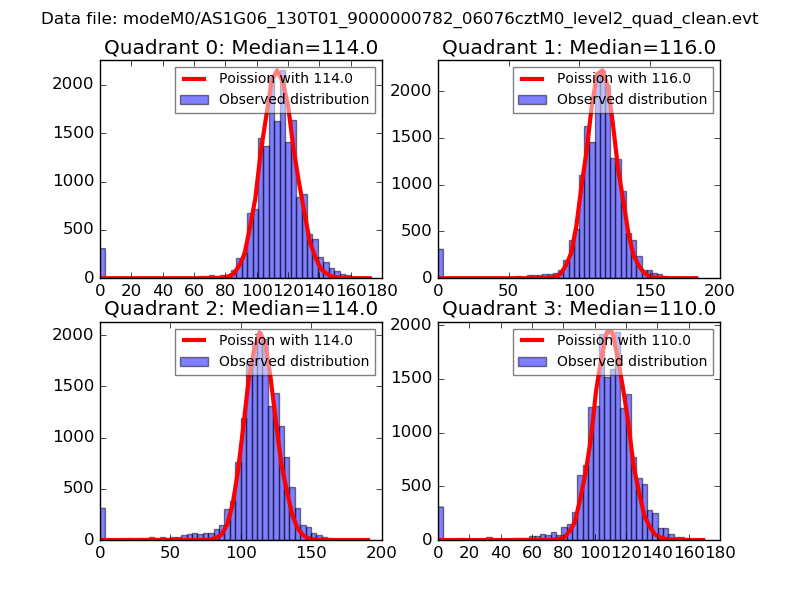 |
 |
| Quadrant-wise count rates Data is divided into 100 sec bins |
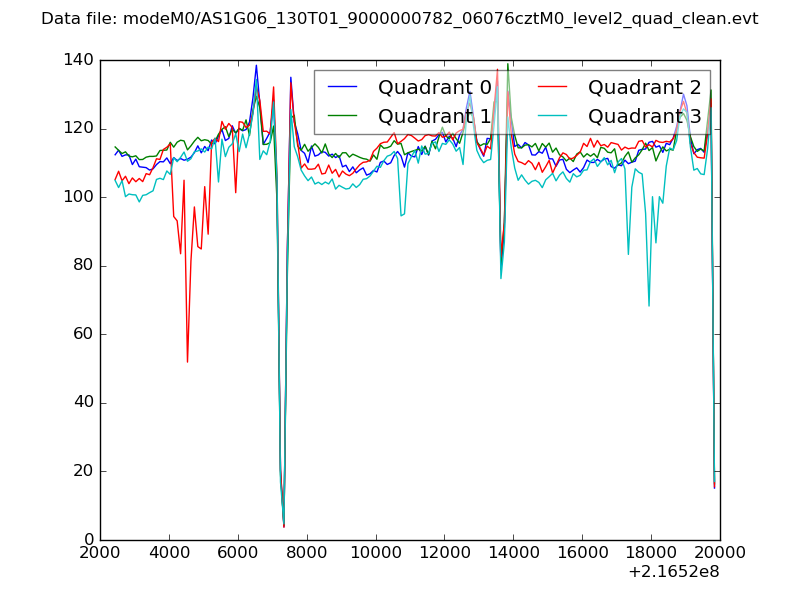 |
|
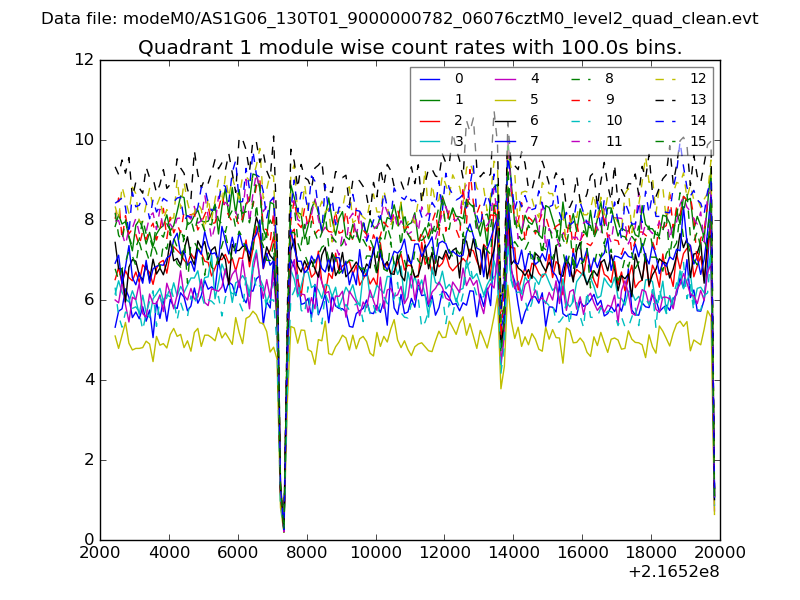
| Module-wise count rates for Quadrant A Data is divided into 100 sec bins |
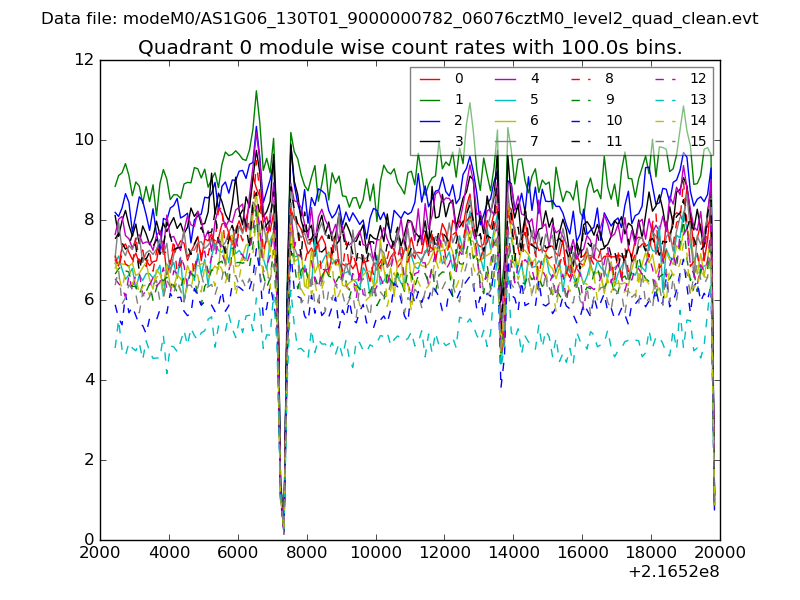 |
 |
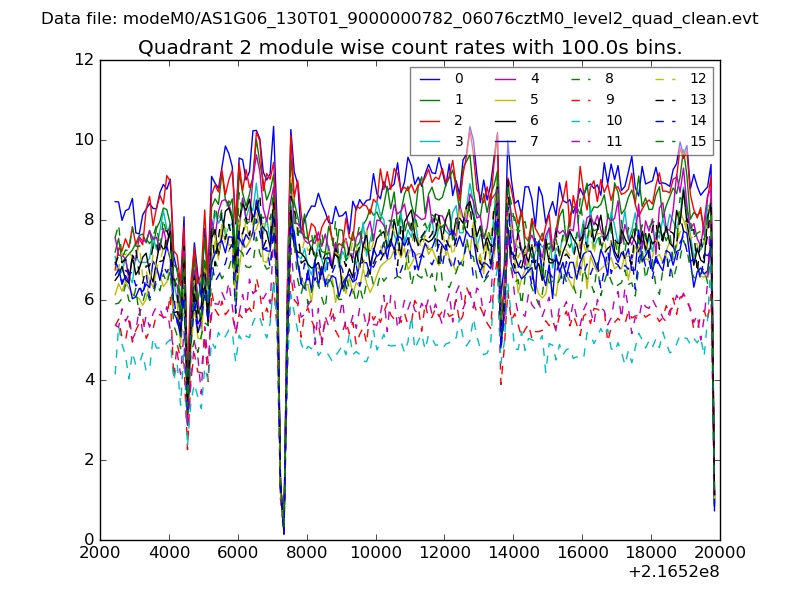
| Module-wise count rates for Quadrant B Data is divided into 100 sec bins |
 |
 |
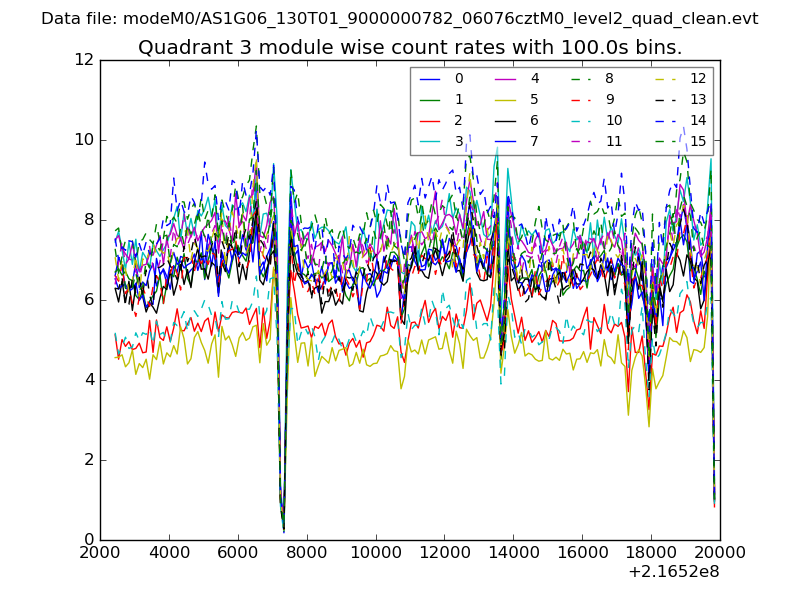
| Module-wise count rates for Quadrant C Data is divided into 100 sec bins |
 |
 |
| Module-wise count rates for Quadrant D Data is divided into 100 sec bins |
 |
 |
| Parameter | Plot |
|---|---|
| CZT HV Monitor | 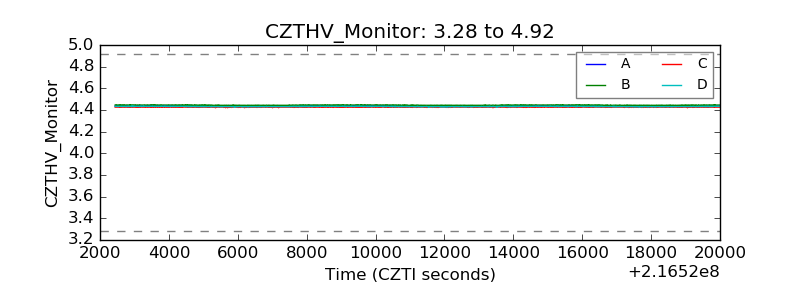 |
| D_VDD | 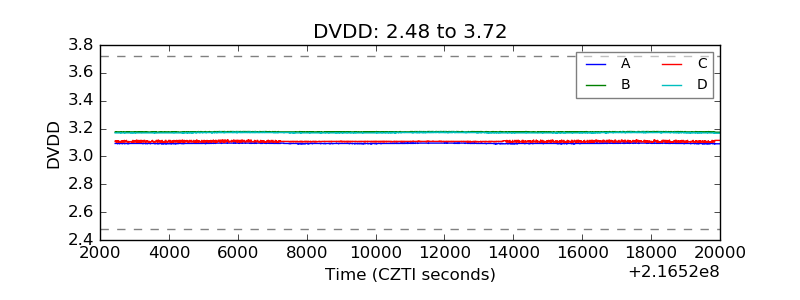 |
| Temperature 1 | 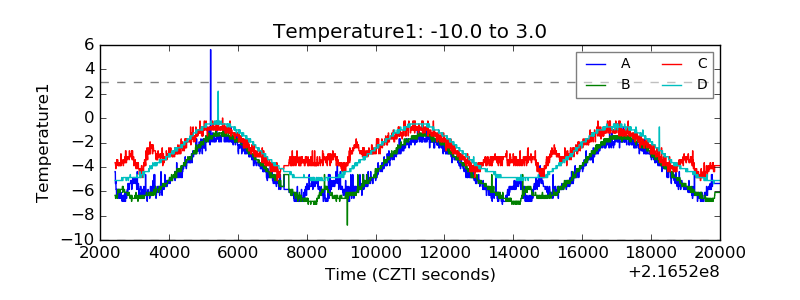 |
| Veto HV Monitor | 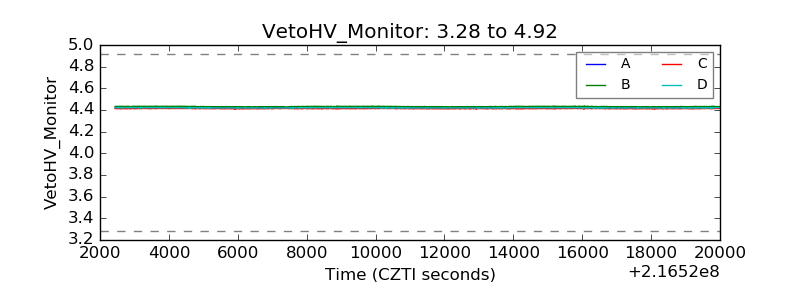 |
| Veto LLD | 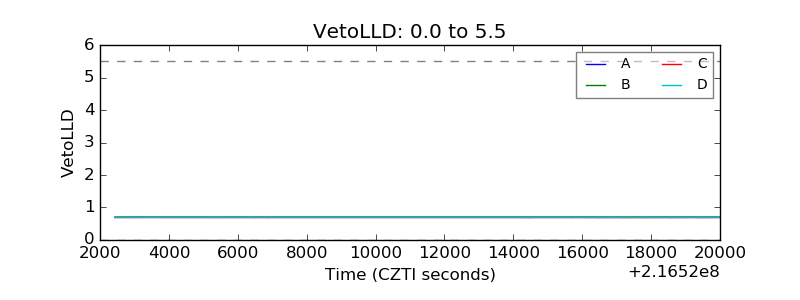 |
| Alpha Counter | 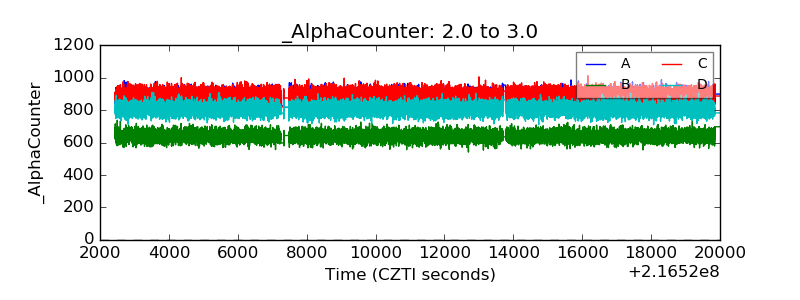 |
| _CPM_Rate | 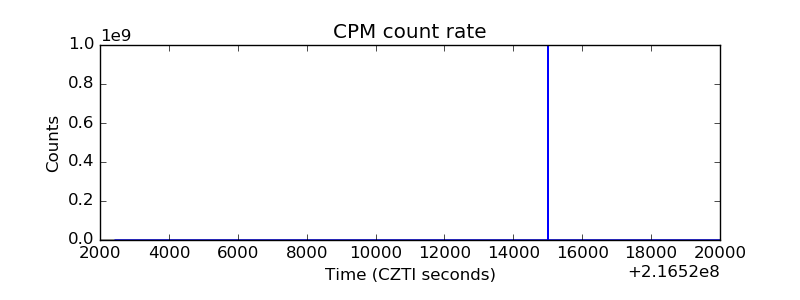 |
| CZT Counter | 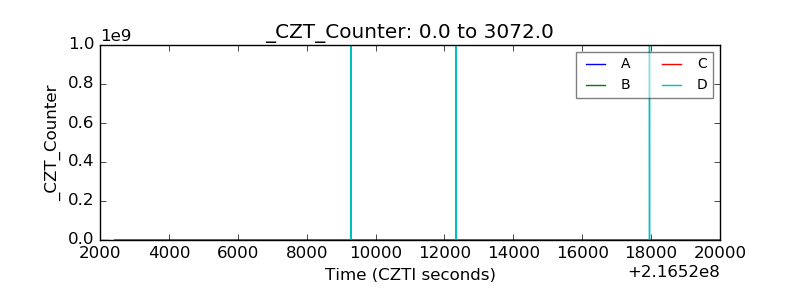 |
| +2.5 Volts monitor |  |
| +5 Volts monitor |  |
| _ROLL_ROT | 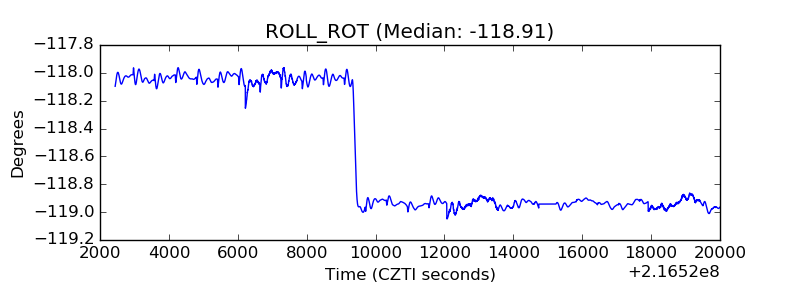 |
| _Roll_DEC | 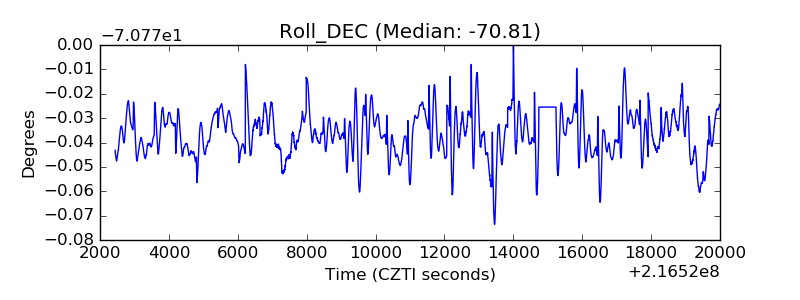 |
| _Roll_RA | 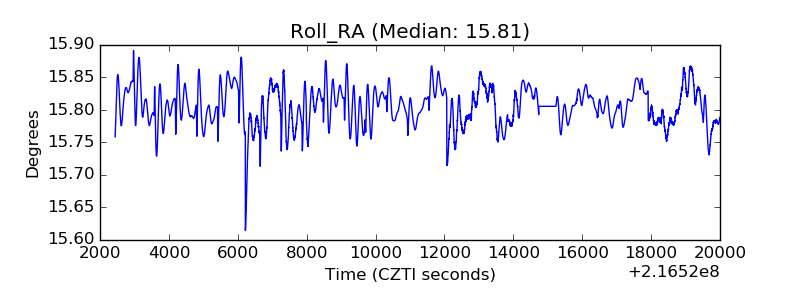 |
| Veto Counter | 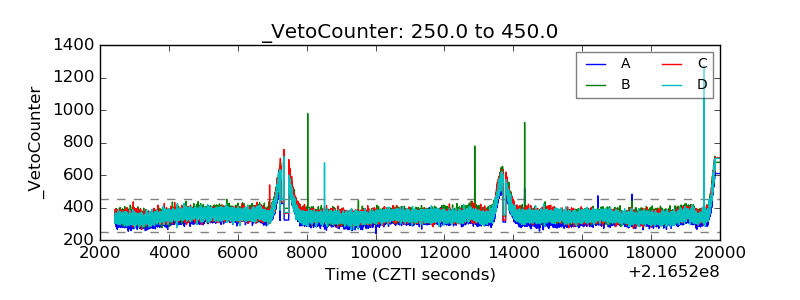 |