| Param | Original file | Final file |
|---|---|---|
| Filename | modeM0/AS1A02_028T03_9000000788_06076cztM0_level2.evt | modeM0/AS1A02_028T03_9000000788_06076cztM0_level2_quad_clean.evt |
| Size (bytes) | 121,538,880 | 32,382,720 |
| Size | 115.9 MB | 30.9 MB |
| Events in quadrant A | 838,440 | 221,426 |
| Events in quadrant B | 1,016,429 | 220,043 |
| Events in quadrant C | 788,494 | 216,656 |
| Events in quadrant D | 929,485 | 207,608 |
| Mode M0 | |||
|---|---|---|---|
| Quadrant | BADHDUFLAG | Total packets | Discarded packets |
| A | 0 | 3422 | 2 |
| B | 0 | 4022 | 1 |
| C | 0 | 3276 | 1 |
| D | 0 | 3731 | 1 |
| Mode M9 | |||
|---|---|---|---|
| Quadrant | BADHDUFLAG | Total packets | Discarded packets |
| A | 0 | 9 | 0 |
| B | 0 | 9 | 0 |
| C | 0 | 9 | 0 |
| D | 0 | 9 | 0 |
| Mode SS | |||
|---|---|---|---|
| Quadrant | BADHDUFLAG | Total packets | Discarded packets |
| A | 0 | 32 | 0 |
| B | 0 | 32 | 0 |
| C | 0 | 32 | 0 |
| D | 0 | 32 | 0 |
| Quadrant | Total seconds | Saturated seconds | Saturation percentage |
|---|---|---|---|
| A | 1545 | 12 | 0.776699% |
| B | 1545 | 62 | 4.012945% |
| C | 1545 | 2 | 0.129450% |
| D | 1545 | 24 | 1.553398% |
Noise dominated data is calculated using 1-second bins in cleaned event files. If a bin has >2000 counts, and if more than 50% of those come from <1% of pixels, then it is considered to be noise-dominated and hence unusable.
| Quadrant | # 1 sec bins | Bins with >0 counts | Bins with >2000 counts | High rate bins dominated by noise | Noise dominated (total time) | Noise dominated (detector-on time) | Marked lightcurve |
|---|---|---|---|---|---|---|---|
| A | 1545 | 1545 | 0 | 0 | 0.00% | 0.00% | 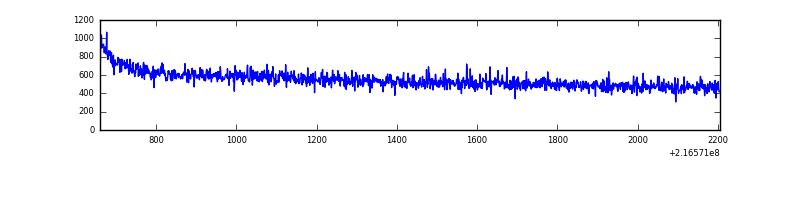 |
| B | 1545 | 1545 | 37 | 37 | 2.39% | 2.39% | 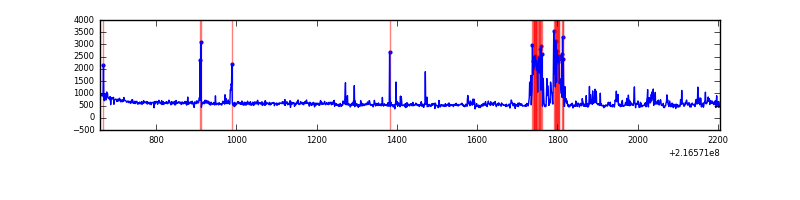 |
| C | 1545 | 1545 | 0 | 0 | 0.00% | 0.00% | 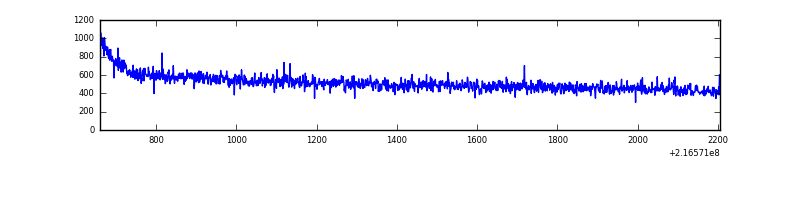 |
| D | 1545 | 1545 | 8 | 8 | 0.52% | 0.52% | 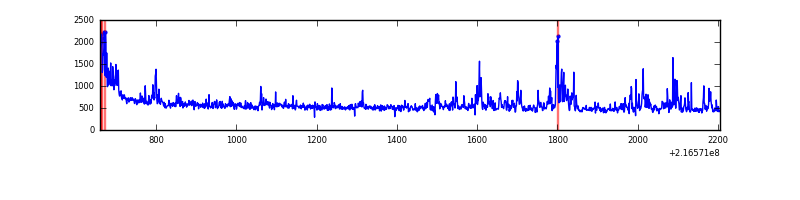 |
Top three noisy pixels from each quadrant. If the there are fewer than three noisy pixels in the level2.evt file, extra rows are filled as -1
| Pixel properties | Quadrant properties | ||||||
|---|---|---|---|---|---|---|---|
| Quadrant | DetID | PixID | Counts | Sigma | Mean | Median | Sigma |
| A | 8 | 15 | 11314 | 249.9 | 212 | 207 | 44.4 |
| A | 14 | 111 | 10649 | 234.94 | 212 | 207 | 44.4 |
| A | 12 | 194 | 2183 | 44.46 | 212 | 207 | 44.4 |
| B | 3 | 64 | 124030 | 3031.79 | 205 | 200 | 40.8 |
| B | 10 | 245 | 32945 | 801.71 | 205 | 200 | 40.8 |
| B | 4 | 81 | 26096 | 634.02 | 205 | 200 | 40.8 |
| C | 1 | 16 | 2554 | 49.28 | 201 | 201 | 47.7 |
| C | 13 | 61 | 1639 | 30.12 | 201 | 201 | 47.7 |
| C | 8 | 222 | 1106 | 18.95 | 201 | 201 | 47.7 |
| D | 11 | 241 | 102158 | 1982.04 | 204 | 198 | 51.4 |
| D | 12 | 221 | 30664 | 592.24 | 204 | 198 | 51.4 |
| D | 13 | 137 | 6465 | 121.83 | 204 | 198 | 51.4 |
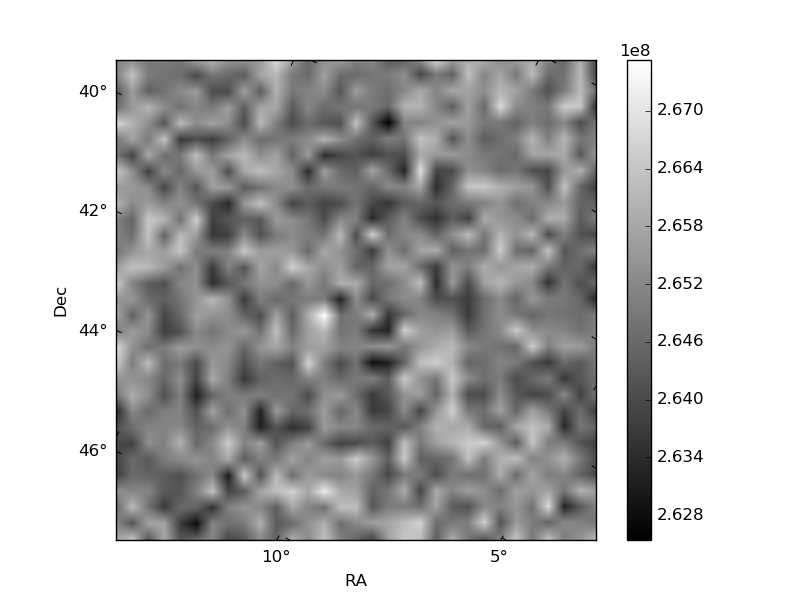
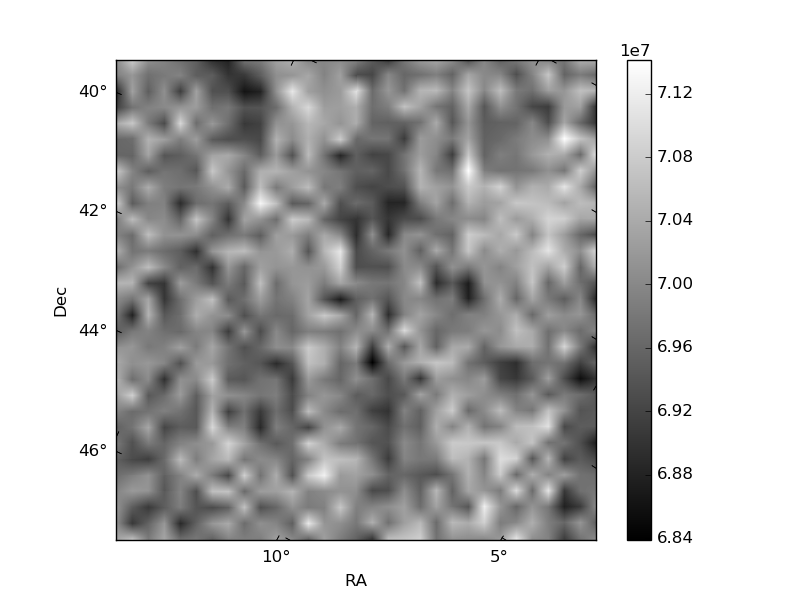
Histogram calculated using DETX and DETY for each event in the final _common_clean file
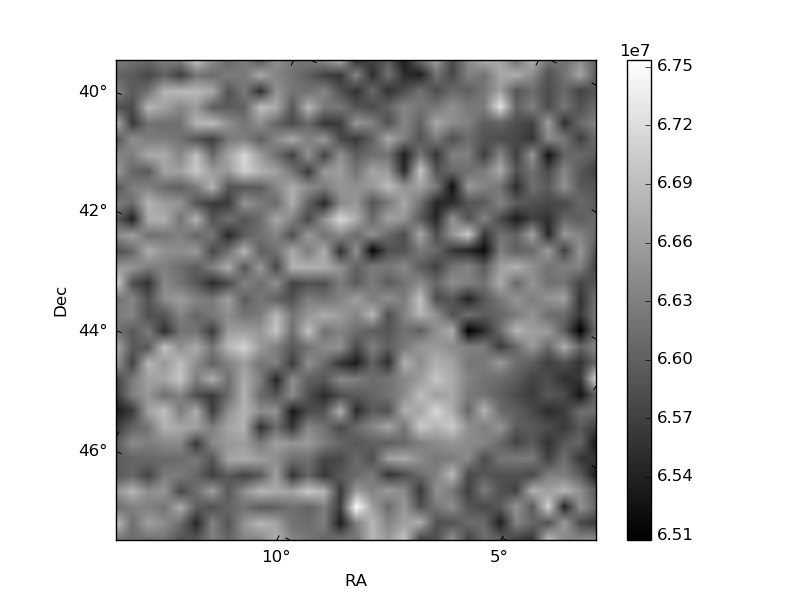
| Quadrant A | 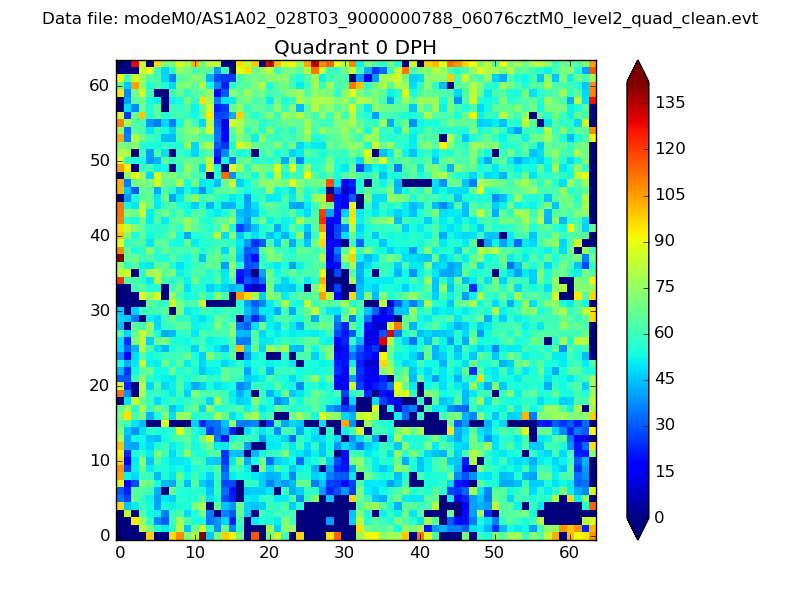 |
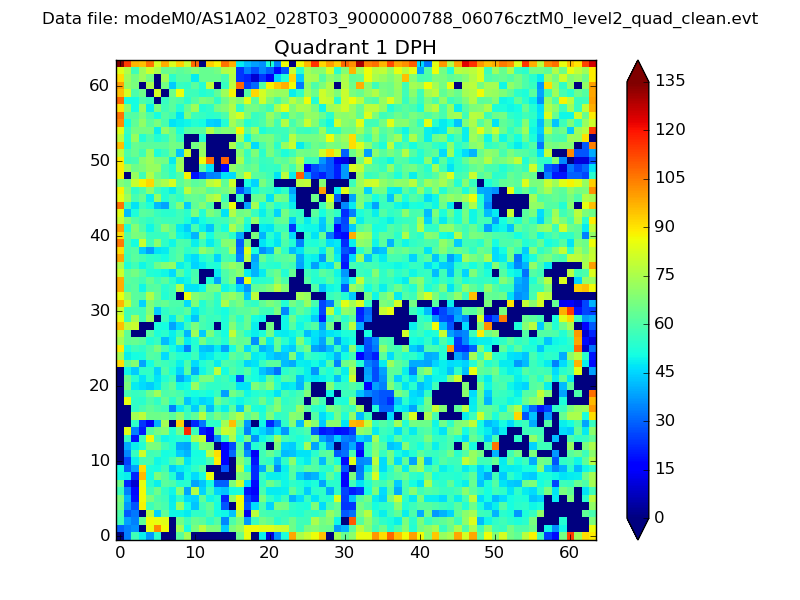 |
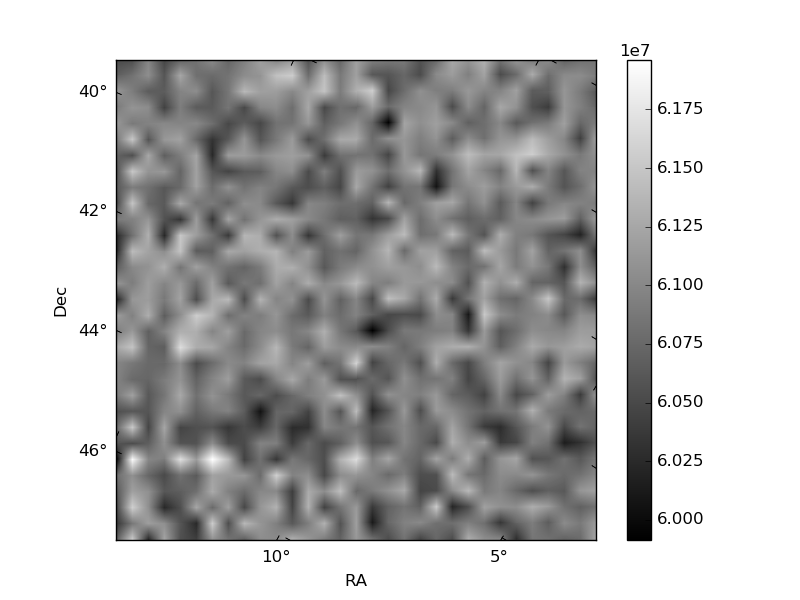
Quadrant B |
|---|---|---|---|
| Quadrant D | 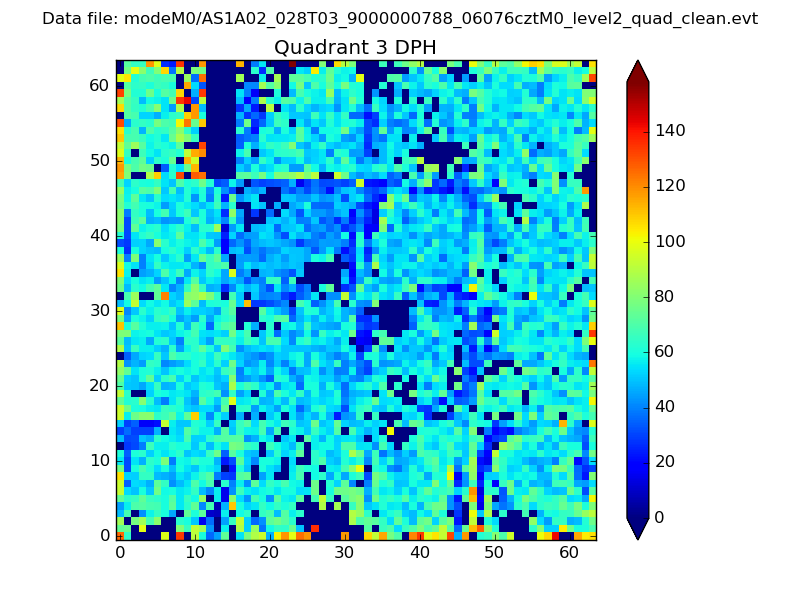 |
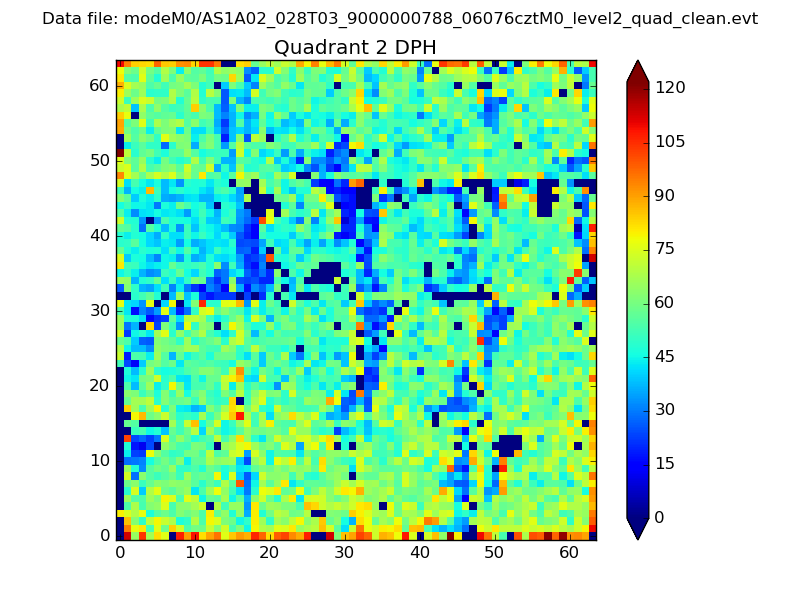 |
Quadrant C |
| Plot type | Count rate plots | Images |
|---|---|---|
| Comparison with Poisson distribution Blue bars denote a histogram of data divided into 1 sec bins. Red curve is a Poisson curve with rate = median count rate of data. |
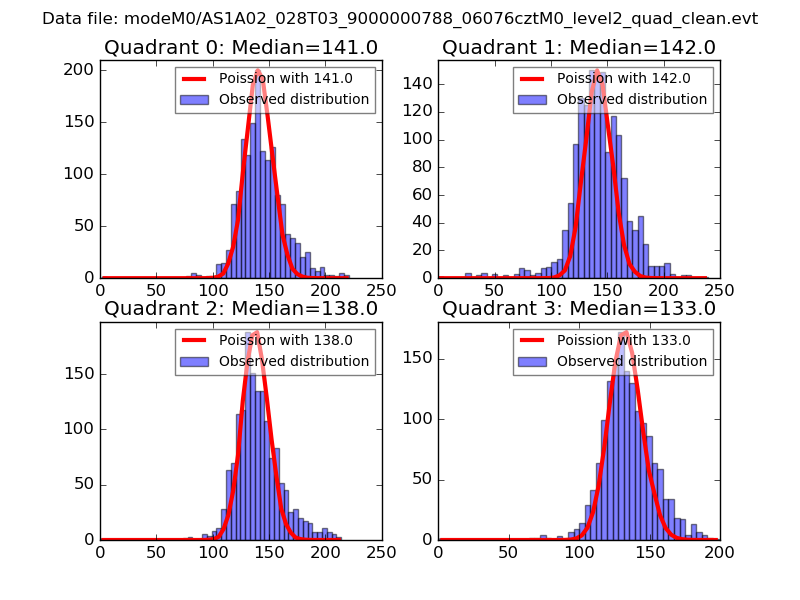 |
 |
| Quadrant-wise count rates Data is divided into 100 sec bins |
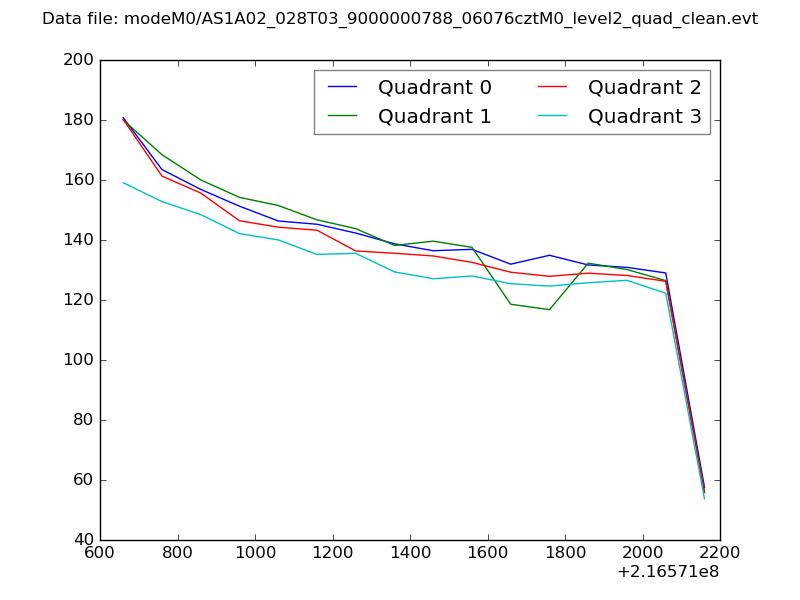 |
|
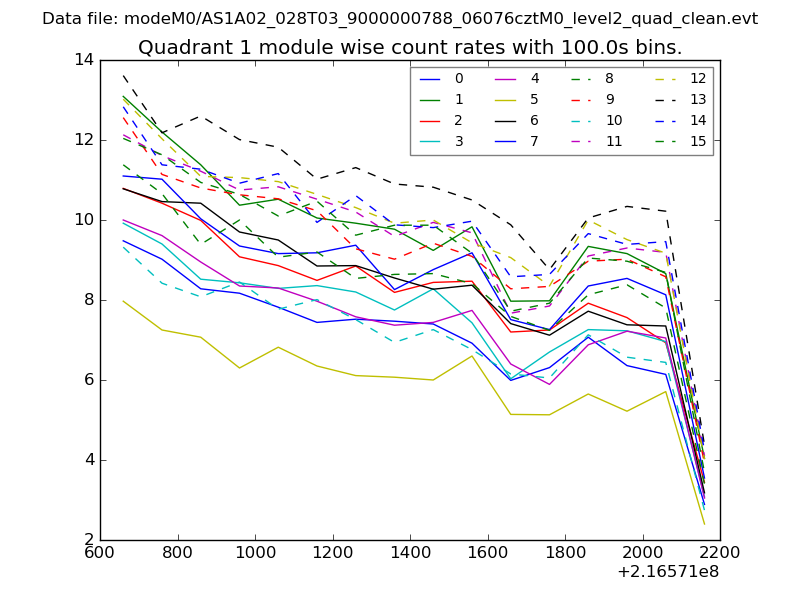
| Module-wise count rates for Quadrant A Data is divided into 100 sec bins |
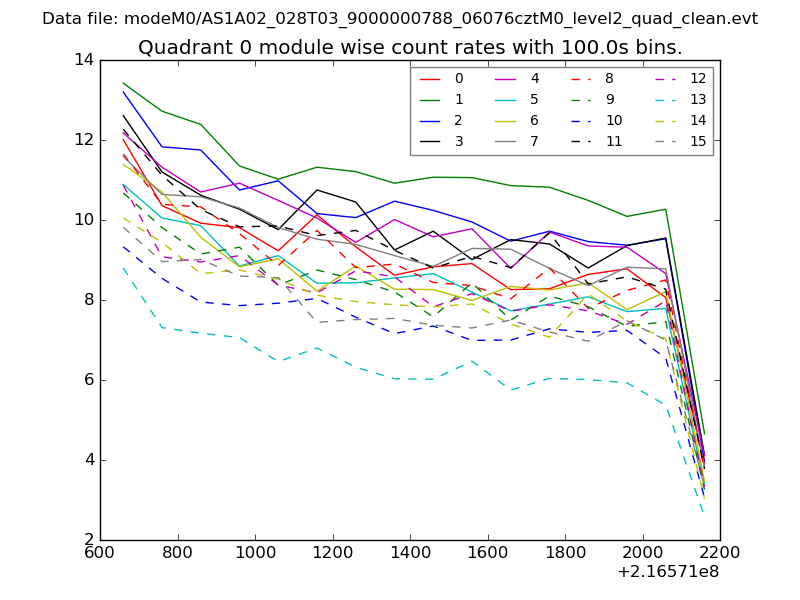 |
 |
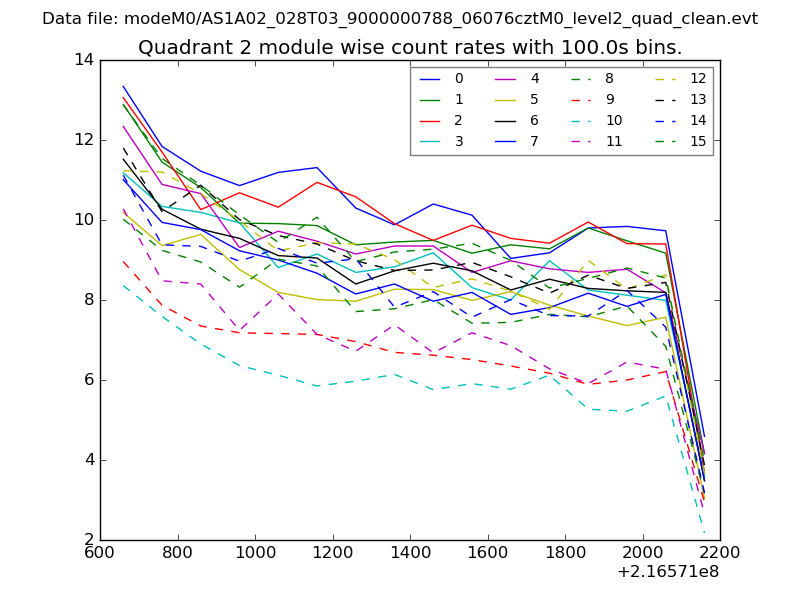
| Module-wise count rates for Quadrant B Data is divided into 100 sec bins |
 |
 |
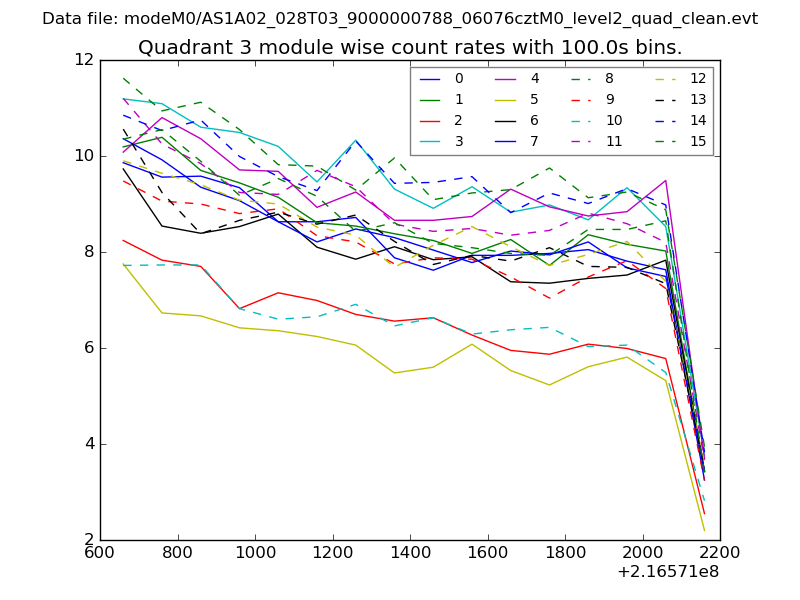
| Module-wise count rates for Quadrant C Data is divided into 100 sec bins |
 |
 |
| Module-wise count rates for Quadrant D Data is divided into 100 sec bins |
 |
 |
| Parameter | Plot |
|---|---|
| CZT HV Monitor | 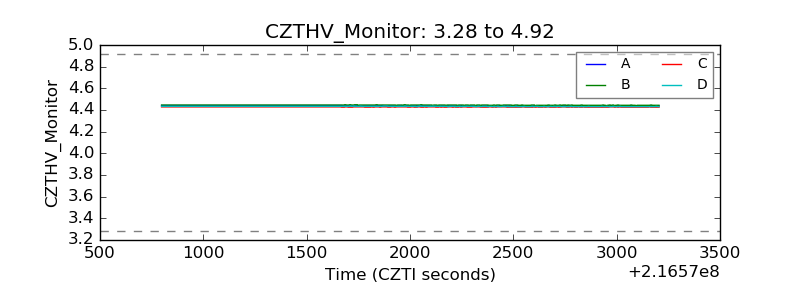 |
| D_VDD | 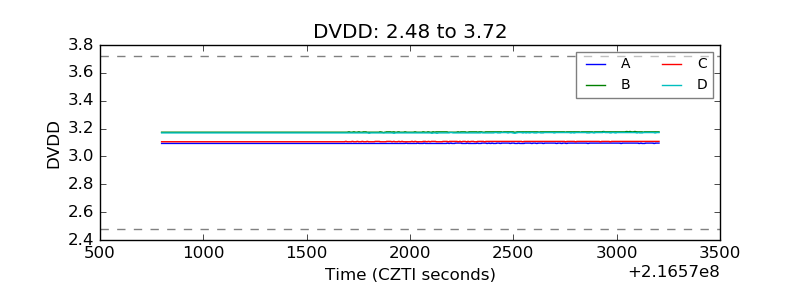 |
| Temperature 1 | 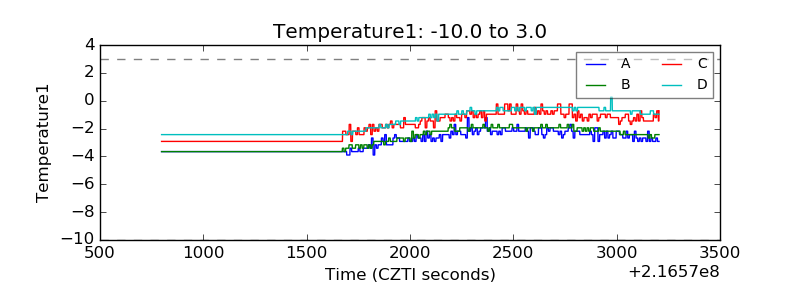 |
| Veto HV Monitor | 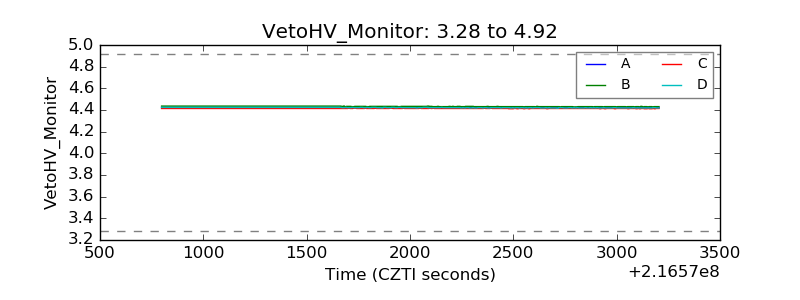 |
| Veto LLD | 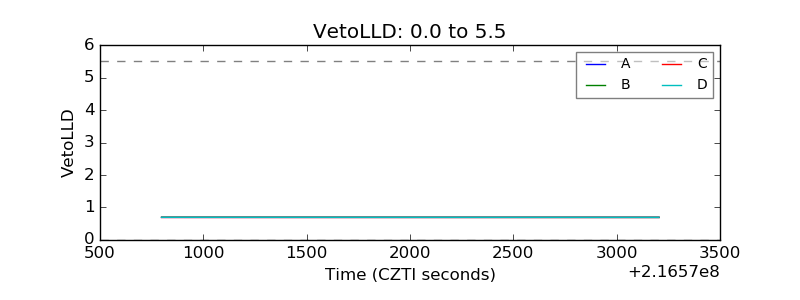 |
| Alpha Counter | 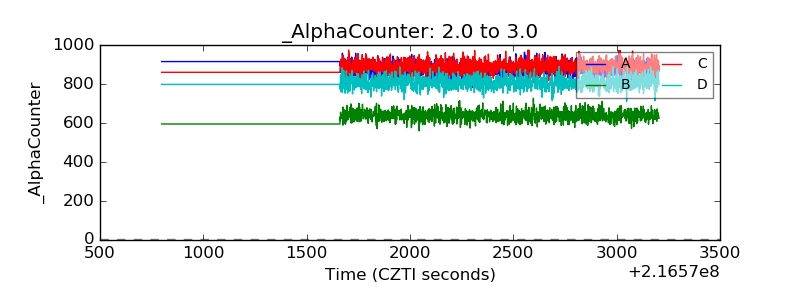 |
| _CPM_Rate | 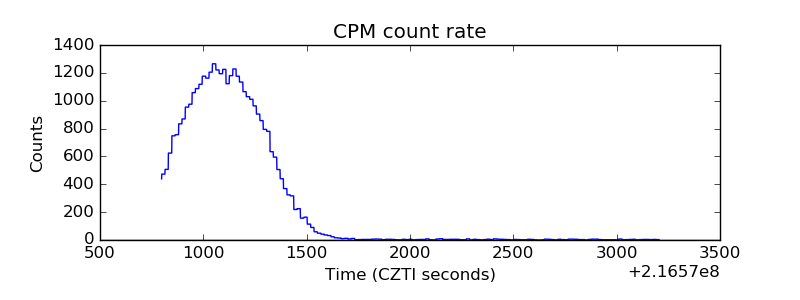 |
| CZT Counter | 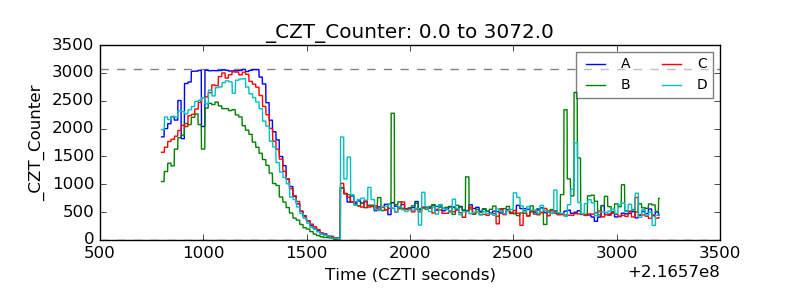 |
| +2.5 Volts monitor |  |
| +5 Volts monitor |  |
| _ROLL_ROT | 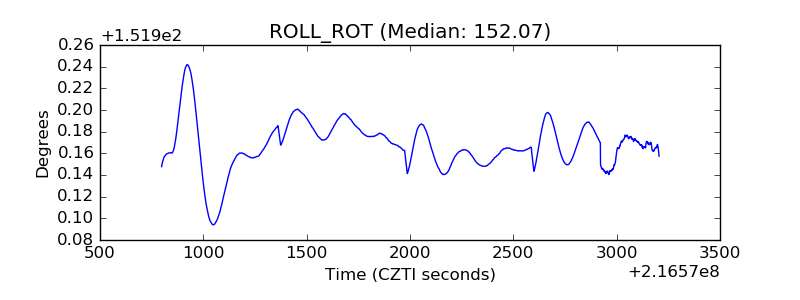 |
| _Roll_DEC | 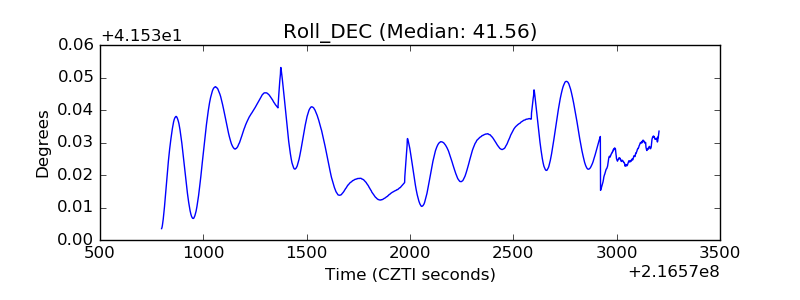 |
| _Roll_RA | 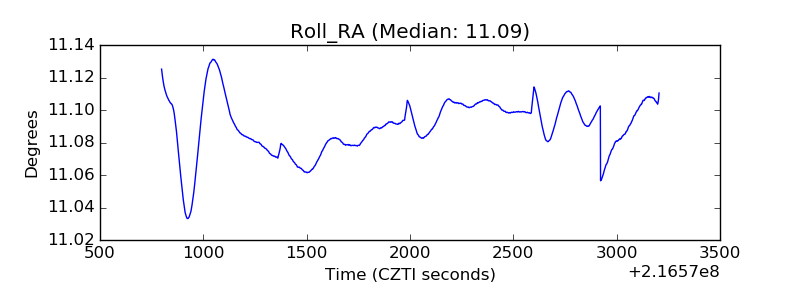 |
| Veto Counter | 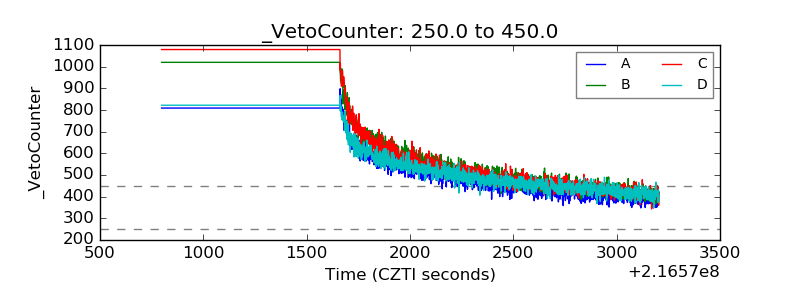 |