| Param | Original file | Final file |
|---|---|---|
| Filename | modeM0/AS1A02_028T03_9000000788_06080cztM0_level2.evt | modeM0/AS1A02_028T03_9000000788_06080cztM0_level2_quad_clean.evt |
| Size (bytes) | 412,234,560 | 86,512,320 |
| Size | 393.1 MB | 82.5 MB |
| Events in quadrant A | 2,933,710 | 549,346 |
| Events in quadrant B | 3,455,689 | 551,971 |
| Events in quadrant C | 2,870,009 | 551,668 |
| Events in quadrant D | 2,796,289 | 526,915 |
| Mode M0 | |||
|---|---|---|---|
| Quadrant | BADHDUFLAG | Total packets | Discarded packets |
| A | 0 | 13074 | 3 |
| B | 0 | 14556 | 2 |
| C | 0 | 12952 | 2 |
| D | 0 | 12971 | 2 |
| Mode M9 | |||
|---|---|---|---|
| Quadrant | BADHDUFLAG | Total packets | Discarded packets |
| A | 0 | 20 | 0 |
| B | 0 | 20 | 0 |
| C | 0 | 20 | 0 |
| D | 0 | 21 | 0 |
| Mode SS | |||
|---|---|---|---|
| Quadrant | BADHDUFLAG | Total packets | Discarded packets |
| A | 0 | 128 | 0 |
| B | 0 | 128 | 0 |
| C | 0 | 128 | 0 |
| D | 0 | 128 | 0 |
| Quadrant | Total seconds | Saturated seconds | Saturation percentage |
|---|---|---|---|
| A | 6304 | 19 | 0.301396% |
| B | 6304 | 83 | 1.316624% |
| C | 6304 | 15 | 0.237944% |
| D | 6304 | 10 | 0.158629% |
Noise dominated data is calculated using 1-second bins in cleaned event files. If a bin has >2000 counts, and if more than 50% of those come from <1% of pixels, then it is considered to be noise-dominated and hence unusable.
| Quadrant | # 1 sec bins | Bins with >0 counts | Bins with >2000 counts | High rate bins dominated by noise | Noise dominated (total time) | Noise dominated (detector-on time) | Marked lightcurve |
|---|---|---|---|---|---|---|---|
| A | 7545 | 6306 | 0 | 0 | 0.00% | 0.00% | 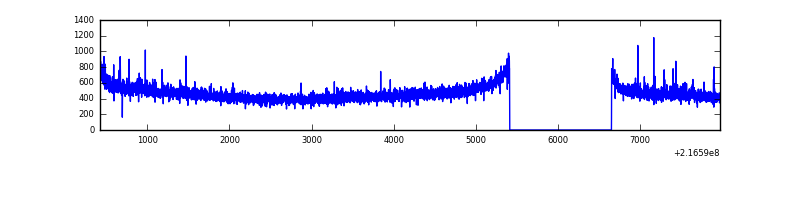 |
| B | 7545 | 6306 | 48 | 48 | 0.64% | 0.76% | 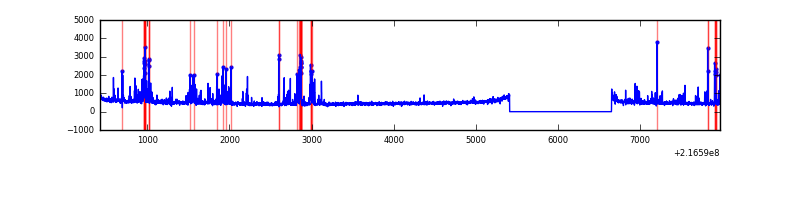 |
| C | 7545 | 6306 | 0 | 0 | 0.00% | 0.00% | 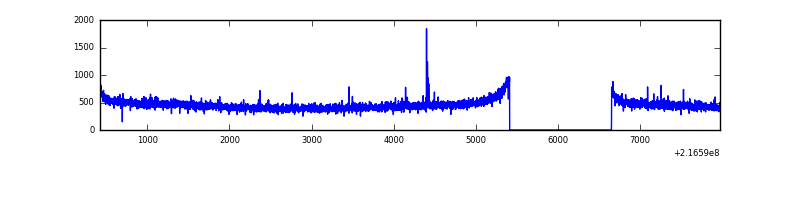 |
| D | 7545 | 6306 | 2 | 2 | 0.03% | 0.03% | 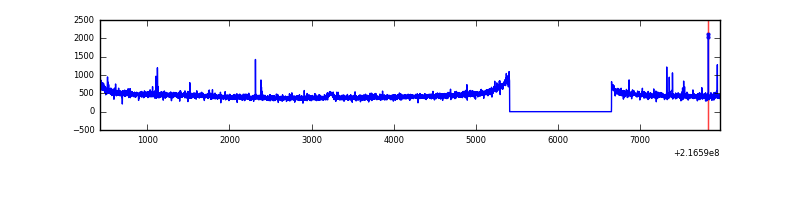 |
Top three noisy pixels from each quadrant. If the there are fewer than three noisy pixels in the level2.evt file, extra rows are filled as -1
| Pixel properties | Quadrant properties | ||||||
|---|---|---|---|---|---|---|---|
| Quadrant | DetID | PixID | Counts | Sigma | Mean | Median | Sigma |
| A | 8 | 15 | 33840 | 221.04 | 739 | 721 | 149.8 |
| A | 14 | 111 | 27810 | 180.8 | 739 | 721 | 149.8 |
| A | 3 | 1 | 21595 | 139.32 | 739 | 721 | 149.8 |
| B | 3 | 64 | 257522 | 1823.68 | 747 | 729 | 140.8 |
| B | 10 | 246 | 146488 | 1035.15 | 747 | 729 | 140.8 |
| B | 0 | 214 | 54189 | 379.66 | 747 | 729 | 140.8 |
| C | 9 | 54 | 11866 | 65.74 | 731 | 734 | 169.3 |
| C | 13 | 61 | 5770 | 29.74 | 731 | 734 | 169.3 |
| C | 1 | 16 | 3660 | 17.28 | 731 | 734 | 169.3 |
| D | 8 | 195 | 19334 | 105.81 | 724 | 701 | 176.1 |
| D | 2 | 33 | 12215 | 65.38 | 724 | 701 | 176.1 |
| D | 12 | 221 | 9408 | 49.44 | 724 | 701 | 176.1 |
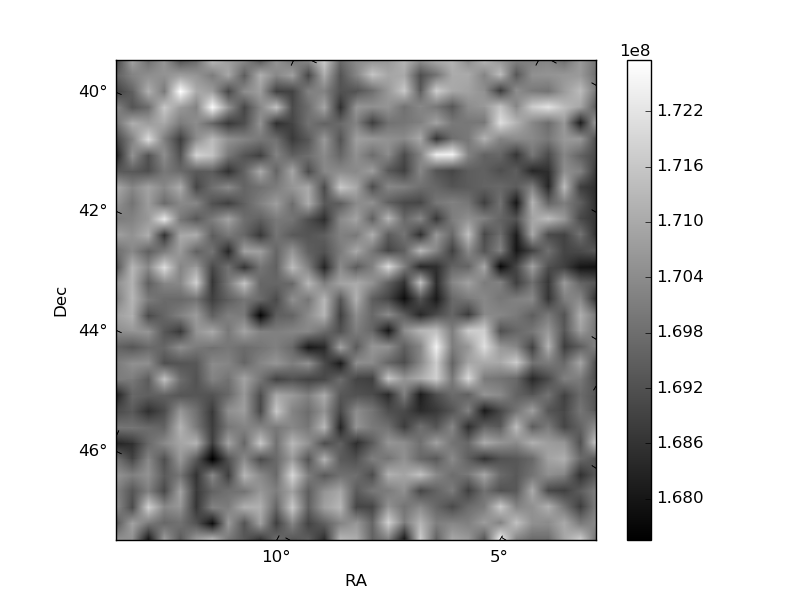
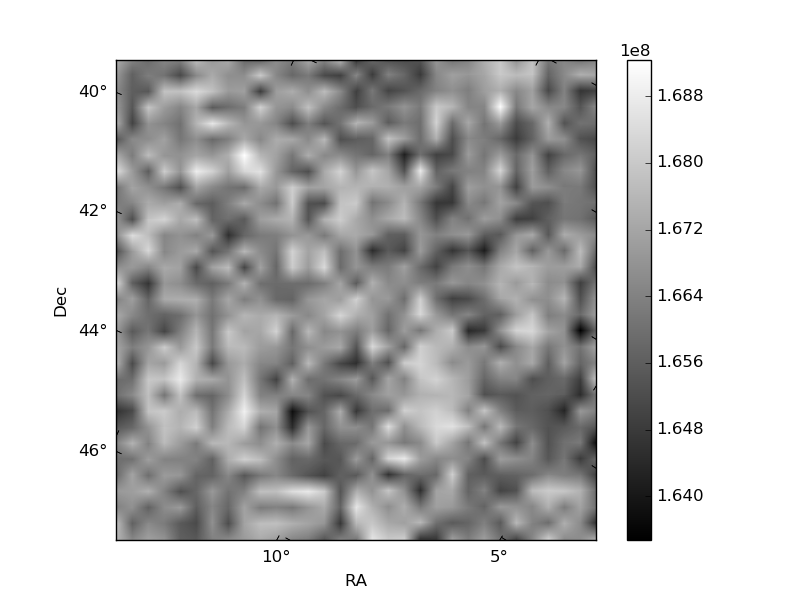
Histogram calculated using DETX and DETY for each event in the final _common_clean file
| Quadrant A | 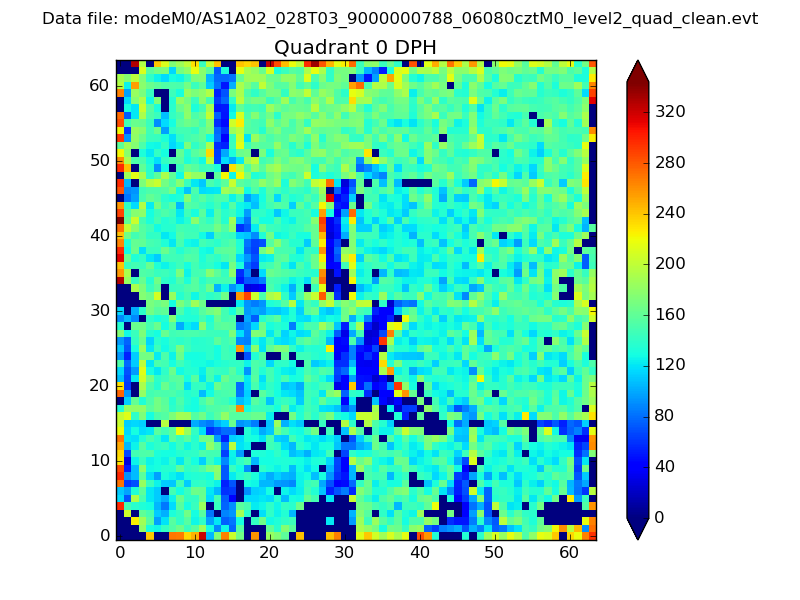 |
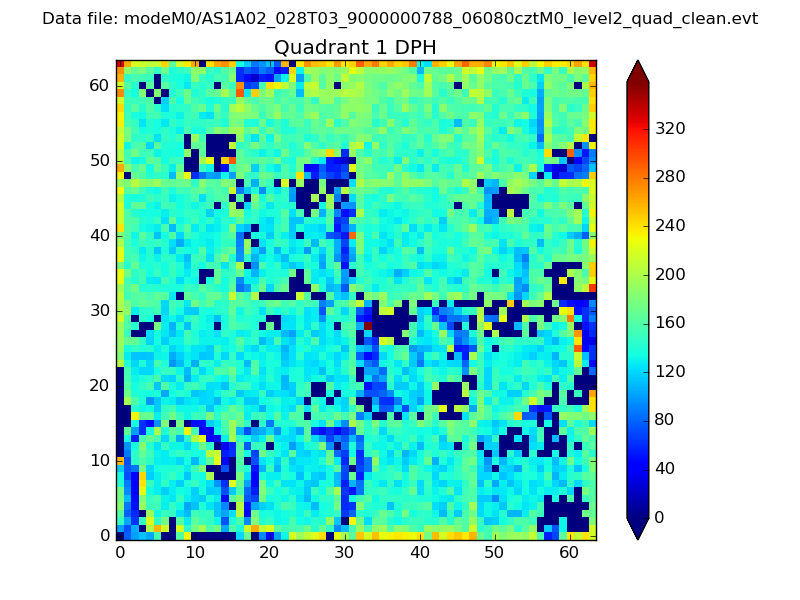 |
Quadrant B |
|---|---|---|---|
| Quadrant D | 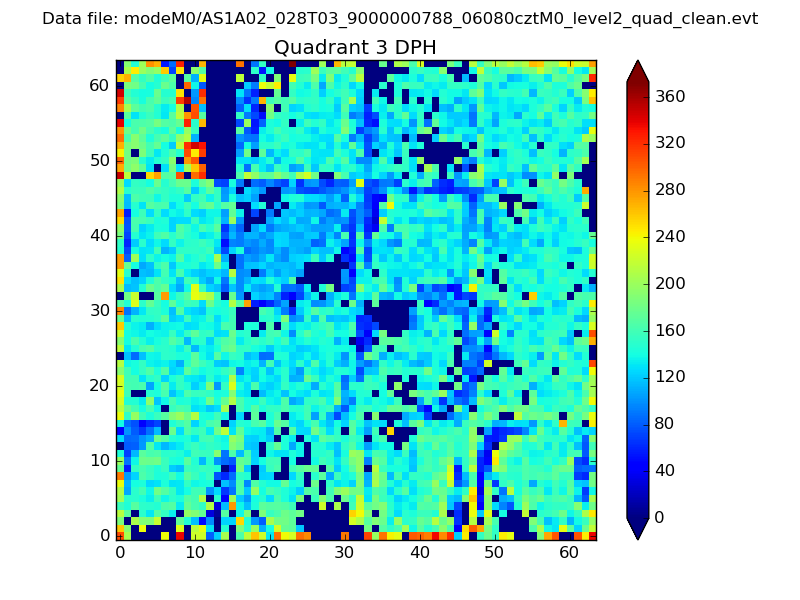 |
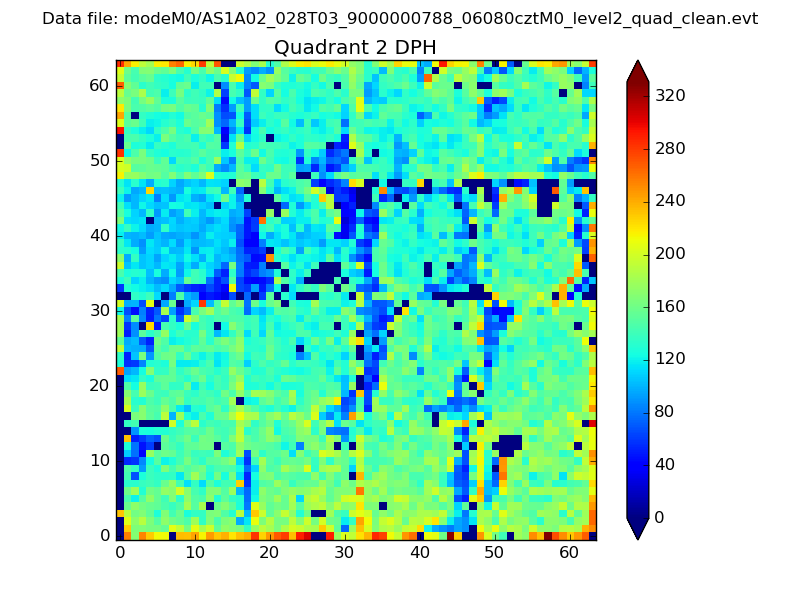 |
Quadrant C |
| Plot type | Count rate plots | Images |
|---|---|---|
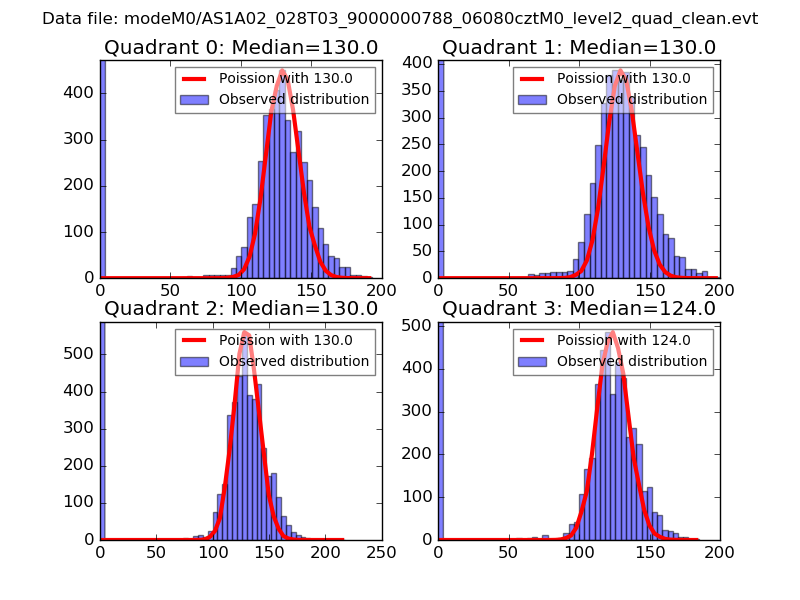
| Comparison with Poisson distribution Blue bars denote a histogram of data divided into 1 sec bins. Red curve is a Poisson curve with rate = median count rate of data. |
 |
 |
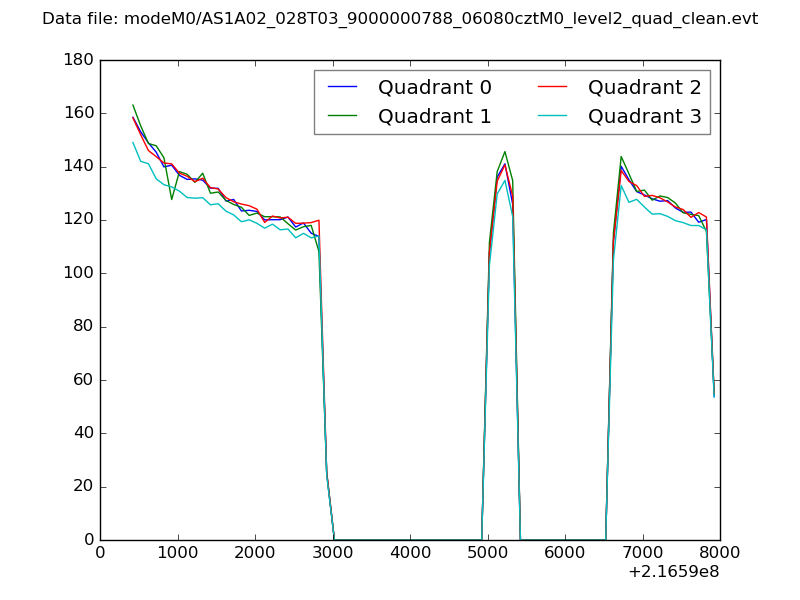
| Quadrant-wise count rates Data is divided into 100 sec bins |
 |
|
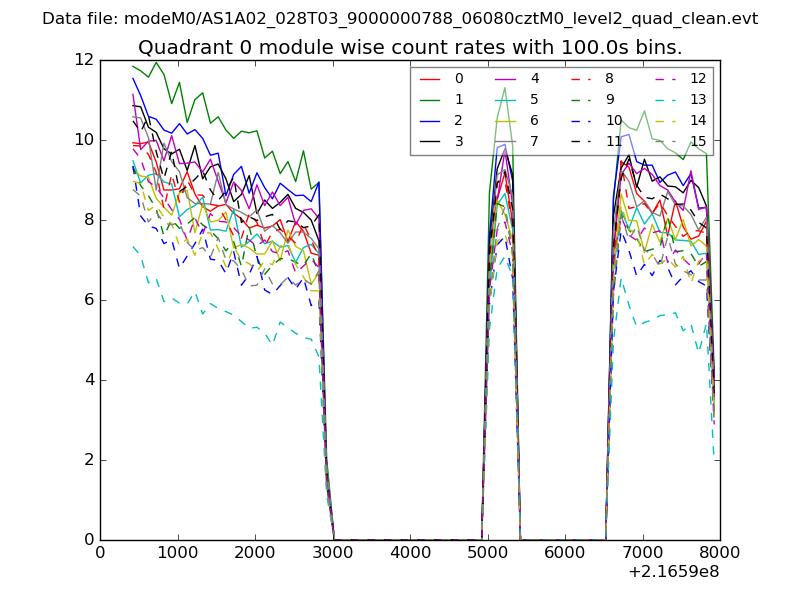
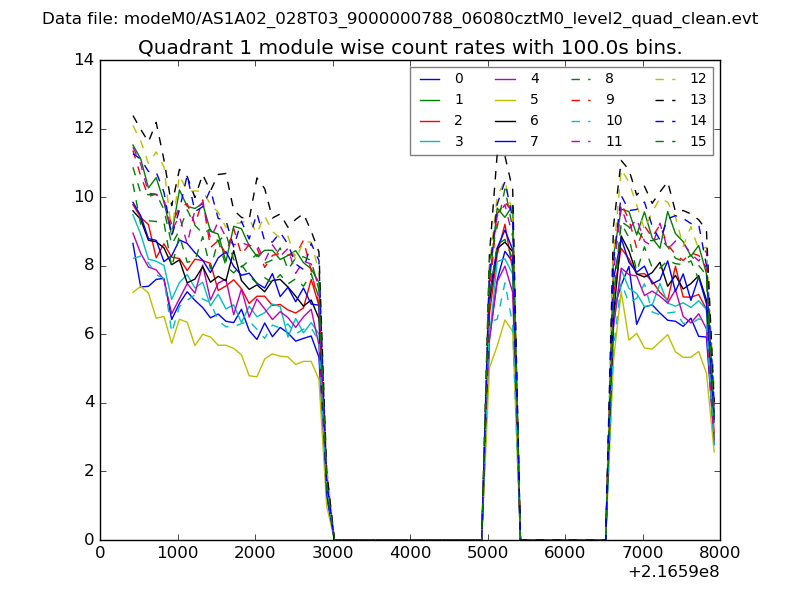
| Module-wise count rates for Quadrant A Data is divided into 100 sec bins |
 |
 |
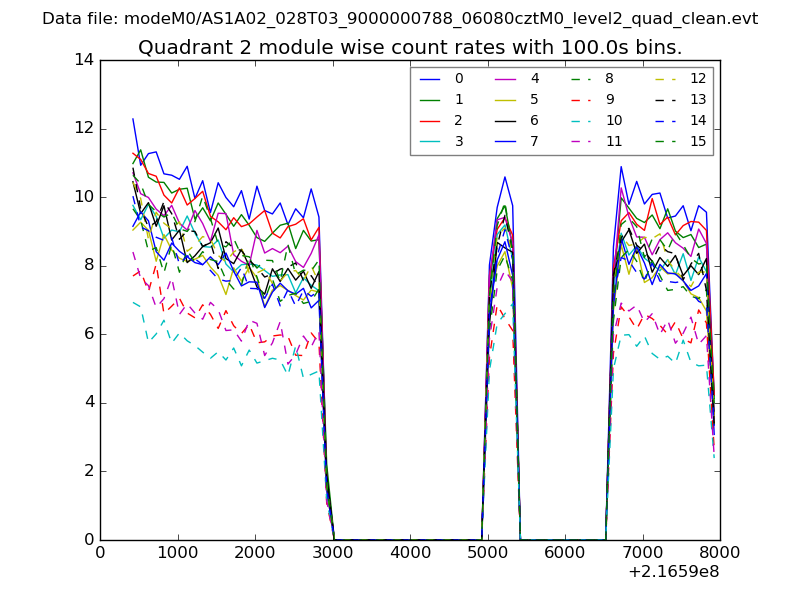
| Module-wise count rates for Quadrant B Data is divided into 100 sec bins |
 |
 |
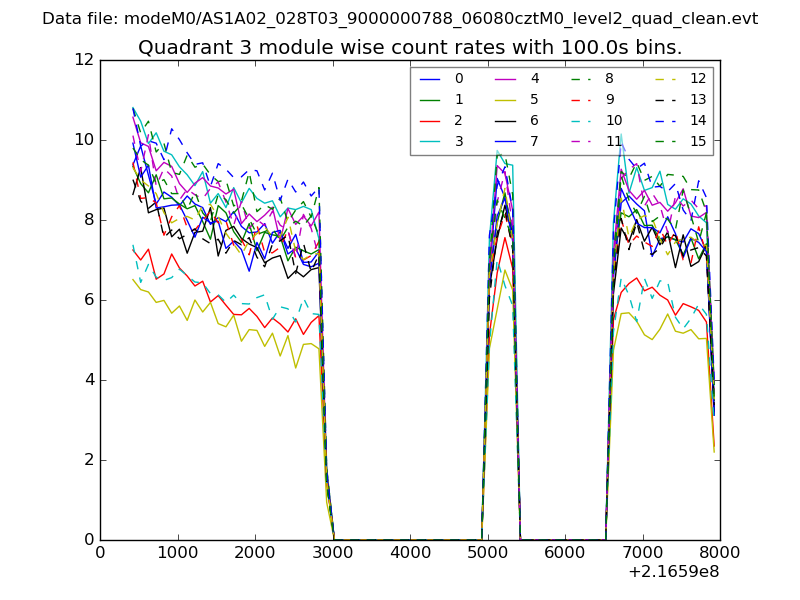
| Module-wise count rates for Quadrant C Data is divided into 100 sec bins |
 |
 |
| Module-wise count rates for Quadrant D Data is divided into 100 sec bins |
 |
 |
| Parameter | Plot |
|---|---|
| CZT HV Monitor | 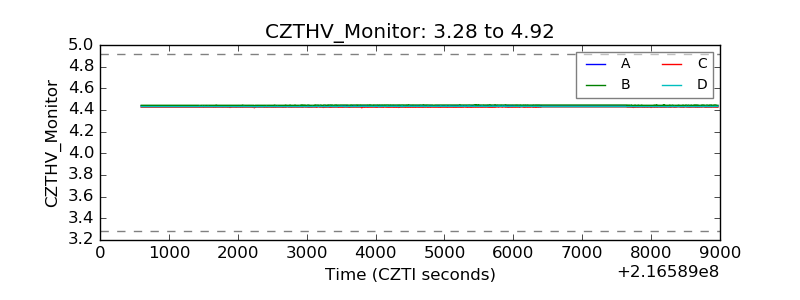 |
| D_VDD | 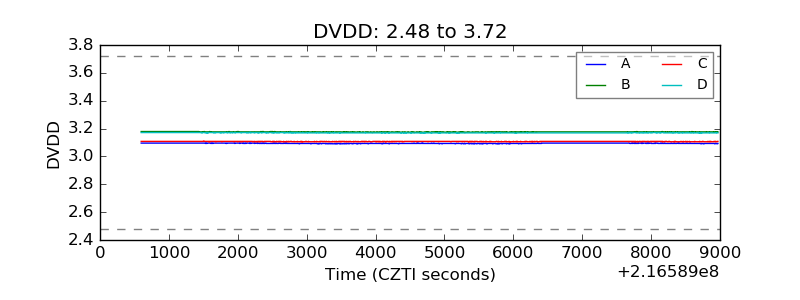 |
| Temperature 1 | 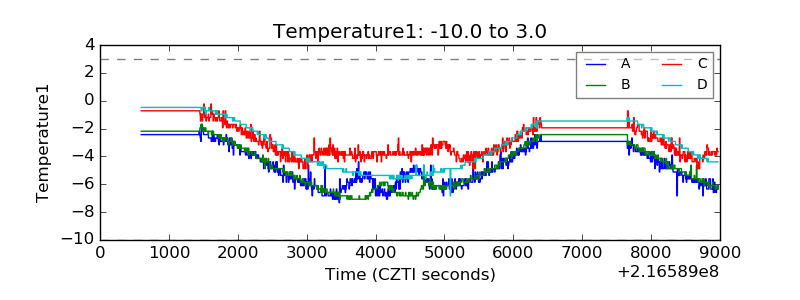 |
| Veto HV Monitor | 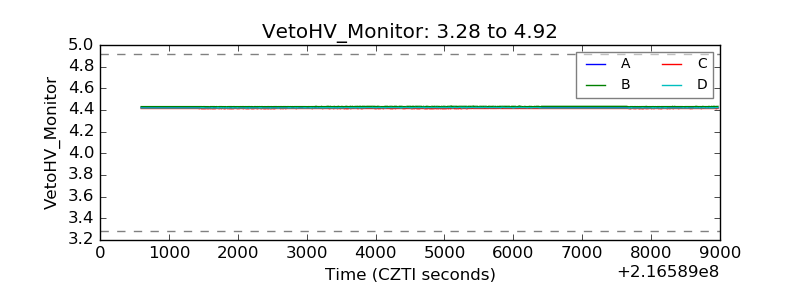 |
| Veto LLD | 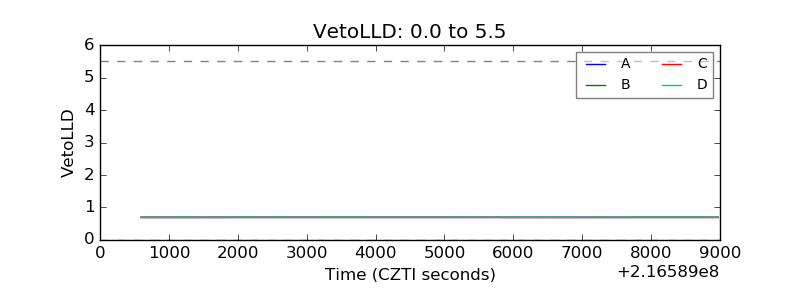 |
| Alpha Counter | 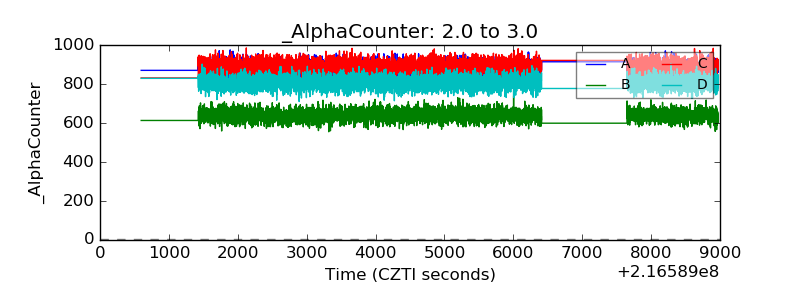 |
| _CPM_Rate | 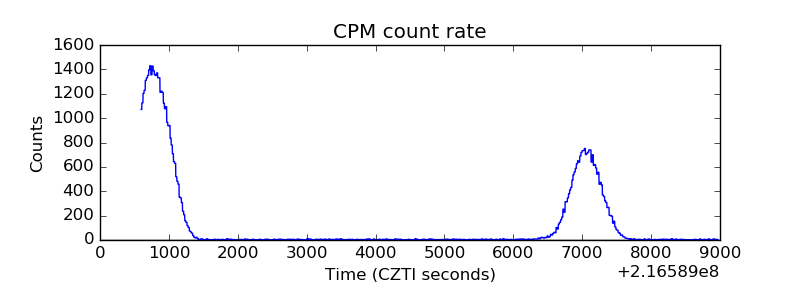 |
| CZT Counter | 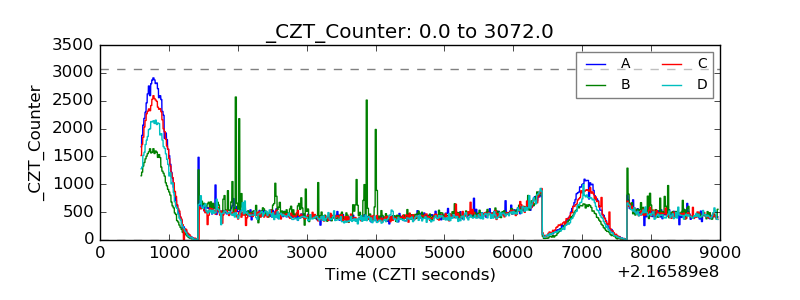 |
| +2.5 Volts monitor |  |
| +5 Volts monitor |  |
| _ROLL_ROT | 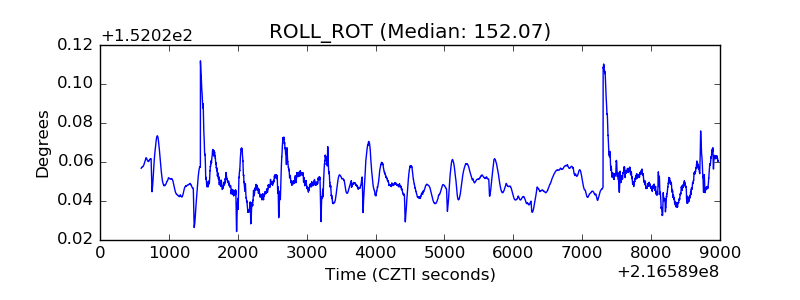 |
| _Roll_DEC | 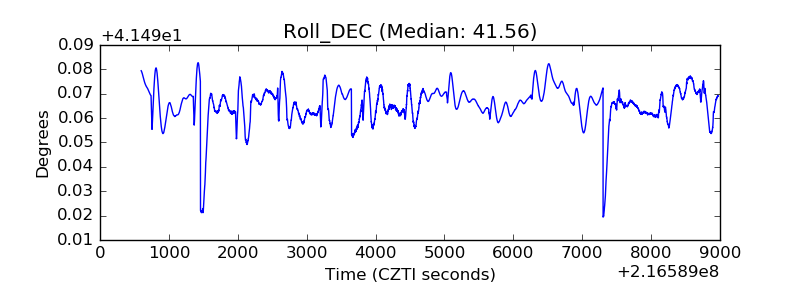 |
| _Roll_RA | 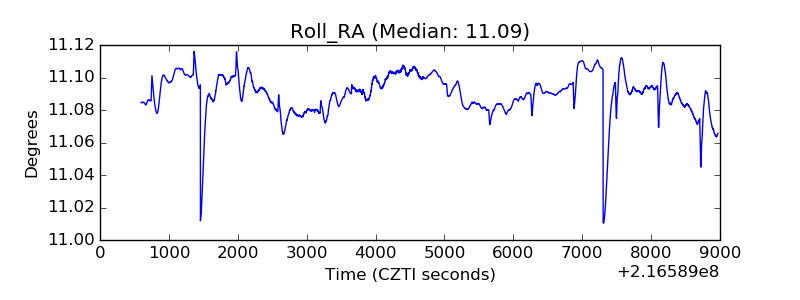 |
| Veto Counter | 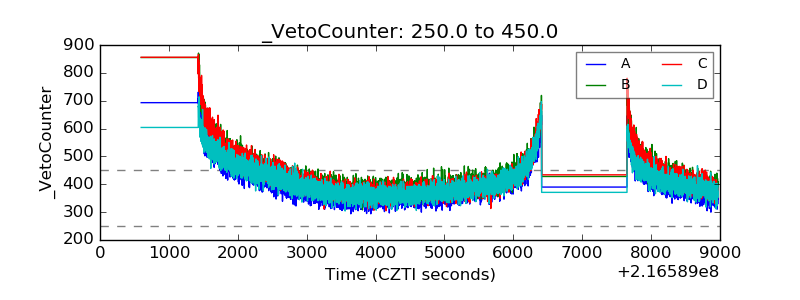 |