| Param | Original file | Final file |
|---|---|---|
| Filename | modeM0/AS1A02_028T03_9000000788_06081cztM0_level2.evt | modeM0/AS1A02_028T03_9000000788_06081cztM0_level2_quad_clean.evt |
| Size (bytes) | 459,999,360 | 90,927,360 |
| Size | 438.7 MB | 86.7 MB |
| Events in quadrant A | 3,246,523 | 576,364 |
| Events in quadrant B | 4,149,657 | 569,749 |
| Events in quadrant C | 3,003,241 | 580,915 |
| Events in quadrant D | 3,071,437 | 554,667 |
| Mode M0 | |||
|---|---|---|---|
| Quadrant | BADHDUFLAG | Total packets | Discarded packets |
| A | 0 | 14399 | 3 |
| B | 0 | 16987 | 2 |
| C | 0 | 13864 | 6 |
| D | 0 | 14261 | 6 |
| Mode M9 | |||
|---|---|---|---|
| Quadrant | BADHDUFLAG | Total packets | Discarded packets |
| A | 0 | 20 | 0 |
| B | 0 | 20 | 0 |
| C | 0 | 20 | 0 |
| D | 0 | 20 | 0 |
| Mode SS | |||
|---|---|---|---|
| Quadrant | BADHDUFLAG | Total packets | Discarded packets |
| A | 0 | 138 | 0 |
| B | 0 | 138 | 0 |
| C | 0 | 138 | 0 |
| D | 0 | 138 | 0 |
| Quadrant | Total seconds | Saturated seconds | Saturation percentage |
|---|---|---|---|
| A | 6767 | 51 | 0.753657% |
| B | 6767 | 373 | 5.512044% |
| C | 6765 | 25 | 0.369549% |
| D | 6765 | 37 | 0.546933% |
Noise dominated data is calculated using 1-second bins in cleaned event files. If a bin has >2000 counts, and if more than 50% of those come from <1% of pixels, then it is considered to be noise-dominated and hence unusable.
| Quadrant | # 1 sec bins | Bins with >0 counts | Bins with >2000 counts | High rate bins dominated by noise | Noise dominated (total time) | Noise dominated (detector-on time) | Marked lightcurve |
|---|---|---|---|---|---|---|---|
| A | 7707 | 6768 | 7 | 7 | 0.09% | 0.10% | 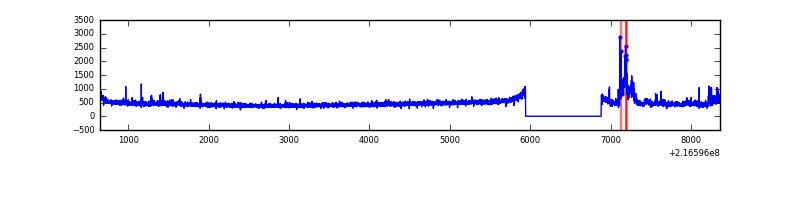 |
| B | 7707 | 6768 | 225 | 225 | 2.92% | 3.32% | 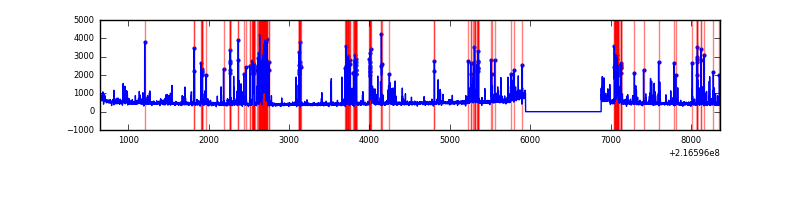 |
| C | 7707 | 6768 | 0 | 0 | 0.00% | 0.00% | 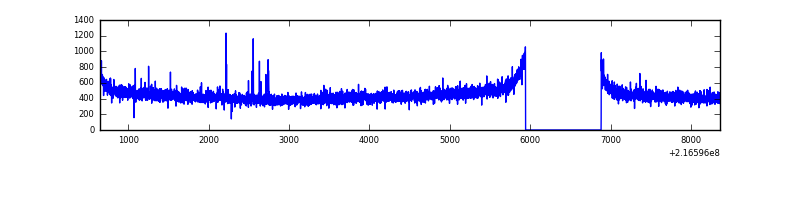 |
| D | 7707 | 6768 | 23 | 23 | 0.30% | 0.34% | 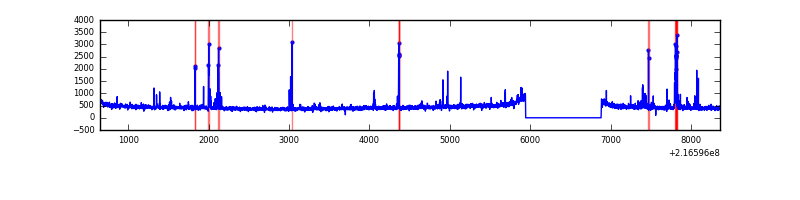 |
Top three noisy pixels from each quadrant. If the there are fewer than three noisy pixels in the level2.evt file, extra rows are filled as -1
| Pixel properties | Quadrant properties | ||||||
|---|---|---|---|---|---|---|---|
| Quadrant | DetID | PixID | Counts | Sigma | Mean | Median | Sigma |
| A | 8 | 15 | 222271 | 1389.77 | 774 | 755 | 159.4 |
| A | 14 | 111 | 26948 | 164.33 | 774 | 755 | 159.4 |
| A | 3 | 1 | 13505 | 79.99 | 774 | 755 | 159.4 |
| B | 3 | 64 | 1049352 | 7086.51 | 771 | 752 | 148.0 |
| B | 0 | 219 | 28915 | 190.33 | 771 | 752 | 148.0 |
| B | 4 | 81 | 26051 | 170.97 | 771 | 752 | 148.0 |
| C | 9 | 54 | 17776 | 95.43 | 763 | 766 | 178.3 |
| C | 13 | 61 | 6005 | 29.39 | 763 | 766 | 178.3 |
| C | 1 | 16 | 3947 | 17.85 | 763 | 766 | 178.3 |
| D | 13 | 169 | 60024 | 321.85 | 754 | 733 | 184.2 |
| D | 2 | 206 | 40990 | 218.53 | 754 | 733 | 184.2 |
| D | 2 | 33 | 38162 | 203.17 | 754 | 733 | 184.2 |
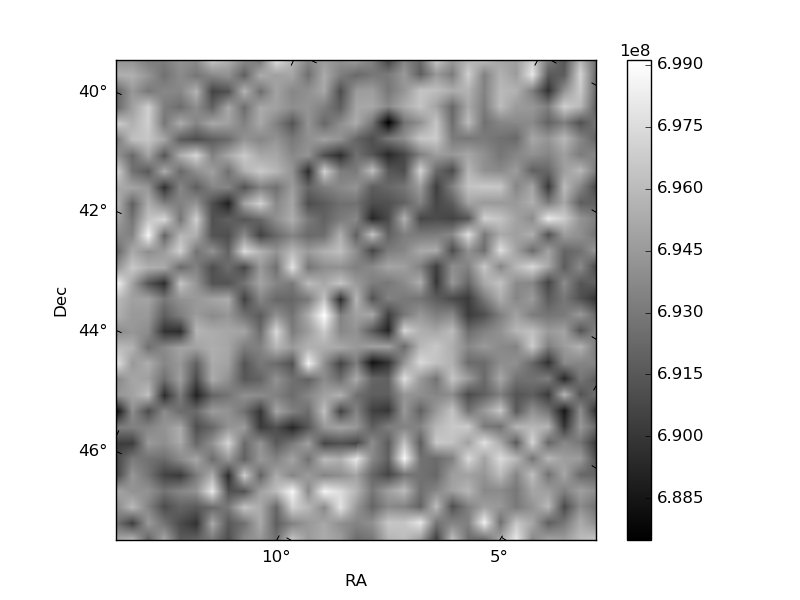
Histogram calculated using DETX and DETY for each event in the final _common_clean file
| Quadrant A | 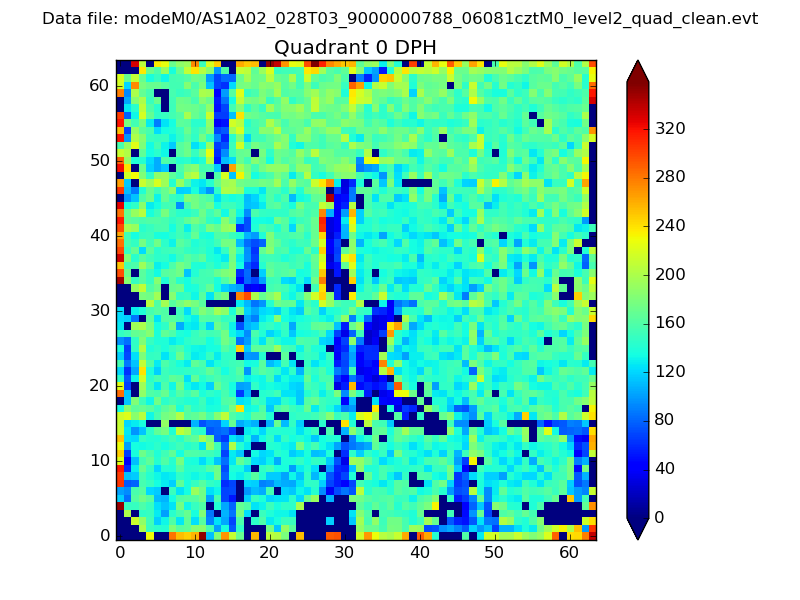 |
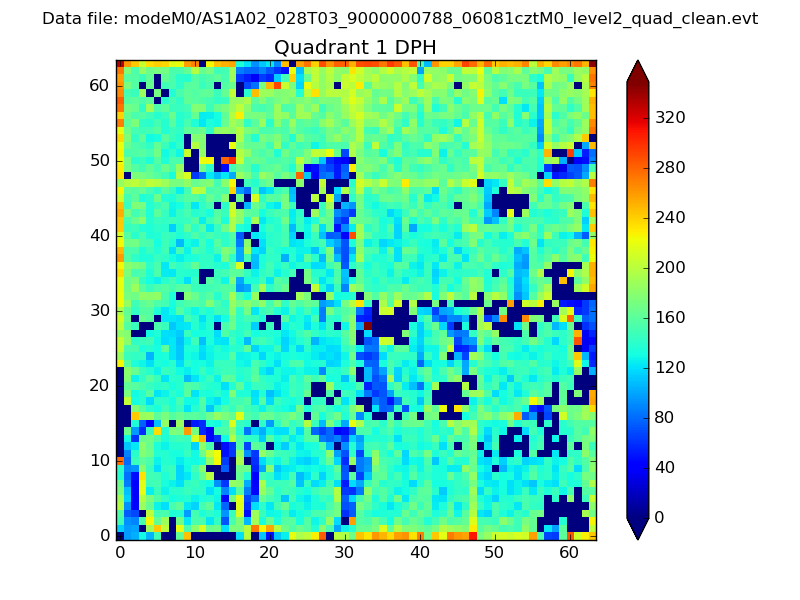 |
Quadrant B |
|---|---|---|---|
| Quadrant D | 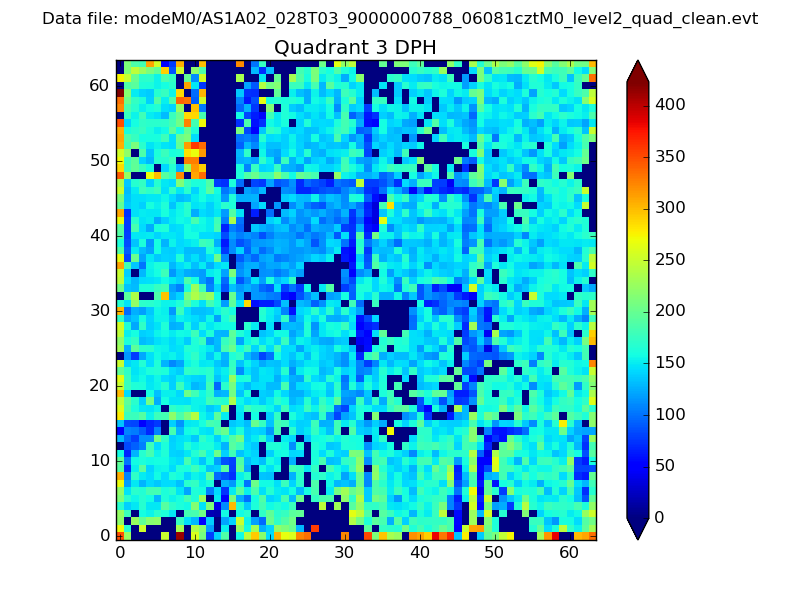 |
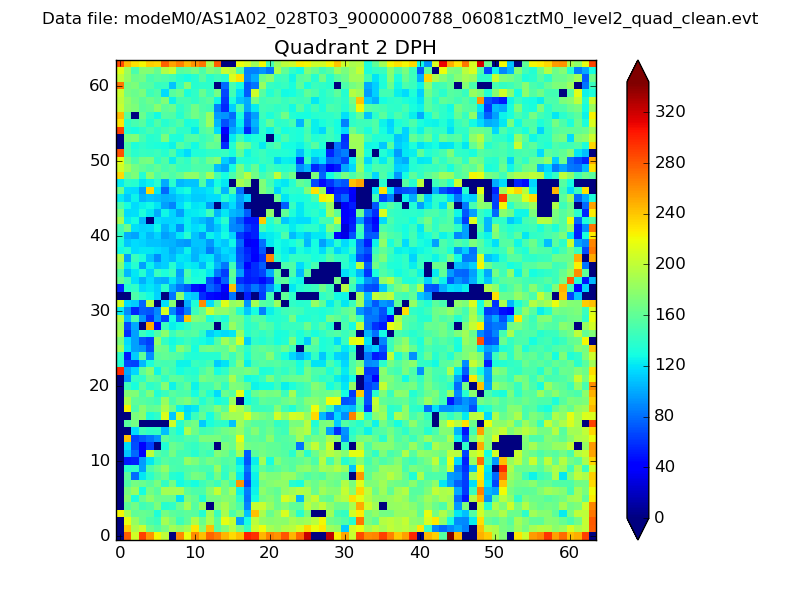 |
Quadrant C |
| Plot type | Count rate plots | Images |
|---|---|---|
| Comparison with Poisson distribution Blue bars denote a histogram of data divided into 1 sec bins. Red curve is a Poisson curve with rate = median count rate of data. |
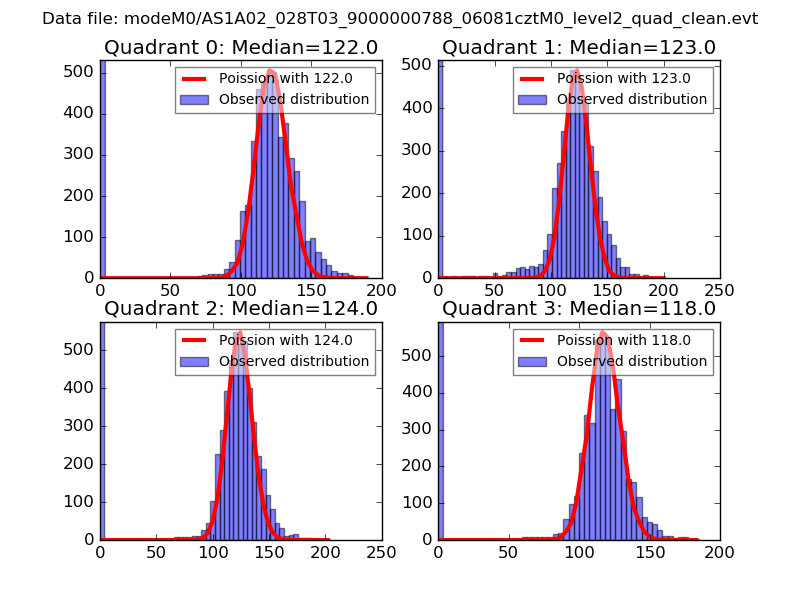 |
 |
| Quadrant-wise count rates Data is divided into 100 sec bins |
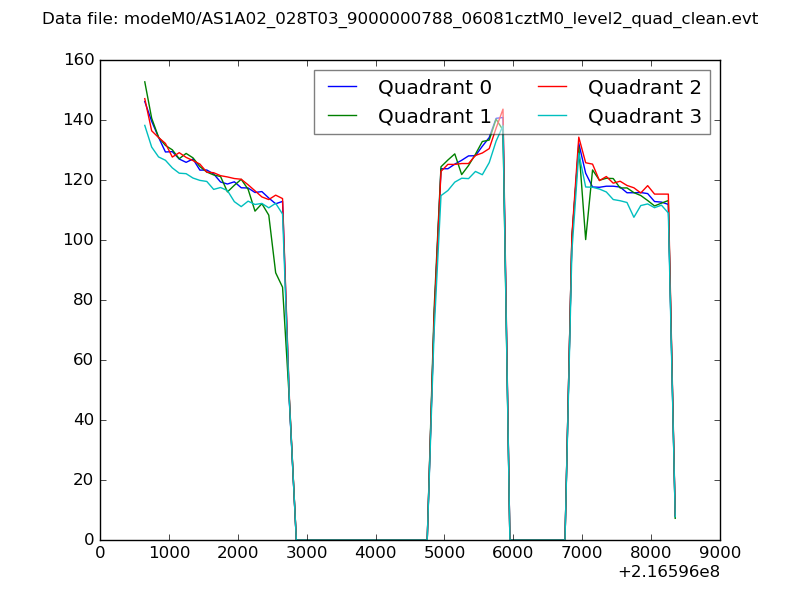 |
|
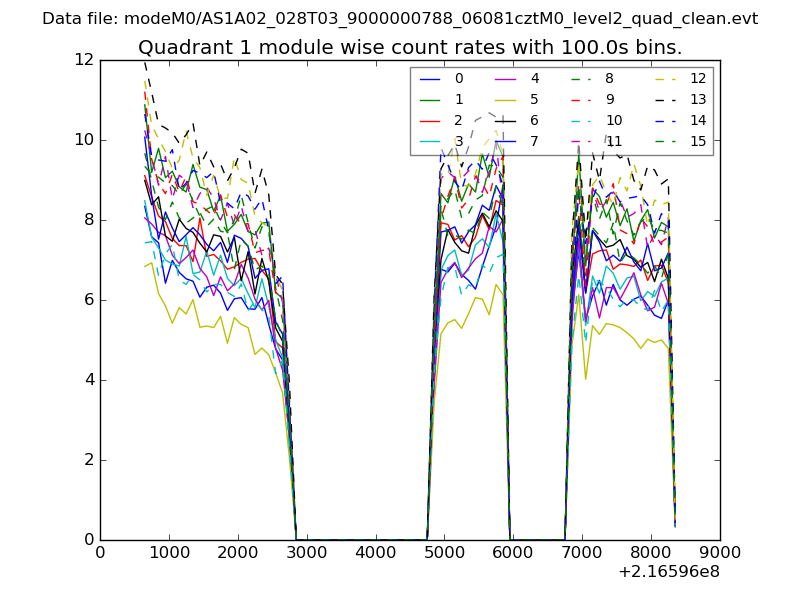
| Module-wise count rates for Quadrant A Data is divided into 100 sec bins |
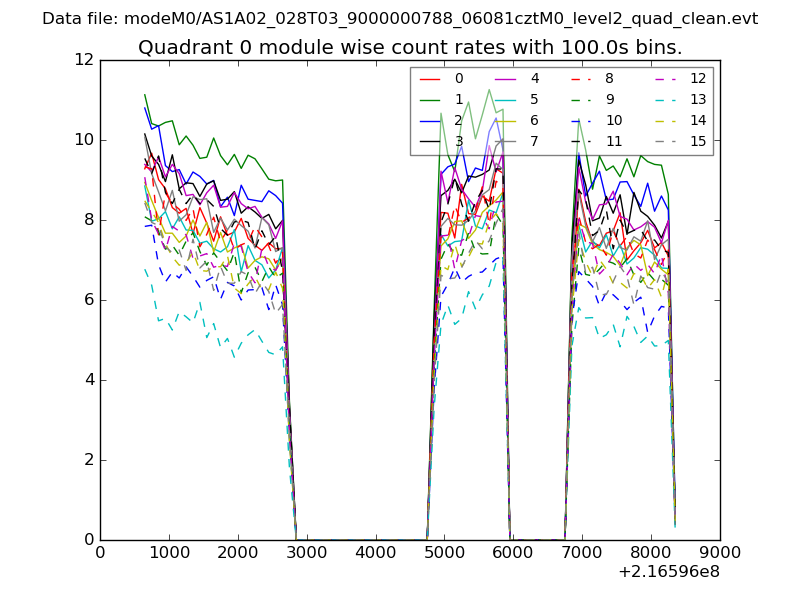 |
 |
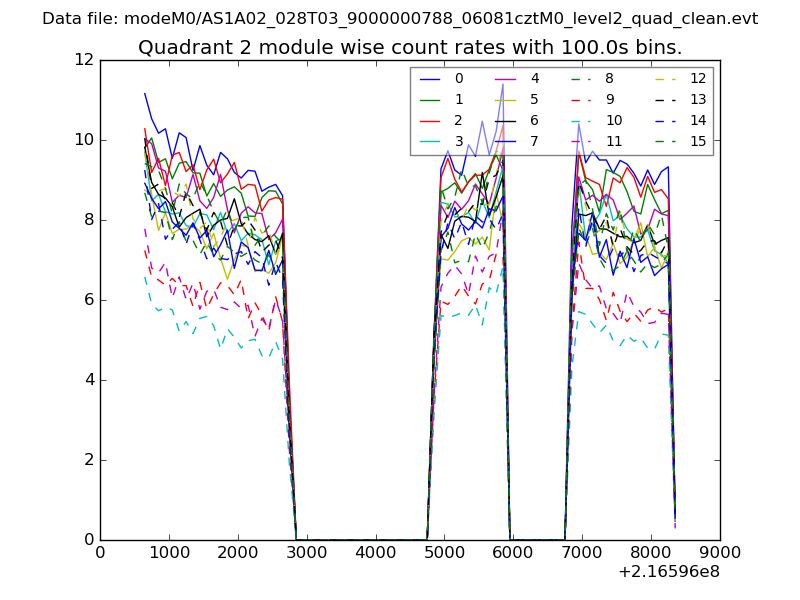
| Module-wise count rates for Quadrant B Data is divided into 100 sec bins |
 |
 |
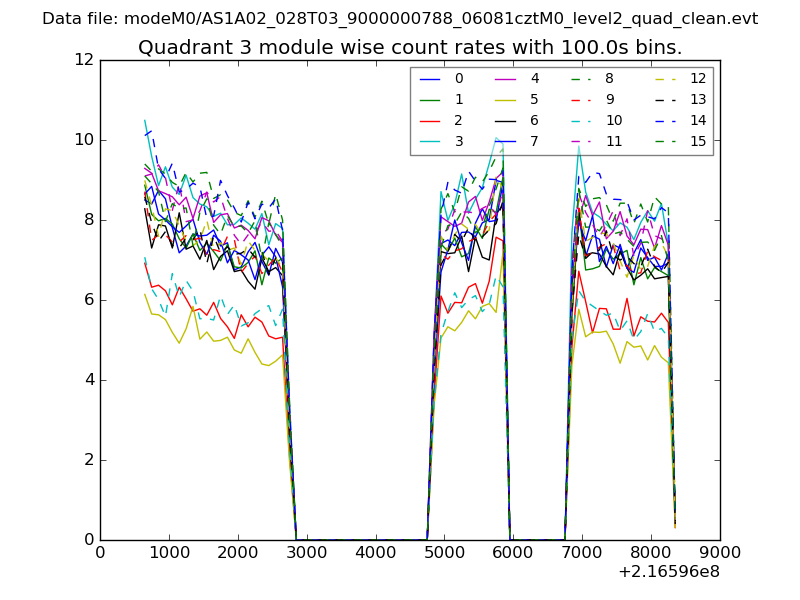
| Module-wise count rates for Quadrant C Data is divided into 100 sec bins |
 |
 |
| Module-wise count rates for Quadrant D Data is divided into 100 sec bins |
 |
 |
| Parameter | Plot |
|---|---|
| CZT HV Monitor | 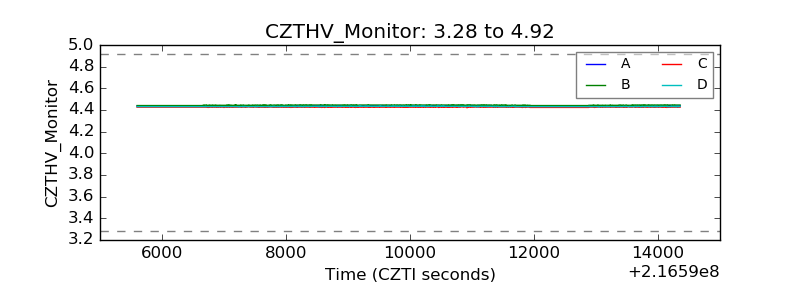 |
| D_VDD |  |
| Temperature 1 | 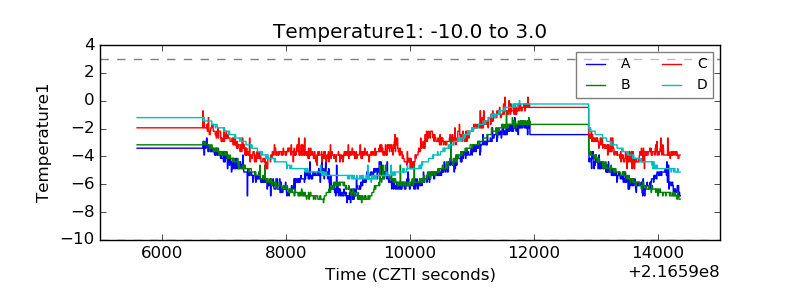 |
| Veto HV Monitor | 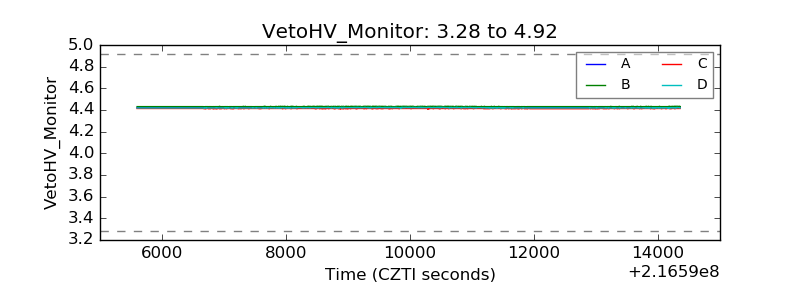 |
| Veto LLD | 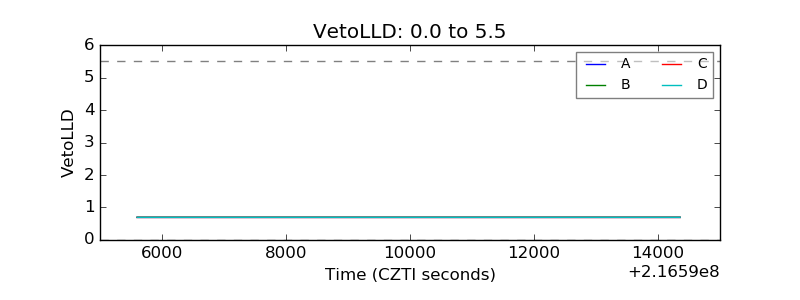 |
| Alpha Counter | 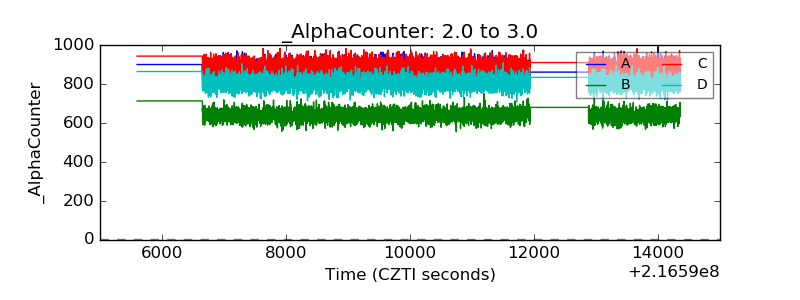 |
| _CPM_Rate | 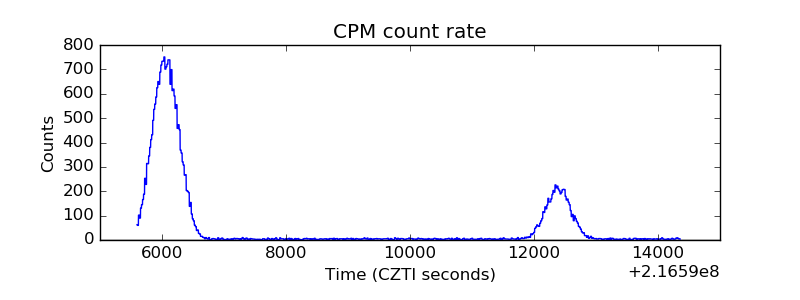 |
| CZT Counter | 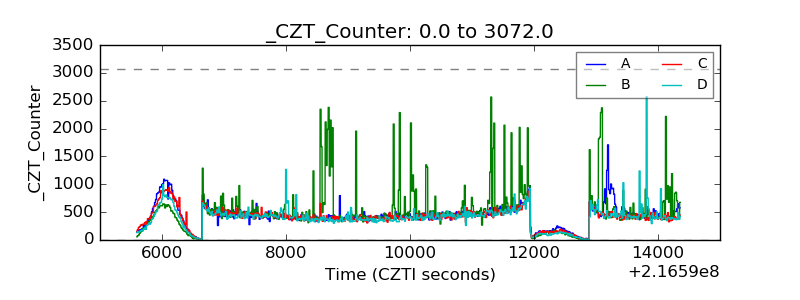 |
| +2.5 Volts monitor |  |
| +5 Volts monitor |  |
| _ROLL_ROT | 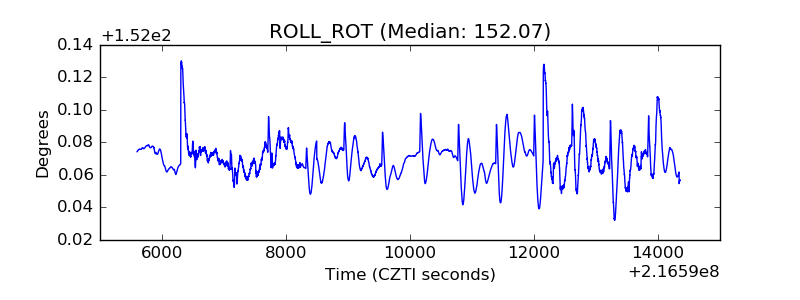 |
| _Roll_DEC | 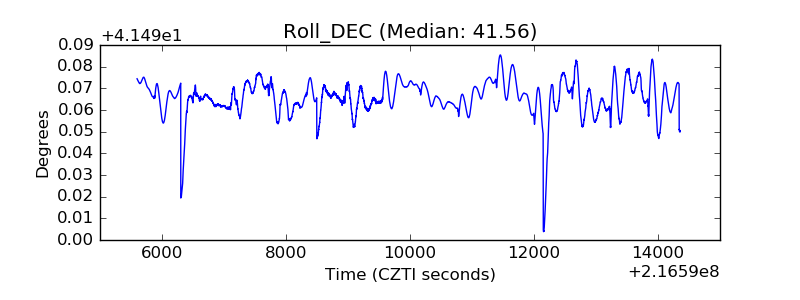 |
| _Roll_RA | 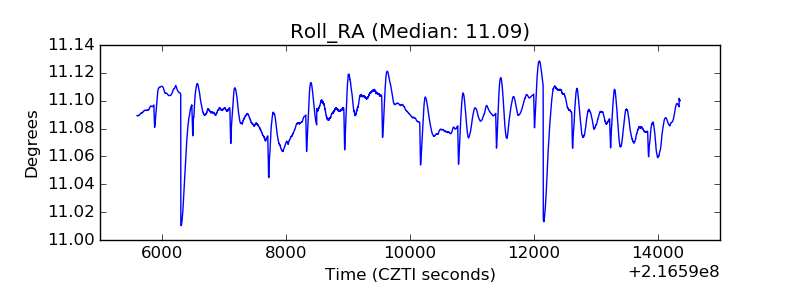 |
| Veto Counter | 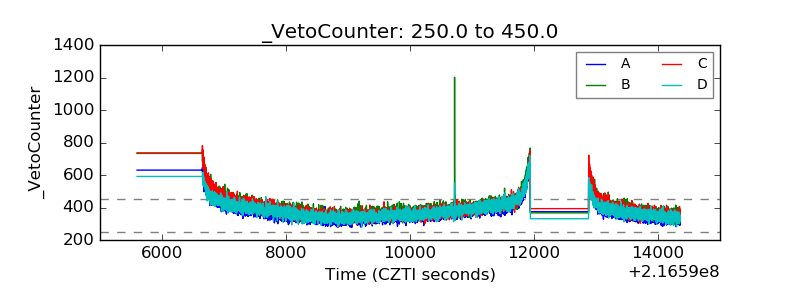 |