| Param | Original file | Final file |
|---|---|---|
| Filename | modeM0/AS1A02_028T03_9000000788_06083cztM0_level2.evt | modeM0/AS1A02_028T03_9000000788_06083cztM0_level2_quad_clean.evt |
| Size (bytes) | 488,016,000 | 89,328,960 |
| Size | 465.4 MB | 85.2 MB |
| Events in quadrant A | 3,543,586 | 560,766 |
| Events in quadrant B | 3,971,904 | 546,751 |
| Events in quadrant C | 3,272,051 | 563,324 |
| Events in quadrant D | 3,504,364 | 535,081 |
| Mode M0 | |||
|---|---|---|---|
| Quadrant | BADHDUFLAG | Total packets | Discarded packets |
| A | 0 | 17658 | 2268 |
| B | 0 | 19562 | 2778 |
| C | 0 | 17055 | 2114 |
| D | 0 | 18031 | 2376 |
| Mode M9 | |||
|---|---|---|---|
| Quadrant | BADHDUFLAG | Total packets | Discarded packets |
| A | 0 | 6 | 1 |
| B | 0 | 6 | 2 |
| C | 0 | 6 | 1 |
| D | 0 | 6 | 1 |
| Mode SS | |||
|---|---|---|---|
| Quadrant | BADHDUFLAG | Total packets | Discarded packets |
| A | 0 | 168 | 20 |
| B | 0 | 168 | 26 |
| C | 0 | 167 | 31 |
| D | 0 | 167 | 27 |
| Quadrant | Total seconds | Saturated seconds | Saturation percentage |
|---|---|---|---|
| A | 7193 | 95 | 1.320728% |
| B | 7138 | 295 | 4.132810% |
| C | 7209 | 38 | 0.527119% |
| D | 7125 | 65 | 0.912281% |
Noise dominated data is calculated using 1-second bins in cleaned event files. If a bin has >2000 counts, and if more than 50% of those come from <1% of pixels, then it is considered to be noise-dominated and hence unusable.
| Quadrant | # 1 sec bins | Bins with >0 counts | Bins with >2000 counts | High rate bins dominated by noise | Noise dominated (total time) | Noise dominated (detector-on time) | Marked lightcurve |
|---|---|---|---|---|---|---|---|
| A | 8904 | 7680 | 13 | 13 | 0.15% | 0.17% | 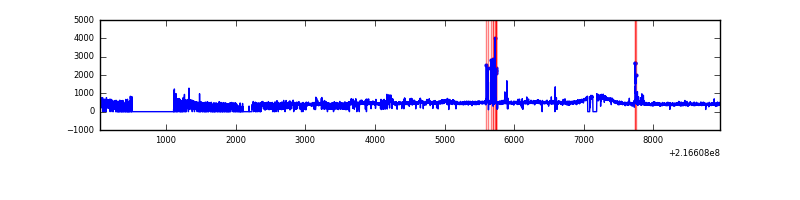 |
| B | 8904 | 7663 | 109 | 109 | 1.22% | 1.42% | 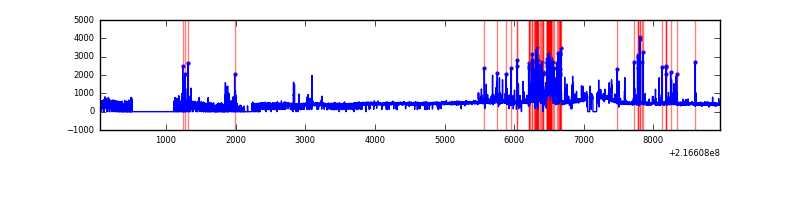 |
| C | 8904 | 7718 | 0 | 0 | 0.00% | 0.00% | 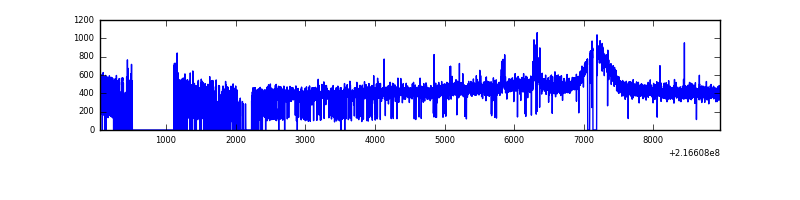 |
| D | 8904 | 7656 | 33 | 33 | 0.37% | 0.43% | 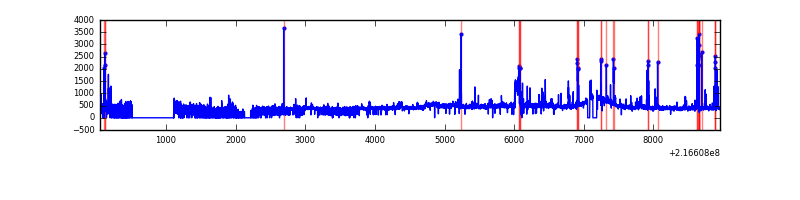 |
Top three noisy pixels from each quadrant. If the there are fewer than three noisy pixels in the level2.evt file, extra rows are filled as -1
| Pixel properties | Quadrant properties | ||||||
|---|---|---|---|---|---|---|---|
| Quadrant | DetID | PixID | Counts | Sigma | Mean | Median | Sigma |
| A | 0 | 31 | 214520 | 1246.48 | 834 | 814 | 171.4 |
| A | 8 | 15 | 53656 | 308.21 | 834 | 814 | 171.4 |
| A | 4 | 2 | 40892 | 233.76 | 834 | 814 | 171.4 |
| B | 3 | 64 | 649930 | 4015.48 | 827 | 805 | 161.7 |
| B | 0 | 219 | 35554 | 214.96 | 827 | 805 | 161.7 |
| B | 0 | 214 | 22340 | 133.22 | 827 | 805 | 161.7 |
| C | 9 | 54 | 29709 | 150.28 | 823 | 826 | 192.2 |
| C | 1 | 16 | 19092 | 95.04 | 823 | 826 | 192.2 |
| C | 8 | 128 | 7138 | 32.84 | 823 | 826 | 192.2 |
| D | 5 | 239 | 145663 | 731.62 | 807 | 780 | 198.0 |
| D | 5 | 190 | 112941 | 566.38 | 807 | 780 | 198.0 |
| D | 13 | 169 | 55097 | 274.29 | 807 | 780 | 198.0 |
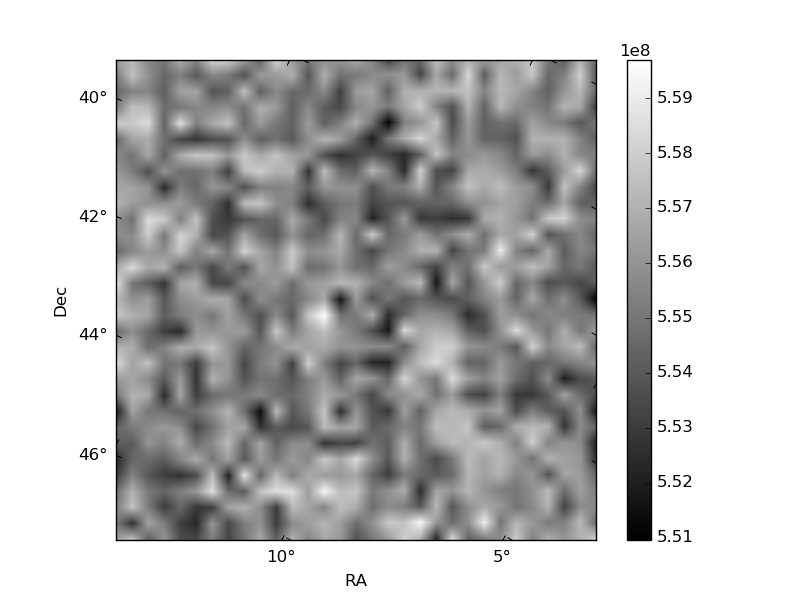
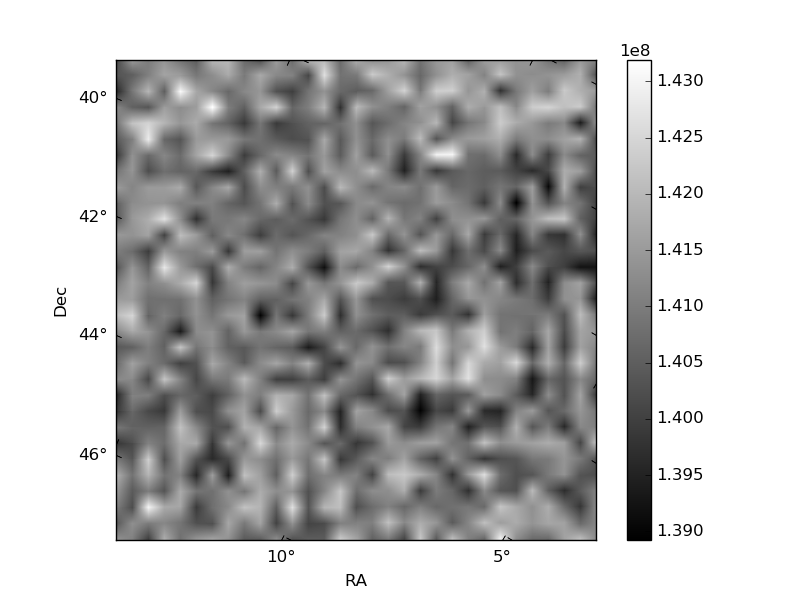
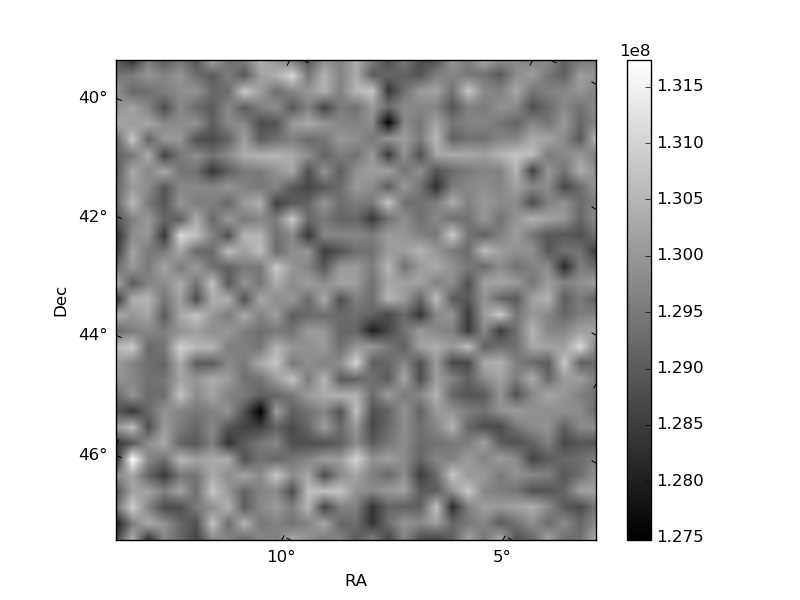
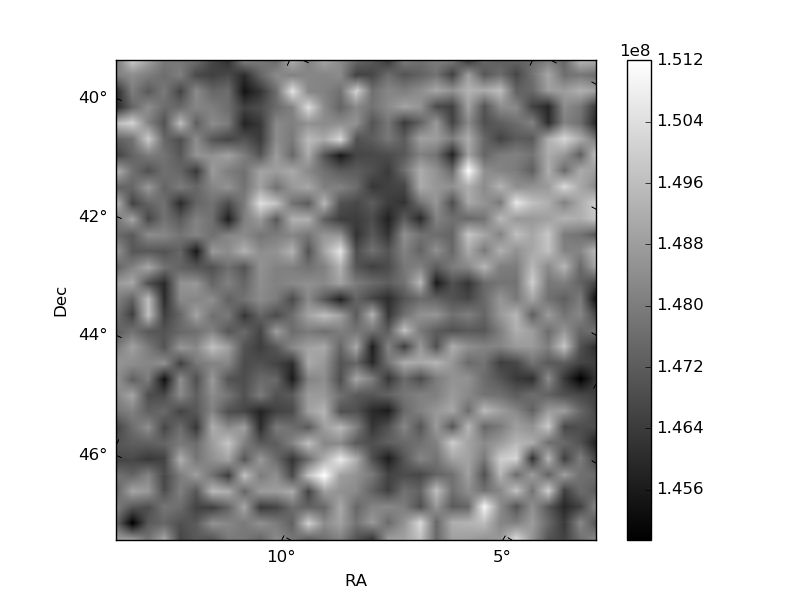
Histogram calculated using DETX and DETY for each event in the final _common_clean file
| Quadrant A | 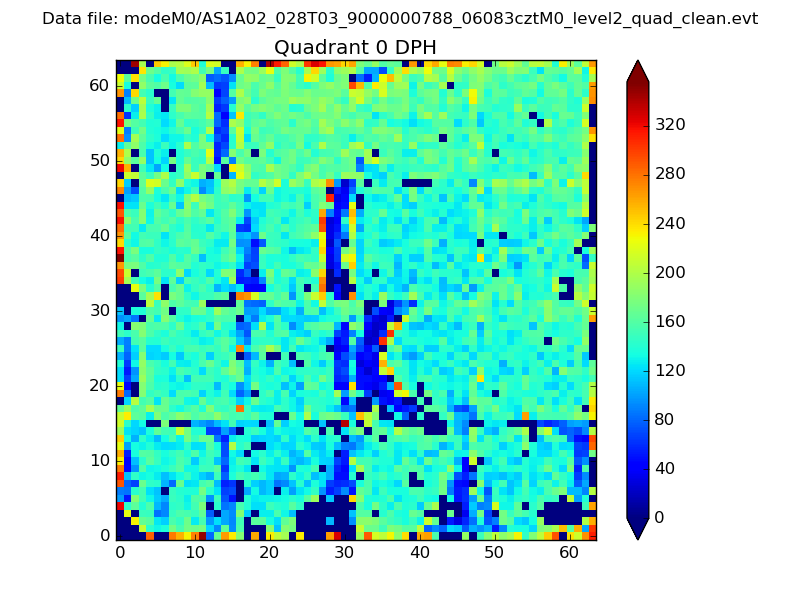 |
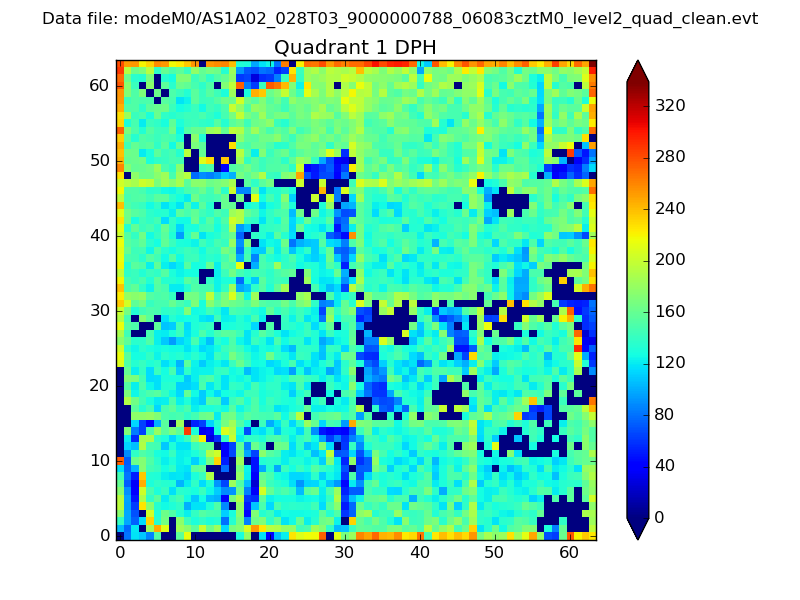 |
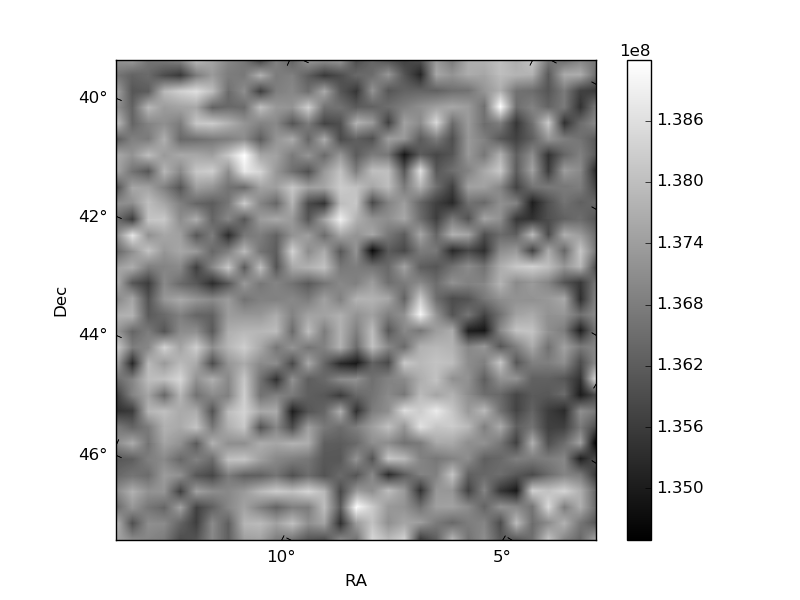
Quadrant B |
|---|---|---|---|
| Quadrant D | 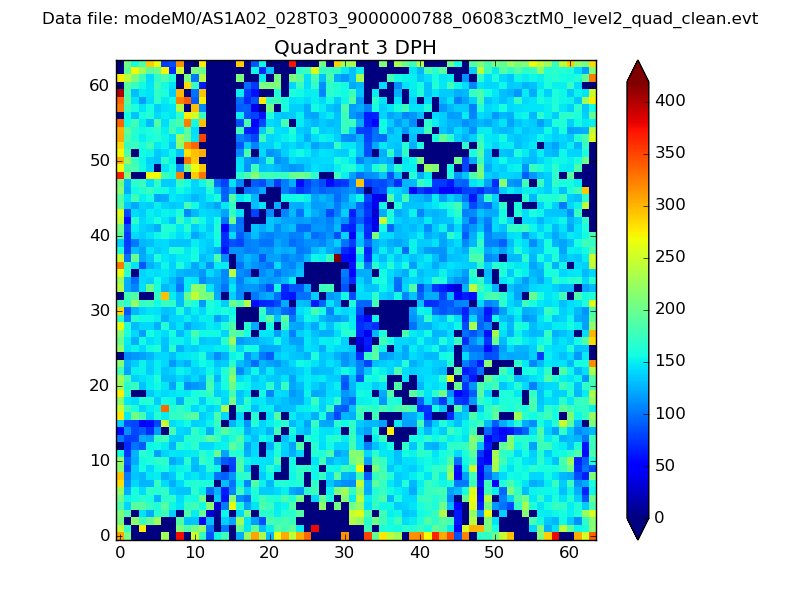 |
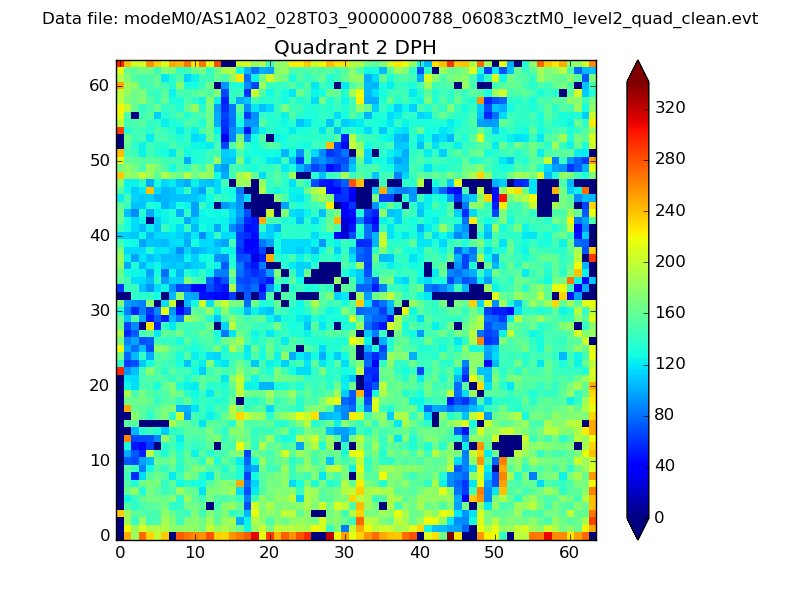 |
Quadrant C |
| Plot type | Count rate plots | Images |
|---|---|---|
| Comparison with Poisson distribution Blue bars denote a histogram of data divided into 1 sec bins. Red curve is a Poisson curve with rate = median count rate of data. |
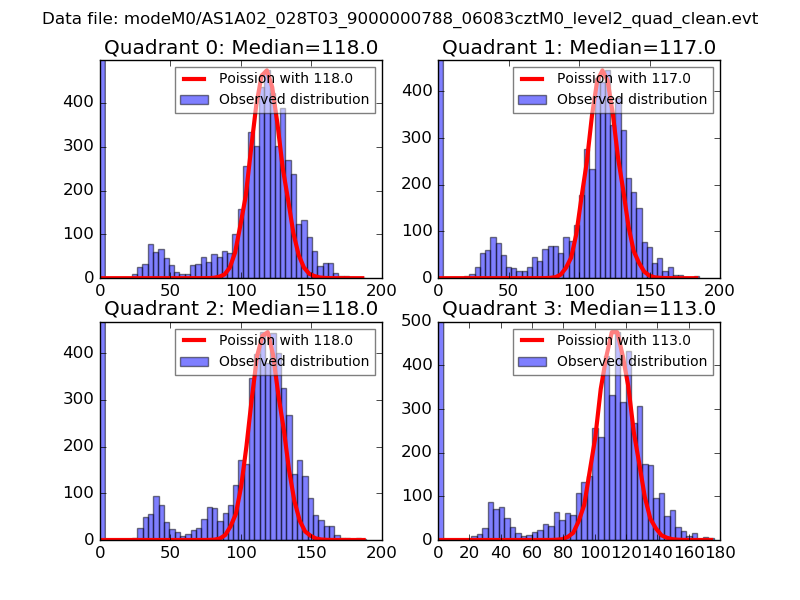 |
 |
| Quadrant-wise count rates Data is divided into 100 sec bins |
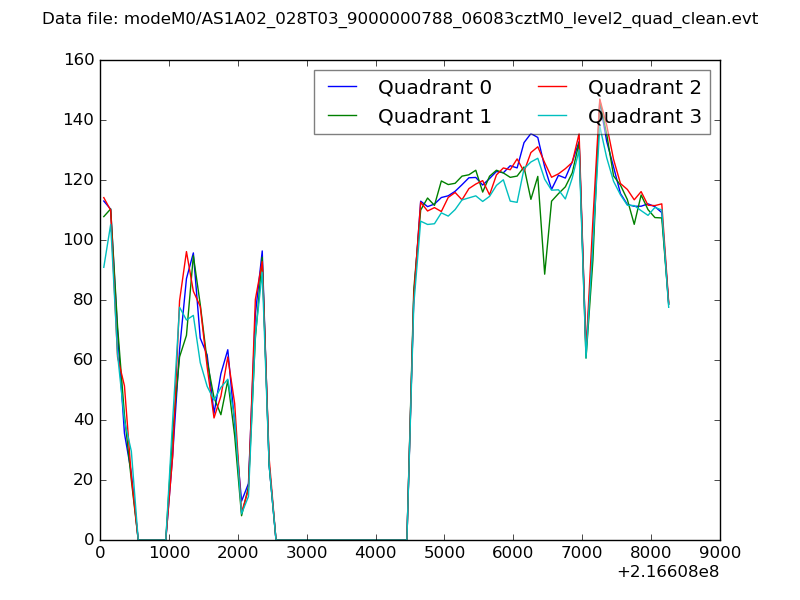 |
|
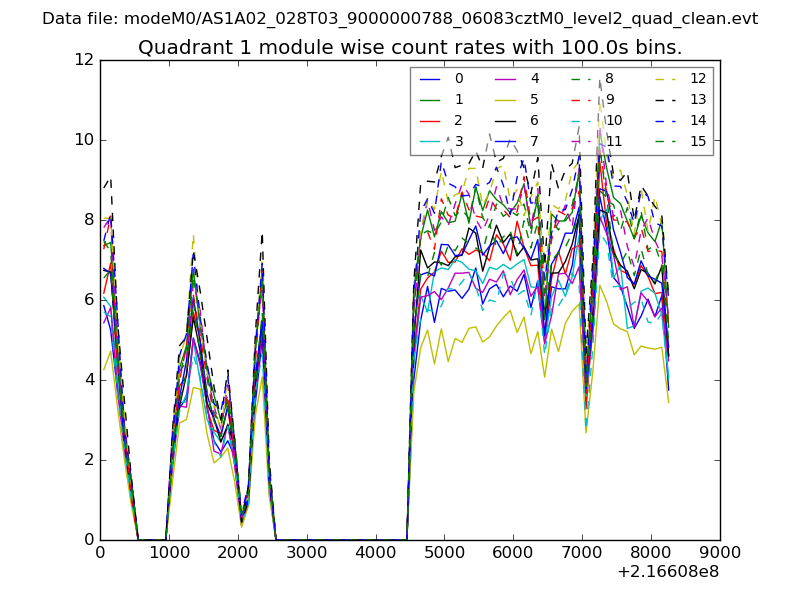
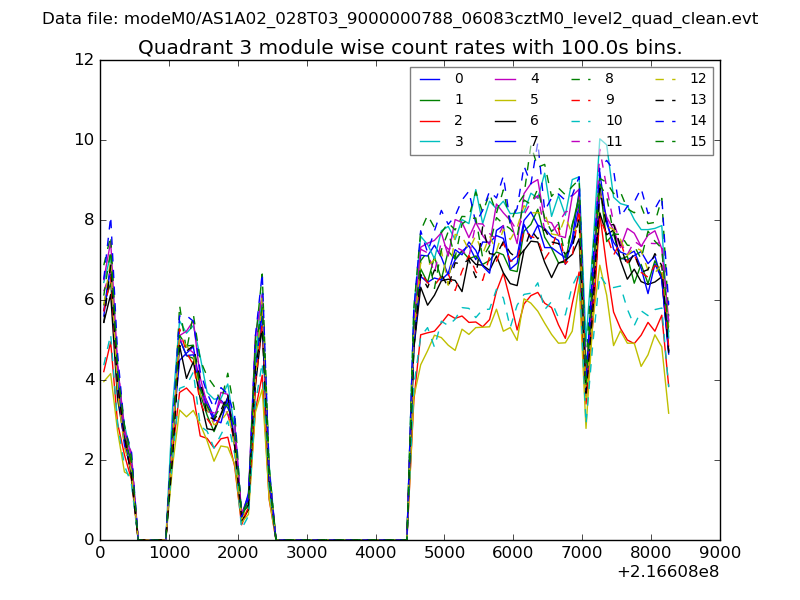
| Module-wise count rates for Quadrant A Data is divided into 100 sec bins |
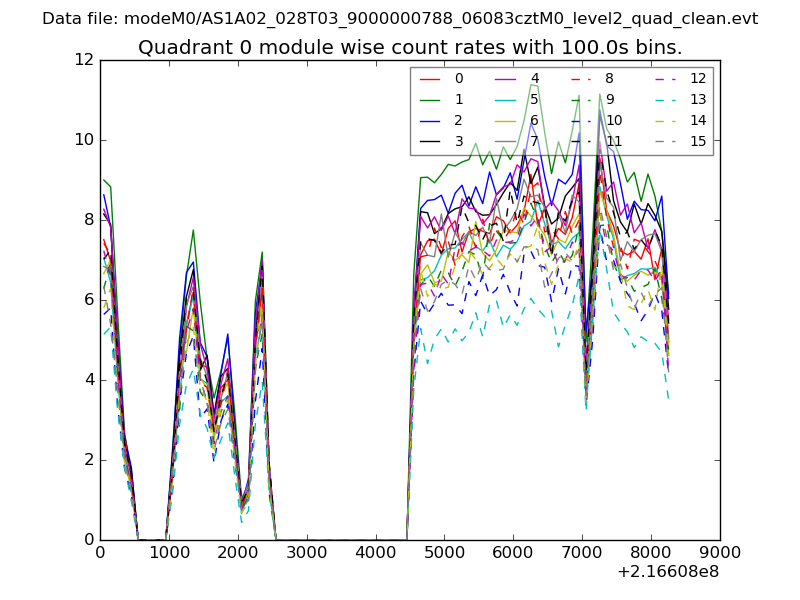 |
 |
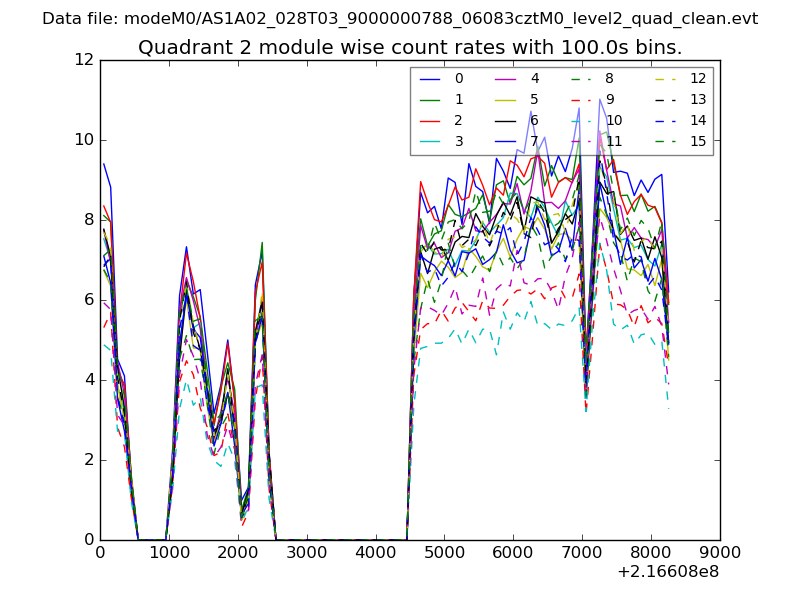
| Module-wise count rates for Quadrant B Data is divided into 100 sec bins |
 |
 |
| Module-wise count rates for Quadrant C Data is divided into 100 sec bins |
 |
 |
| Module-wise count rates for Quadrant D Data is divided into 100 sec bins |
 |
 |
| Parameter | Plot |
|---|---|
| CZT HV Monitor | 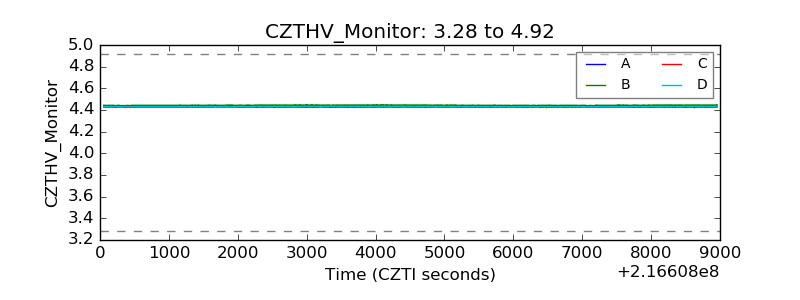 |
| D_VDD | 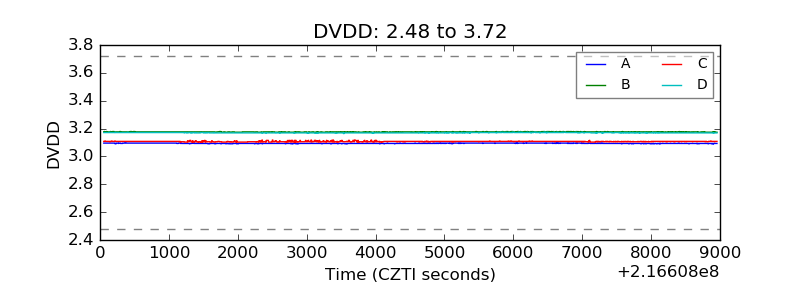 |
| Temperature 1 | 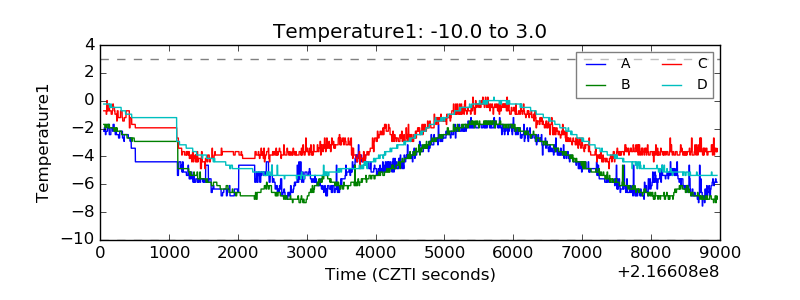 |
| Veto HV Monitor | 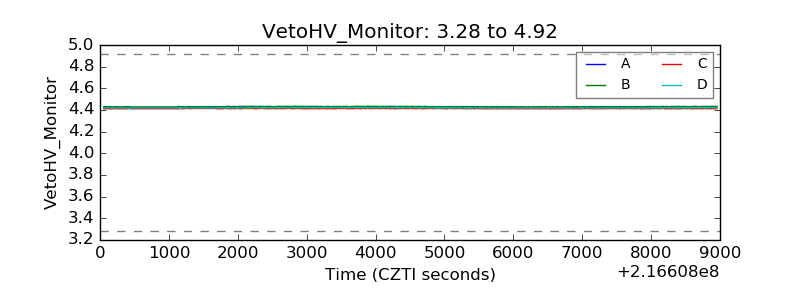 |
| Veto LLD | 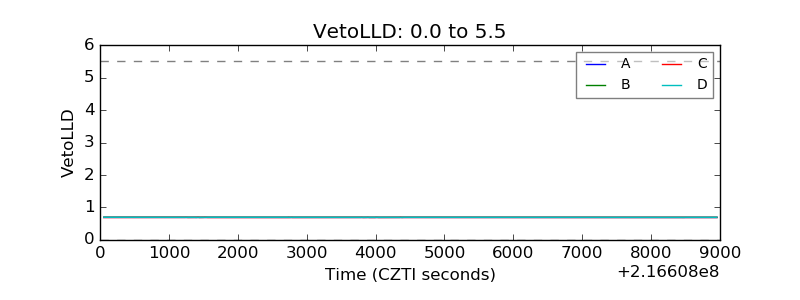 |
| Alpha Counter | 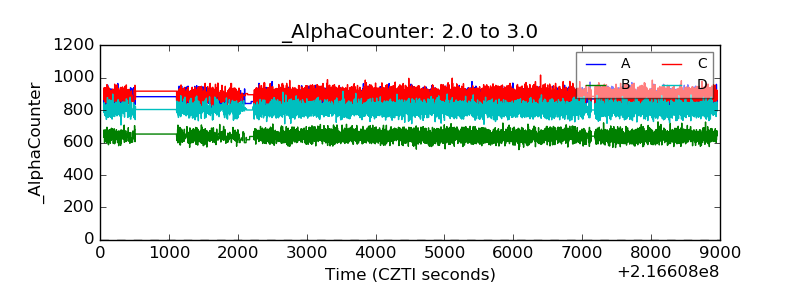 |
| _CPM_Rate | 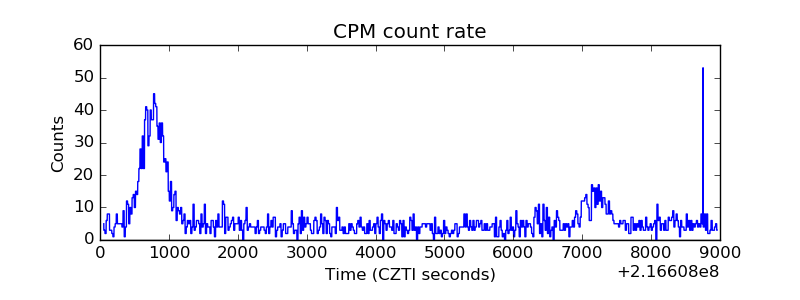 |
| CZT Counter | 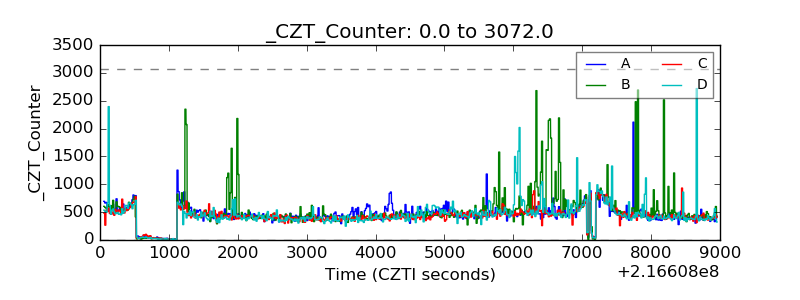 |
| +2.5 Volts monitor |  |
| +5 Volts monitor |  |
| _ROLL_ROT | 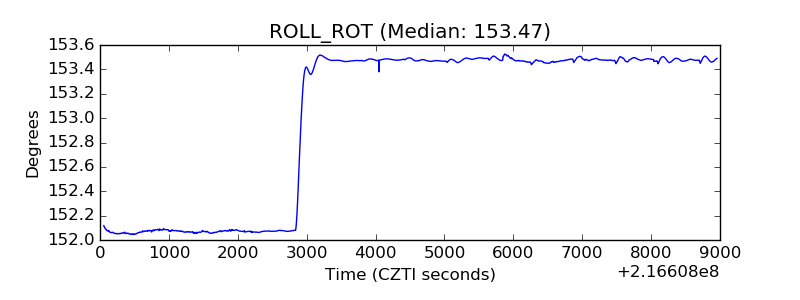 |
| _Roll_DEC | 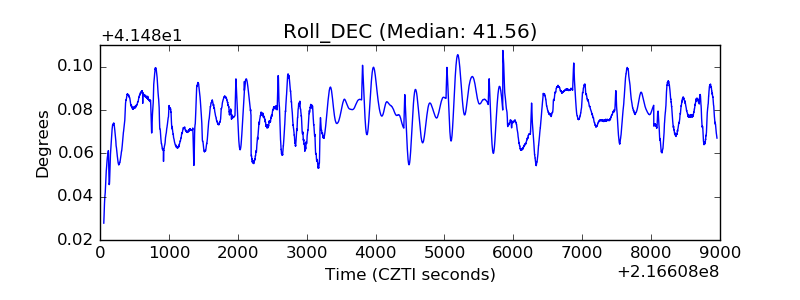 |
| _Roll_RA | 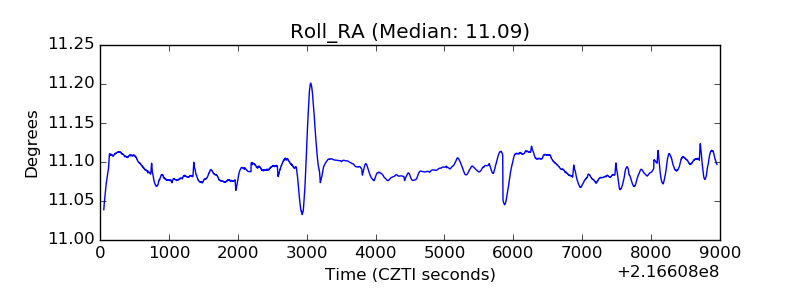 |
| Veto Counter | 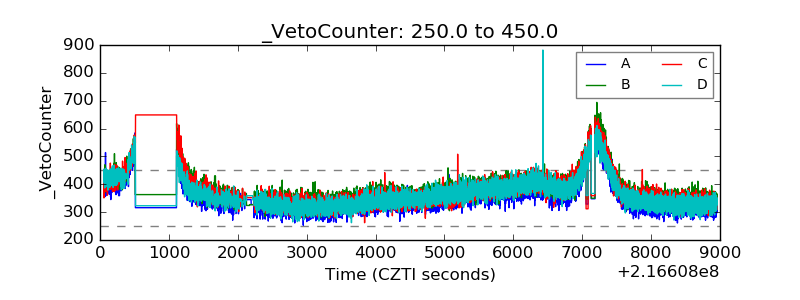 |