| Param | Original file | Final file |
|---|---|---|
| Filename | modeM0/AS1A02_028T03_9000000788_06084cztM0_level2.evt | modeM0/AS1A02_028T03_9000000788_06084cztM0_level2_quad_clean.evt |
| Size (bytes) | 871,202,880 | 151,945,920 |
| Size | 830.8 MB | 144.9 MB |
| Events in quadrant A | 6,200,372 | 933,131 |
| Events in quadrant B | 7,222,638 | 926,644 |
| Events in quadrant C | 5,971,129 | 940,563 |
| Events in quadrant D | 6,107,601 | 900,760 |
| Mode M0 | |||
|---|---|---|---|
| Quadrant | BADHDUFLAG | Total packets | Discarded packets |
| A | 0 | 27344 | 10 |
| B | 0 | 30533 | 15 |
| C | 0 | 27226 | 19 |
| D | 0 | 27895 | 15 |
| Mode M9 | |||
|---|---|---|---|
| Quadrant | BADHDUFLAG | Total packets | Discarded packets |
| A | 0 | 1 | 0 |
| B | 0 | 1 | 0 |
| C | 0 | 1 | 0 |
| D | 0 | 1 | 0 |
| Mode SS | |||
|---|---|---|---|
| Quadrant | BADHDUFLAG | Total packets | Discarded packets |
| A | 0 | 264 | 0 |
| B | 0 | 264 | 0 |
| C | 0 | 264 | 0 |
| D | 0 | 264 | 0 |
| Quadrant | Total seconds | Saturated seconds | Saturation percentage |
|---|---|---|---|
| A | 13025 | 217 | 1.666027% |
| B | 13023 | 620 | 4.760808% |
| C | 13020 | 144 | 1.105991% |
| D | 13022 | 118 | 0.906159% |
Noise dominated data is calculated using 1-second bins in cleaned event files. If a bin has >2000 counts, and if more than 50% of those come from <1% of pixels, then it is considered to be noise-dominated and hence unusable.
| Quadrant | # 1 sec bins | Bins with >0 counts | Bins with >2000 counts | High rate bins dominated by noise | Noise dominated (total time) | Noise dominated (detector-on time) | Marked lightcurve |
|---|---|---|---|---|---|---|---|
| A | 13203 | 13031 | 15 | 15 | 0.11% | 0.12% | 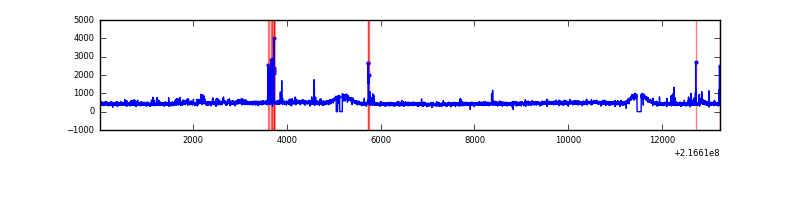 |
| B | 13203 | 13031 | 224 | 224 | 1.70% | 1.72% | 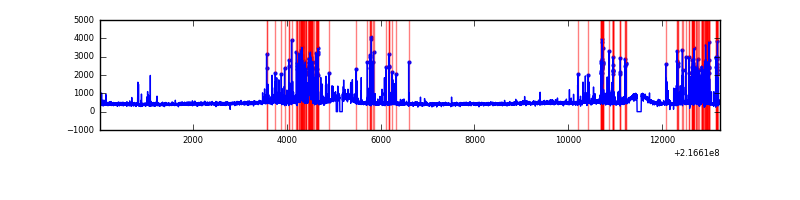 |
| C | 13203 | 13031 | 43 | 43 | 0.33% | 0.33% | 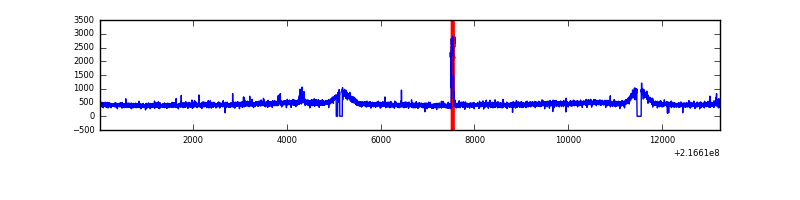 |
| D | 13203 | 13031 | 39 | 39 | 0.30% | 0.30% | 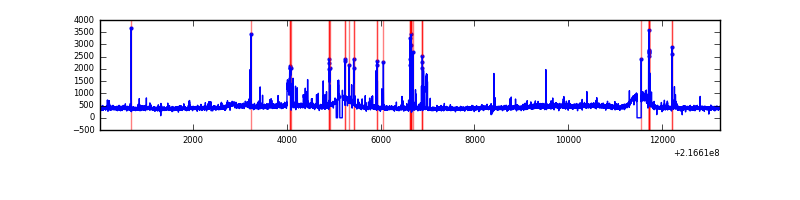 |
Top three noisy pixels from each quadrant. If the there are fewer than three noisy pixels in the level2.evt file, extra rows are filled as -1
| Pixel properties | Quadrant properties | ||||||
|---|---|---|---|---|---|---|---|
| Quadrant | DetID | PixID | Counts | Sigma | Mean | Median | Sigma |
| A | 0 | 31 | 235065 | 755.08 | 1506 | 1469 | 309.4 |
| A | 8 | 15 | 63363 | 200.07 | 1506 | 1469 | 309.4 |
| A | 4 | 2 | 54182 | 170.39 | 1506 | 1469 | 309.4 |
| B | 3 | 64 | 1141346 | 3926.77 | 1503 | 1461 | 290.3 |
| B | 4 | 81 | 77277 | 261.18 | 1503 | 1461 | 290.3 |
| B | 0 | 219 | 75872 | 256.34 | 1503 | 1461 | 290.3 |
| C | 9 | 54 | 164933 | 480.2 | 1473 | 1480 | 340.4 |
| C | 1 | 16 | 36148 | 101.85 | 1473 | 1480 | 340.4 |
| C | 13 | 61 | 11857 | 30.49 | 1473 | 1480 | 340.4 |
| D | 5 | 239 | 174917 | 480.16 | 1467 | 1418 | 361.3 |
| D | 5 | 190 | 132612 | 363.08 | 1467 | 1418 | 361.3 |
| D | 13 | 169 | 59012 | 159.39 | 1467 | 1418 | 361.3 |
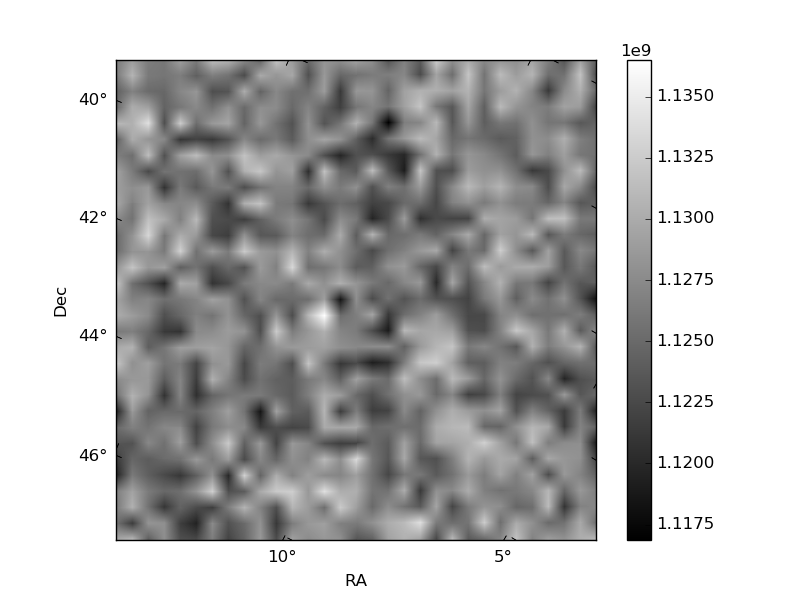
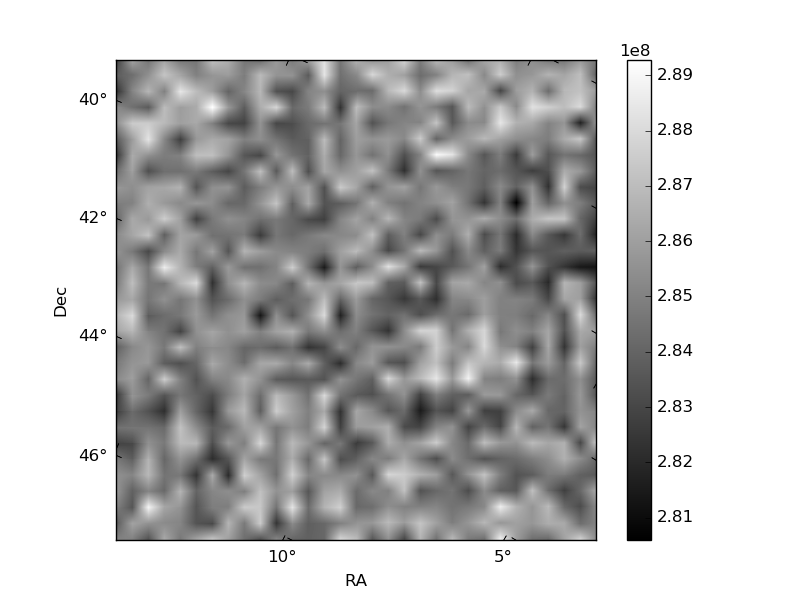
Histogram calculated using DETX and DETY for each event in the final _common_clean file
| Quadrant A | 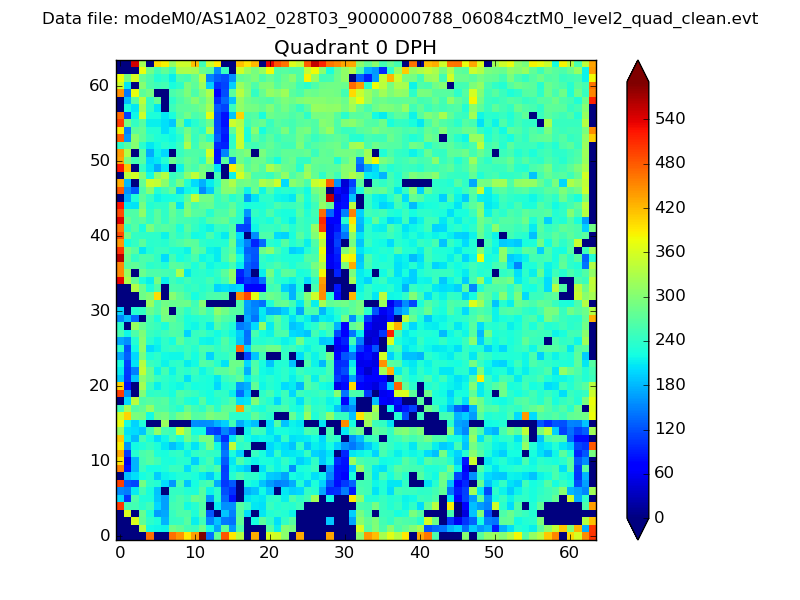 |
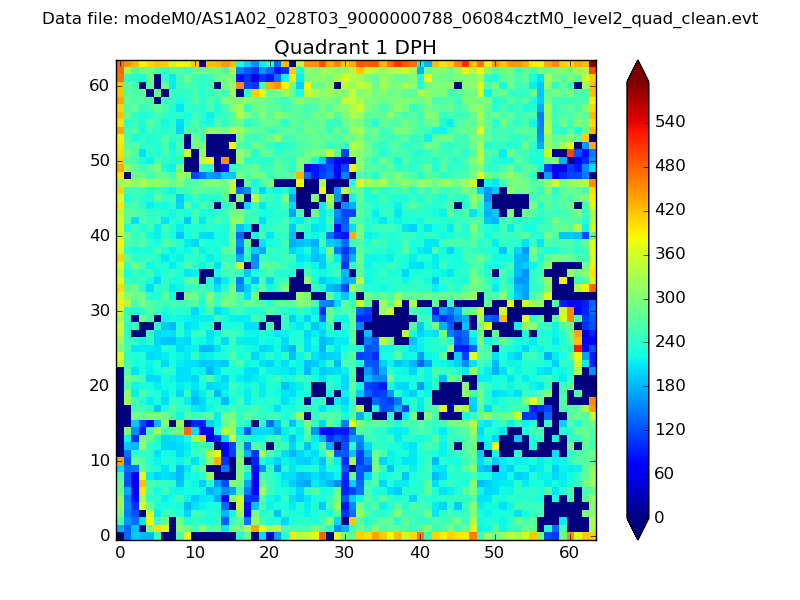 |
Quadrant B |
|---|---|---|---|
| Quadrant D | 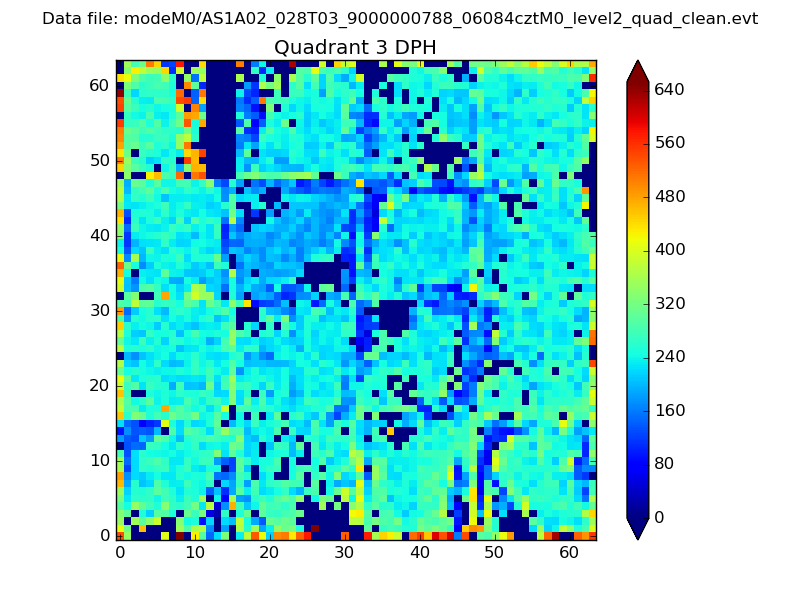 |
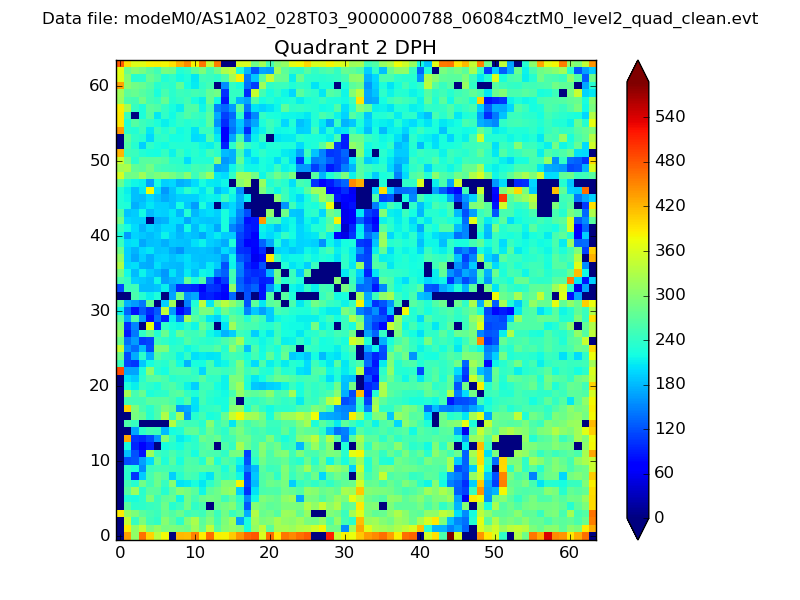 |
Quadrant C |
| Plot type | Count rate plots | Images |
|---|---|---|
| Comparison with Poisson distribution Blue bars denote a histogram of data divided into 1 sec bins. Red curve is a Poisson curve with rate = median count rate of data. |
 |
 |
| Quadrant-wise count rates Data is divided into 100 sec bins |
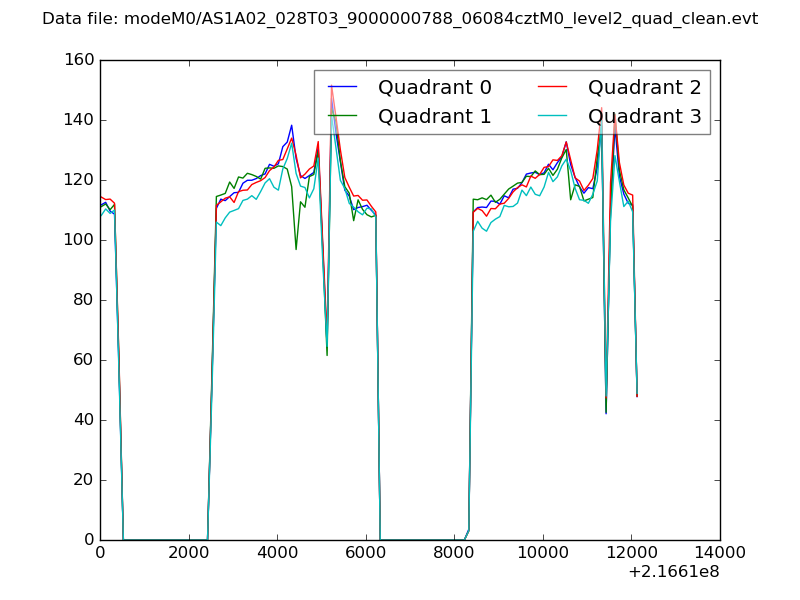 |
|
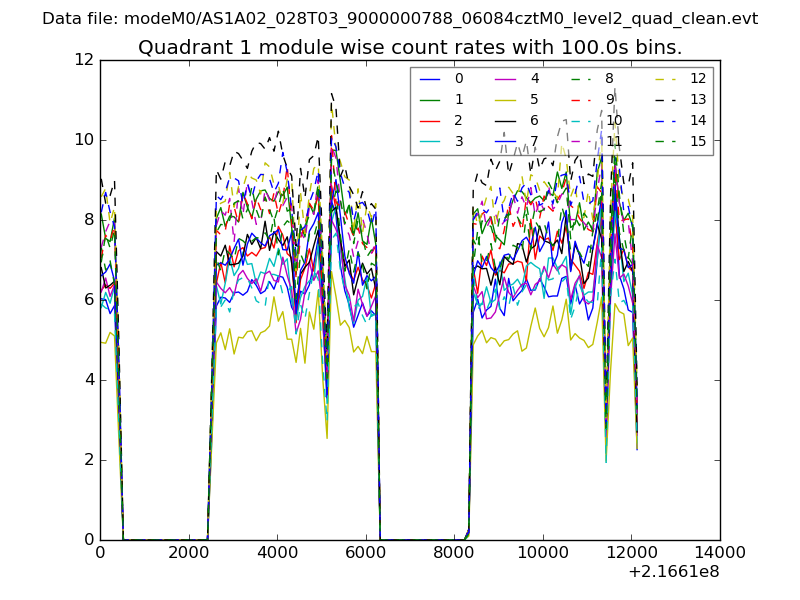
| Module-wise count rates for Quadrant A Data is divided into 100 sec bins |
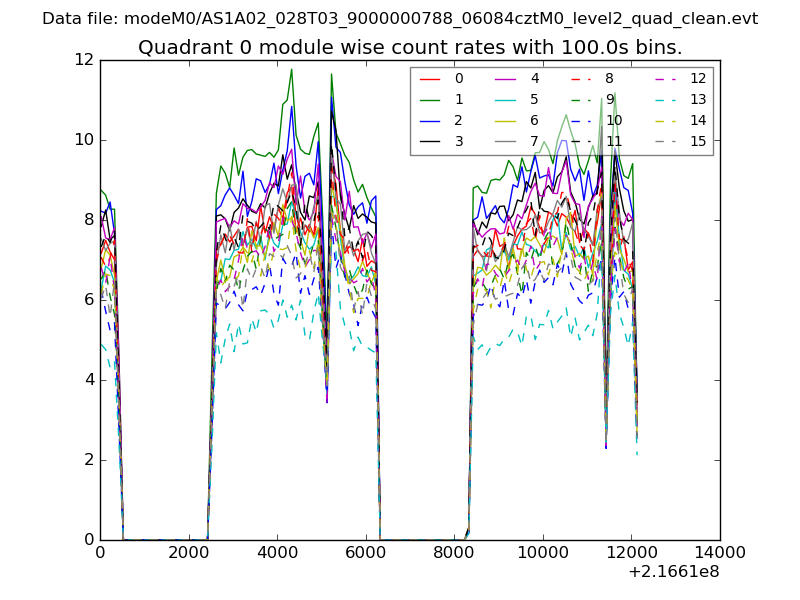 |
 |
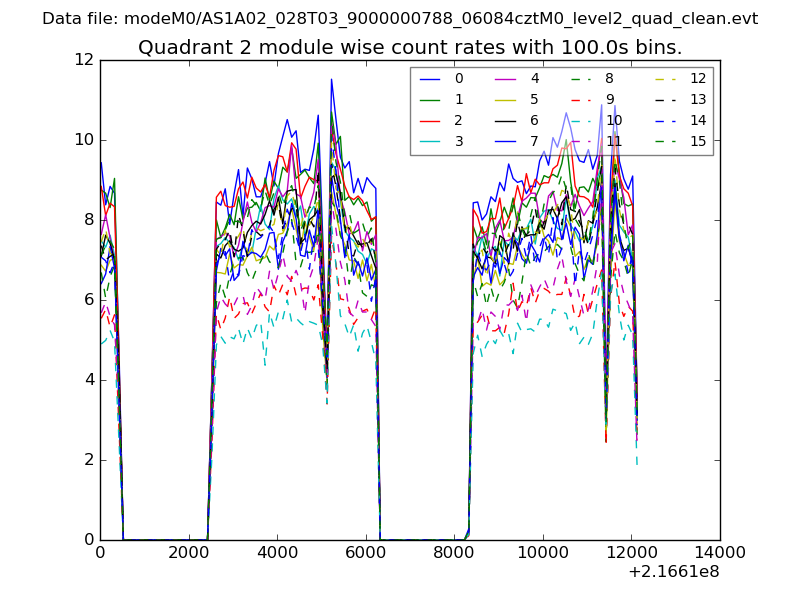
| Module-wise count rates for Quadrant B Data is divided into 100 sec bins |
 |
 |
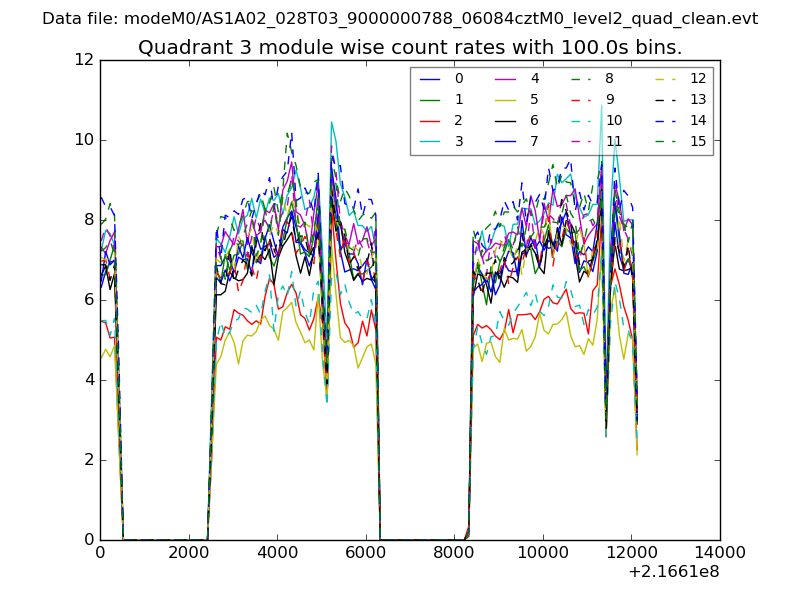
| Module-wise count rates for Quadrant C Data is divided into 100 sec bins |
 |
 |
| Module-wise count rates for Quadrant D Data is divided into 100 sec bins |
 |
 |
| Parameter | Plot |
|---|---|
| CZT HV Monitor | 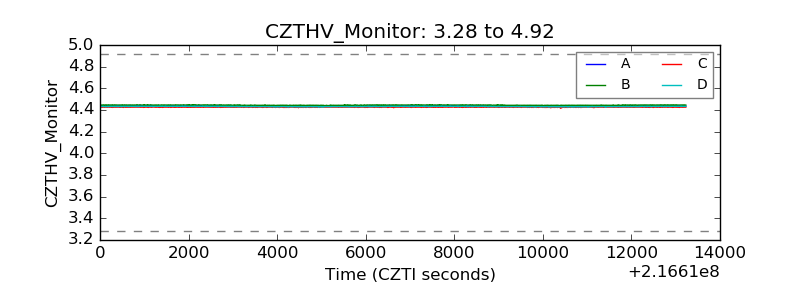 |
| D_VDD | 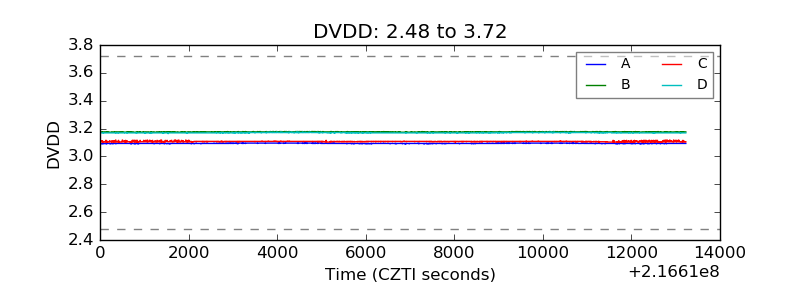 |
| Temperature 1 | 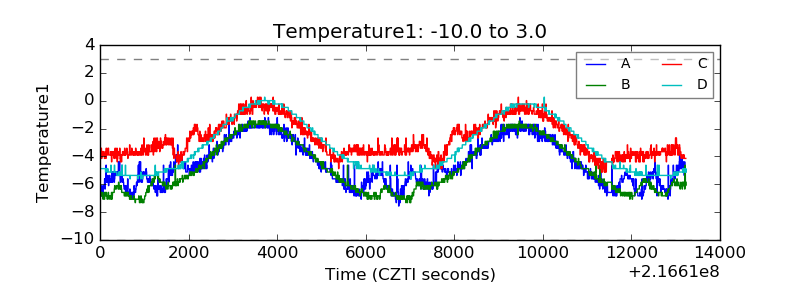 |
| Veto HV Monitor | 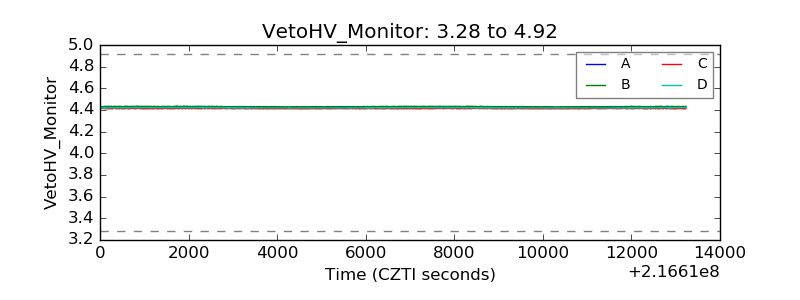 |
| Veto LLD | 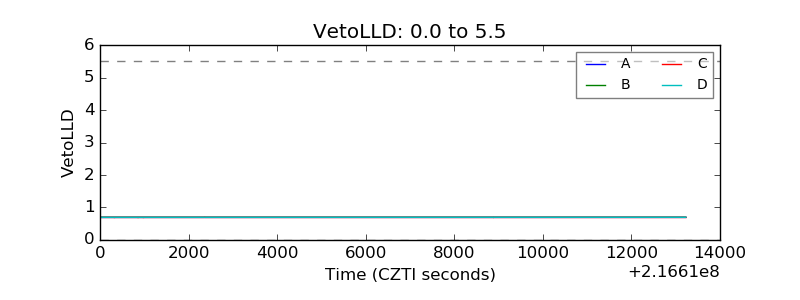 |
| Alpha Counter | 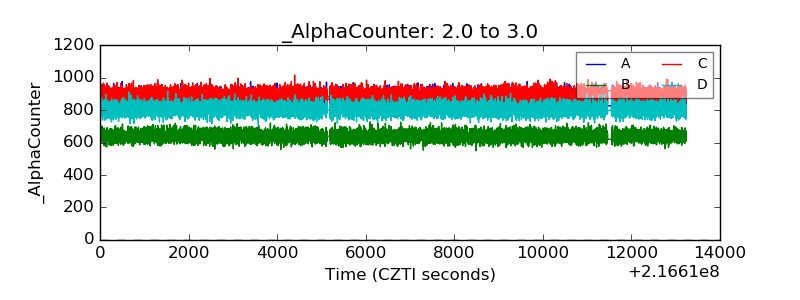 |
| _CPM_Rate |  |
| CZT Counter | 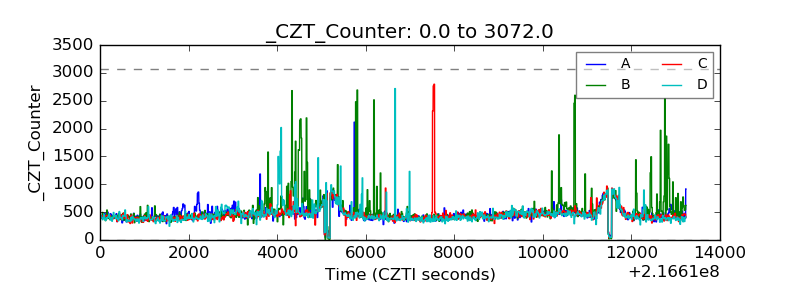 |
| +2.5 Volts monitor |  |
| +5 Volts monitor |  |
| _ROLL_ROT | 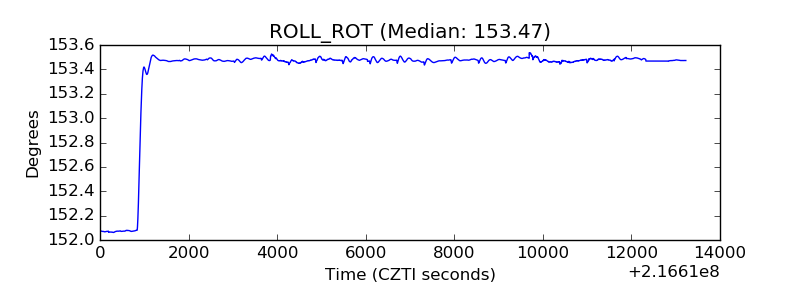 |
| _Roll_DEC | 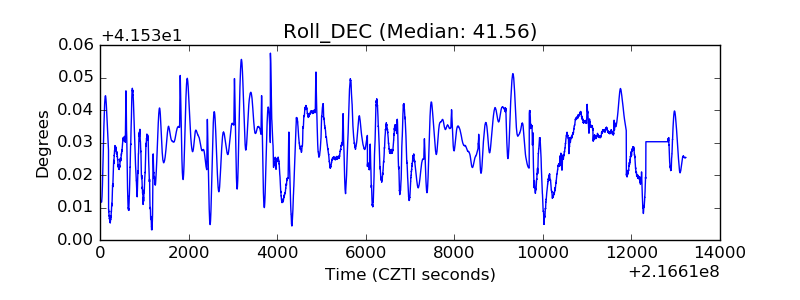 |
| _Roll_RA | 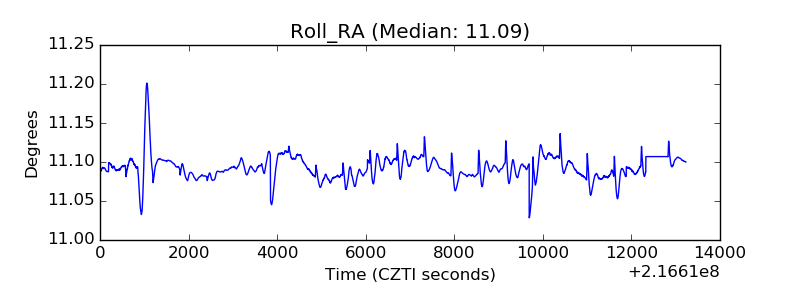 |
| Veto Counter | 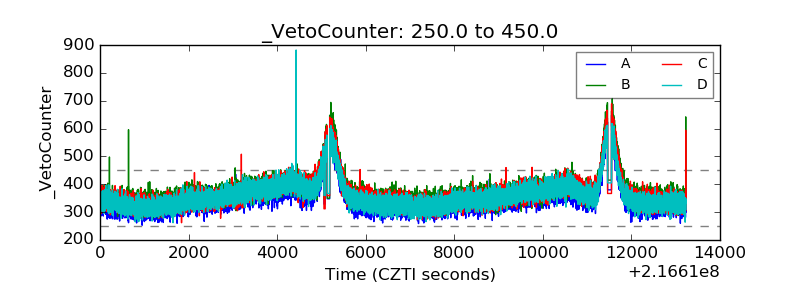 |