| Param | Original file | Final file |
|---|---|---|
| Filename | modeM0/AS1A02_028T03_9000000788_06088cztM0_level2.evt | modeM0/AS1A02_028T03_9000000788_06088cztM0_level2_quad_clean.evt |
| Size (bytes) | 2,463,963,840 | 408,286,080 |
| Size | 2.3 GB | 389.4 MB |
| Events in quadrant A | 16,131,185 | 2,571,641 |
| Events in quadrant B | 20,289,048 | 2,511,412 |
| Events in quadrant C | 14,905,155 | 2,575,639 |
| Events in quadrant D | 21,043,639 | 2,414,310 |
| Mode M0 | |||
|---|---|---|---|
| Quadrant | BADHDUFLAG | Total packets | Discarded packets |
| A | 0 | 70756 | 67 |
| B | 0 | 82850 | 73 |
| C | 0 | 68582 | 55 |
| D | 0 | 86735 | 118 |
| Mode M9 | |||
|---|---|---|---|
| Quadrant | BADHDUFLAG | Total packets | Discarded packets |
| A | 0 | 17 | 0 |
| B | 0 | 17 | 0 |
| C | 0 | 17 | 0 |
| D | 0 | 17 | 0 |
| Mode SS | |||
|---|---|---|---|
| Quadrant | BADHDUFLAG | Total packets | Discarded packets |
| A | 0 | 678 | 0 |
| B | 0 | 678 | 0 |
| C | 0 | 678 | 2 |
| D | 0 | 678 | 0 |
| Quadrant | Total seconds | Saturated seconds | Saturation percentage |
|---|---|---|---|
| A | 33353 | 619 | 1.855905% |
| B | 33352 | 2111 | 6.329456% |
| C | 33359 | 326 | 0.977248% |
| D | 33348 | 1539 | 4.614969% |
Noise dominated data is calculated using 1-second bins in cleaned event files. If a bin has >2000 counts, and if more than 50% of those come from <1% of pixels, then it is considered to be noise-dominated and hence unusable.
| Quadrant | # 1 sec bins | Bins with >0 counts | Bins with >2000 counts | High rate bins dominated by noise | Noise dominated (total time) | Noise dominated (detector-on time) | Marked lightcurve |
|---|---|---|---|---|---|---|---|
| A | 35201 | 33385 | 125 | 125 | 0.36% | 0.37% | 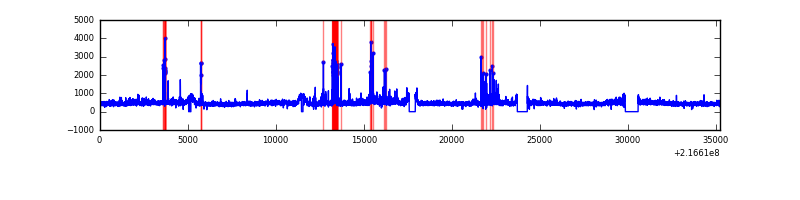 |
| B | 35201 | 33384 | 1021 | 1021 | 2.90% | 3.06% | 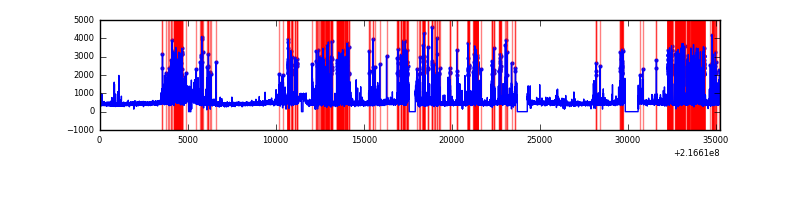 |
| C | 35201 | 33385 | 44 | 44 | 0.12% | 0.13% | 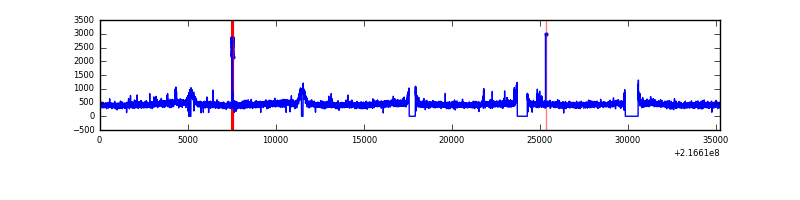 |
| D | 35201 | 33379 | 1198 | 1198 | 3.40% | 3.59% | 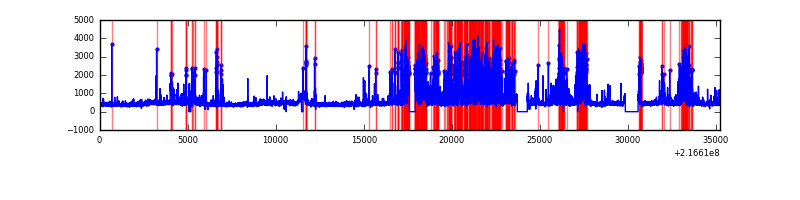 |
Top three noisy pixels from each quadrant. If the there are fewer than three noisy pixels in the level2.evt file, extra rows are filled as -1
| Pixel properties | Quadrant properties | ||||||
|---|---|---|---|---|---|---|---|
| Quadrant | DetID | PixID | Counts | Sigma | Mean | Median | Sigma |
| A | 8 | 15 | 1009384 | 1294.45 | 3817 | 3723 | 776.9 |
| A | 0 | 31 | 281801 | 357.93 | 3817 | 3723 | 776.9 |
| A | 4 | 2 | 83578 | 102.79 | 3817 | 3723 | 776.9 |
| B | 3 | 64 | 5006458 | 6944.76 | 3776 | 3680 | 720.4 |
| B | 4 | 81 | 276620 | 378.89 | 3776 | 3680 | 720.4 |
| B | 0 | 219 | 170616 | 231.74 | 3776 | 3680 | 720.4 |
| C | 9 | 54 | 225634 | 256.7 | 3729 | 3736 | 864.4 |
| C | 1 | 16 | 107666 | 120.23 | 3729 | 3736 | 864.4 |
| C | 13 | 61 | 29807 | 30.16 | 3729 | 3736 | 864.4 |
| D | 11 | 241 | 6085461 | 6726.07 | 3683 | 3567 | 904.2 |
| D | 5 | 190 | 224293 | 244.1 | 3683 | 3567 | 904.2 |
| D | 5 | 239 | 177054 | 191.86 | 3683 | 3567 | 904.2 |
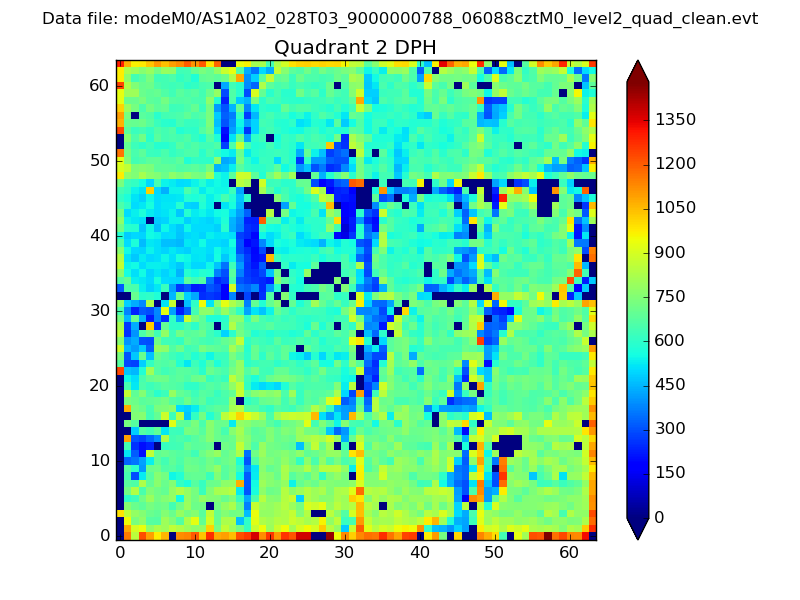
Histogram calculated using DETX and DETY for each event in the final _common_clean file
| Quadrant A | 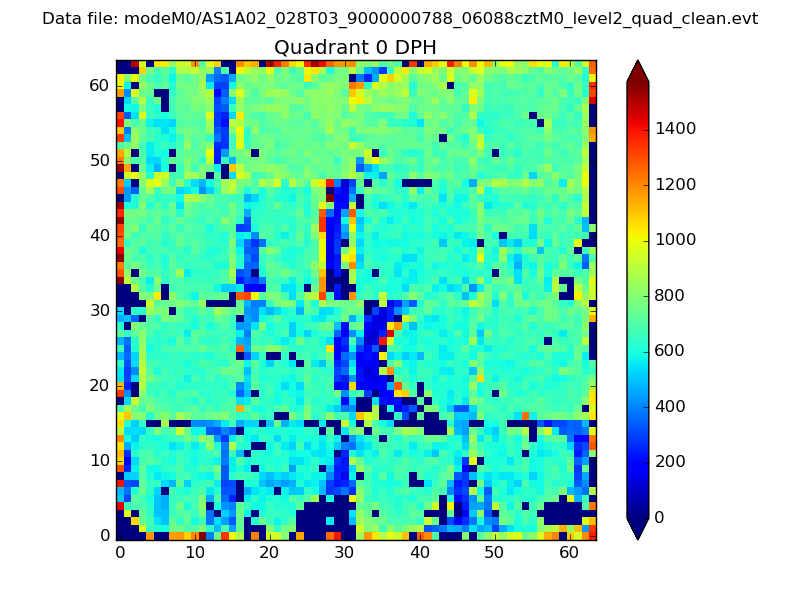 |
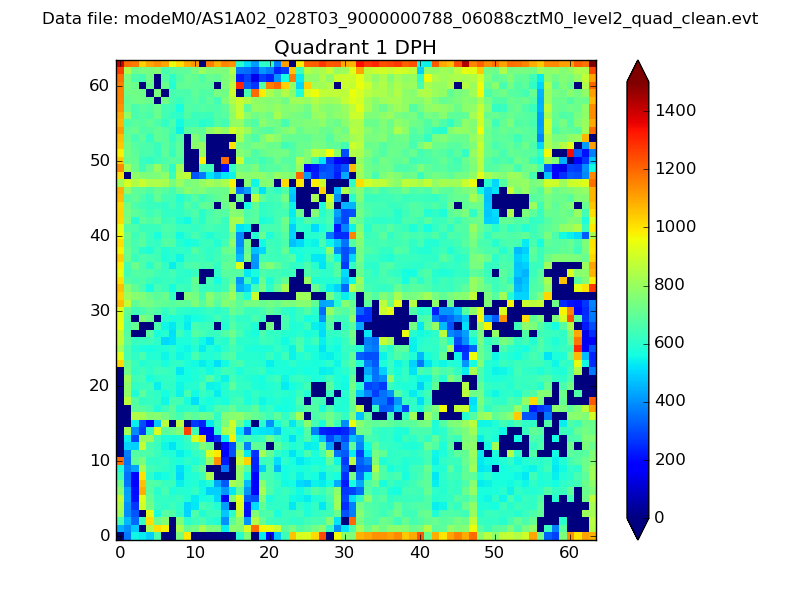 |
Quadrant B |
|---|---|---|---|
| Quadrant D | 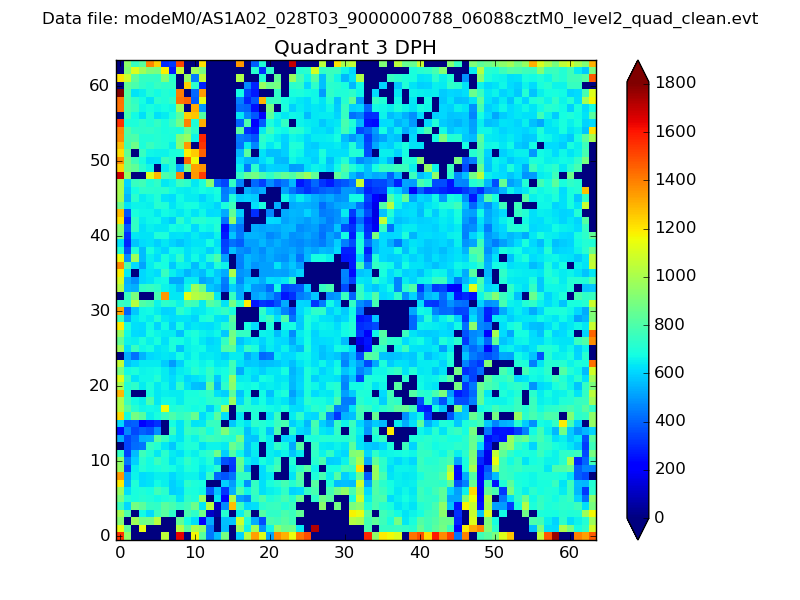 |
 |
Quadrant C |
| Plot type | Count rate plots | Images |
|---|---|---|
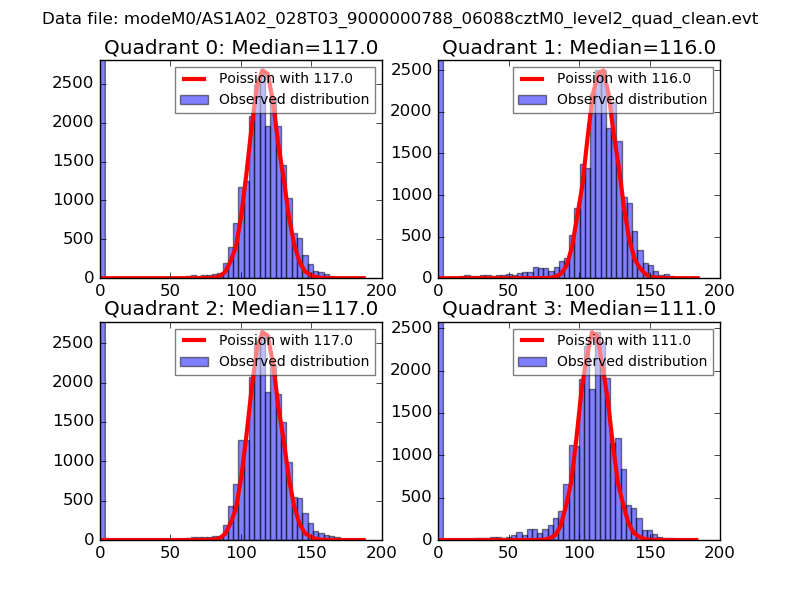
| Comparison with Poisson distribution Blue bars denote a histogram of data divided into 1 sec bins. Red curve is a Poisson curve with rate = median count rate of data. |
 |
 |
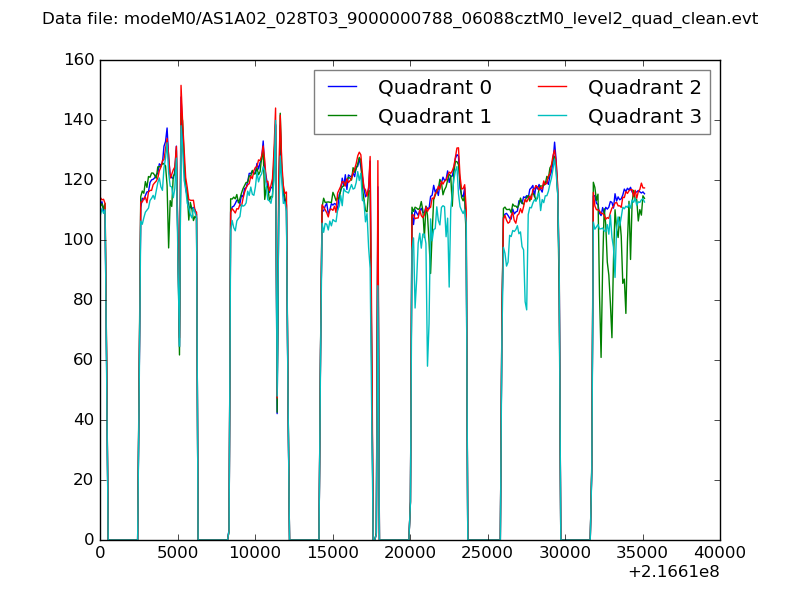
| Quadrant-wise count rates Data is divided into 100 sec bins |
 |
|
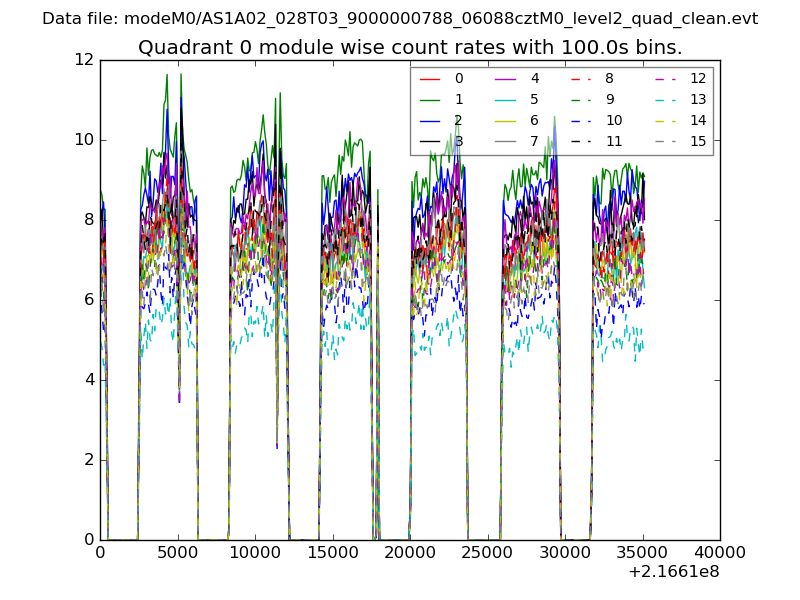
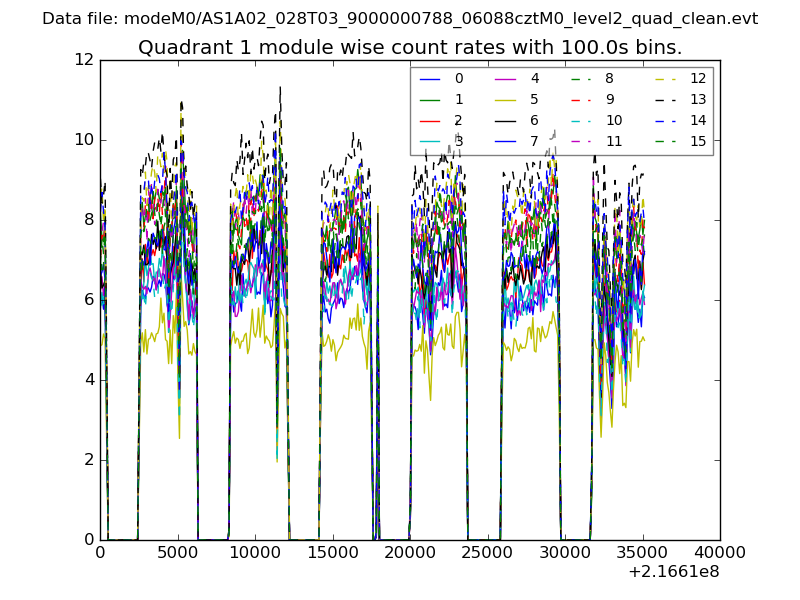
| Module-wise count rates for Quadrant A Data is divided into 100 sec bins |
 |
 |
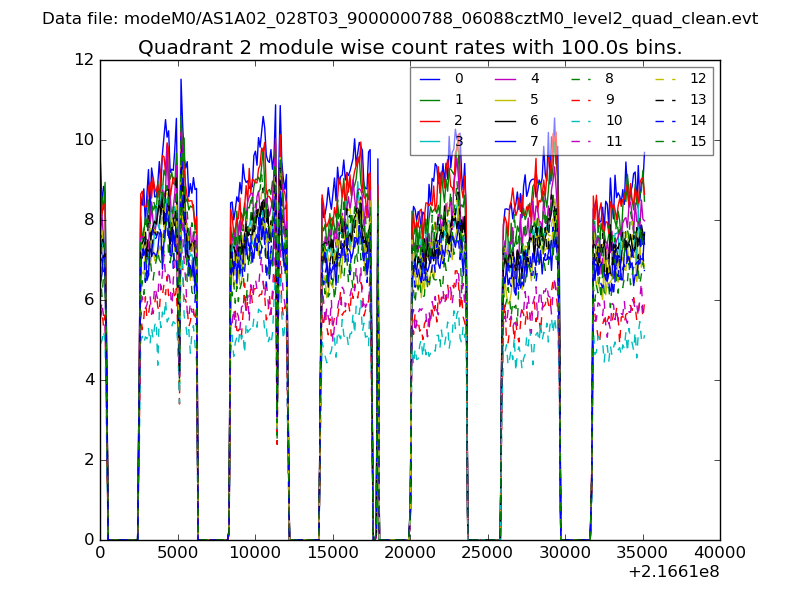
| Module-wise count rates for Quadrant B Data is divided into 100 sec bins |
 |
 |
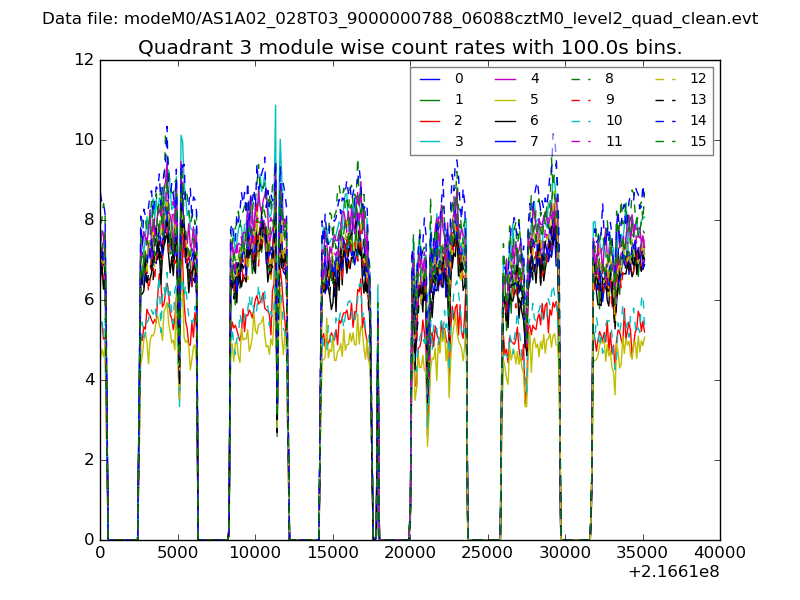
| Module-wise count rates for Quadrant C Data is divided into 100 sec bins |
 |
 |
| Module-wise count rates for Quadrant D Data is divided into 100 sec bins |
 |
 |
| Parameter | Plot |
|---|---|
| CZT HV Monitor | 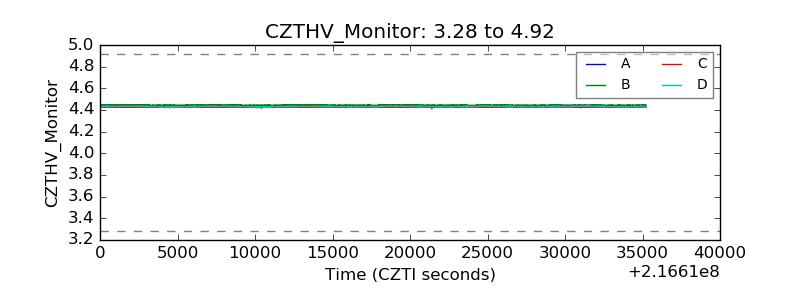 |
| D_VDD | 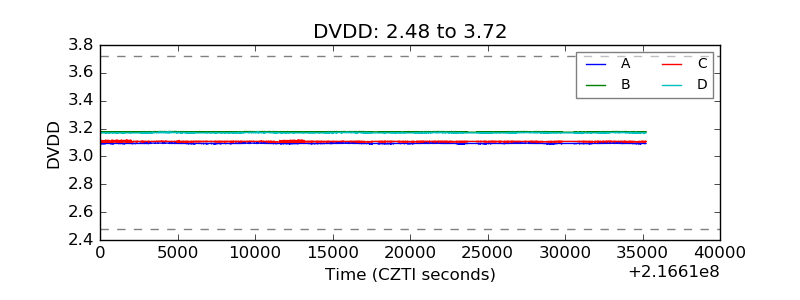 |
| Temperature 1 | 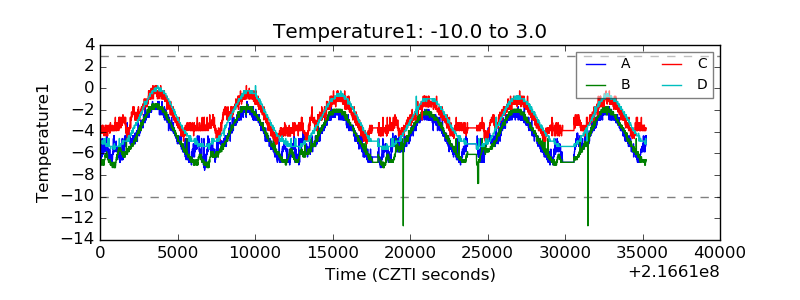 |
| Veto HV Monitor | 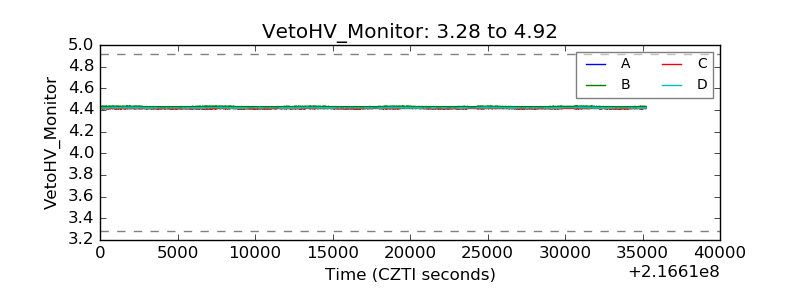 |
| Veto LLD |  |
| Alpha Counter | 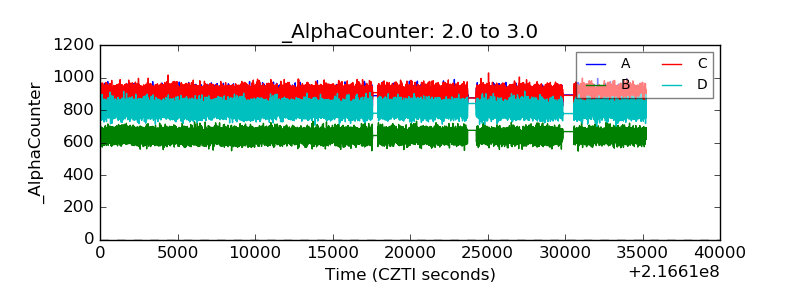 |
| _CPM_Rate | 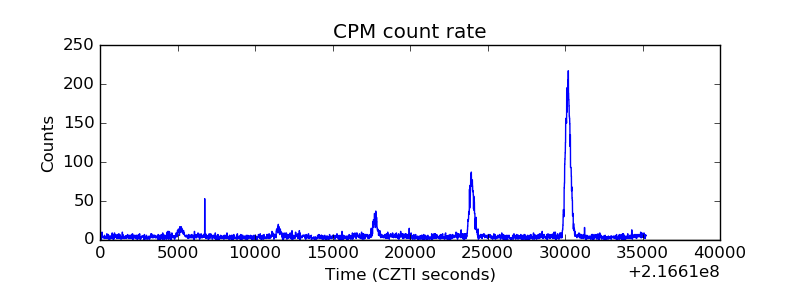 |
| CZT Counter |  |
| +2.5 Volts monitor |  |
| +5 Volts monitor |  |
| _ROLL_ROT | 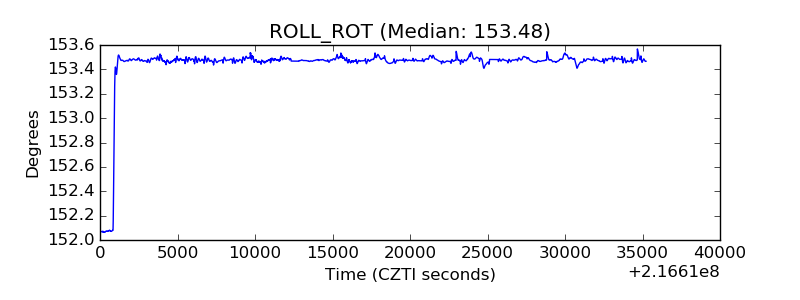 |
| _Roll_DEC | 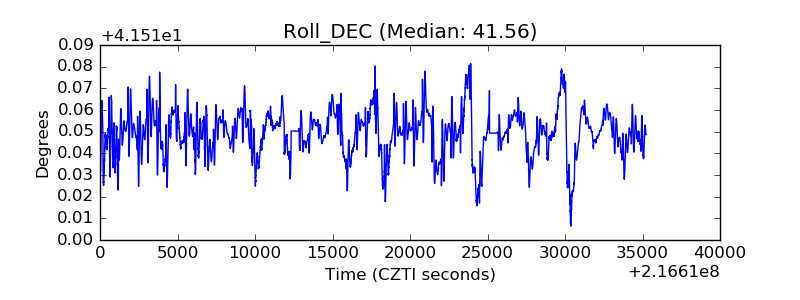 |
| _Roll_RA | 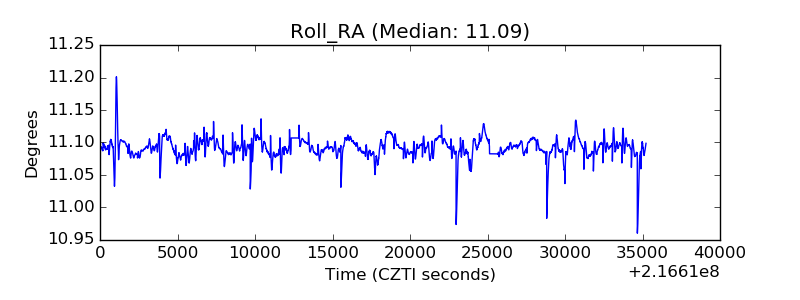 |
| Veto Counter | 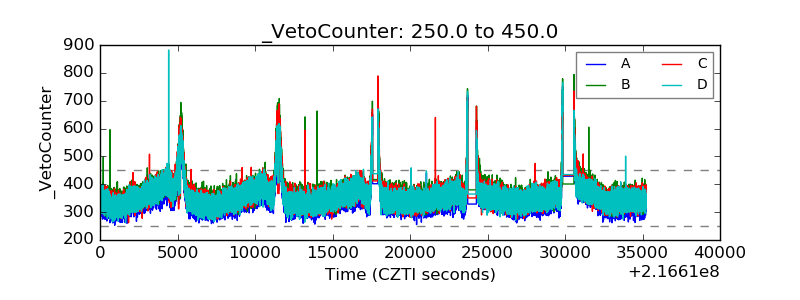 |