| Param | Original file | Final file |
|---|---|---|
| Filename | modeM0/AS1G06_132T01_9000000784cztM0_level2.fits | modeM0/AS1G06_132T01_9000000784cztM0_level2_quad_clean.evt |
| Size (bytes) | 119,540,160 | 147,818,880 |
| Size | 114.0 MB | 141.0 MB |
| Events in quadrant A | 698,276 | 911,020 |
| Events in quadrant B | 679,874 | 914,649 |
| Events in quadrant C | 692,524 | 883,235 |
| Events in quadrant D | 594,736 | 814,063 |
| Mode M0 | |||
|---|---|---|---|
| Quadrant | BADHDUFLAG | Total packets | Discarded packets |
| A | 0 | 29807 | 0 |
| B | 0 | 29415 | 0 |
| C | 0 | 27627 | 0 |
| D | 0 | 29507 | 0 |
| Mode SS | |||
|---|---|---|---|
| Quadrant | BADHDUFLAG | Total packets | Discarded packets |
| A | 0 | 348 | 0 |
| B | 0 | 278 | 0 |
| C | 0 | 333 | 0 |
| D | 0 | 340 | 0 |
| Mode M9 | |||
|---|---|---|---|
| Quadrant | BADHDUFLAG | Total packets | Discarded packets |
| A | 1 | 140028700047400 | 140024523784238 |
| B | 1 | 140028700047400 | 140024523784238 |
| C | 1 | 140028700047400 | 140024523784238 |
| D | 1 | 140028700047400 | 140024523784238 |
| Quadrant | Total seconds | Saturated seconds | Saturation percentage |
|---|---|---|---|
| A | 13658 | 248 | 1.815786% |
| B | 13675 | 242 | 1.769653% |
| C | 13636 | 126 | 0.924025% |
| D | 13646 | 293 | 2.147149% |
Noise dominated data is calculated using 1-second bins in cleaned event files. If a bin has >2000 counts, and if more than 50% of those come from <1% of pixels, then it is considered to be noise-dominated and hence unusable.
| Quadrant | # 1 sec bins | Bins with >0 counts | Bins with >2000 counts | High rate bins dominated by noise | Noise dominated (total time) | Noise dominated (detector-on time) | Marked lightcurve |
|---|---|---|---|---|---|---|---|
| A | 22575 | 14530 | 0 | 0 | 0.00% | 0.00% |  |
| B | 22576 | 14488 | 0 | 0 | 0.00% | 0.00% |  |
| C | 22577 | 14430 | 0 | 0 | 0.00% | 0.00% |  |
| D | 22577 | 14423 | 0 | 0 | 0.00% | 0.00% |  |
Top three noisy pixels from each quadrant. If the there are fewer than three noisy pixels in the level2.evt file, extra rows are filled as -1
| Pixel properties | Quadrant properties | ||||||
|---|---|---|---|---|---|---|---|
| Quadrant | DetID | PixID | Counts | Sigma | Mean | Median | Sigma |
| A | 14 | 188 | 691 | 10.74 | 181 | 169 | 48.6 |
| A | 0 | 29 | 657 | 10.04 | 181 | 169 | 48.6 |
| A | 7 | 110 | 603 | 8.93 | 181 | 169 | 48.6 |
| B | 2 | 9 | 598 | 11.26 | 178 | 170 | 38.0 |
| B | 12 | 226 | 550 | 9.99 | 178 | 170 | 38.0 |
| B | 14 | 254 | 518 | 9.15 | 178 | 170 | 38.0 |
| C | 1 | 80 | 547 | 7.59 | 182 | 167 | 50.1 |
| C | 1 | 81 | 520 | 7.05 | 182 | 167 | 50.1 |
| C | 3 | 126 | 506 | 6.77 | 182 | 167 | 50.1 |
| D | 7 | 5 | 469 | 6.59 | 169 | 153 | 48.0 |
| D | 3 | 14 | 469 | 6.59 | 169 | 153 | 48.0 |
| D | 6 | 231 | 437 | 5.92 | 169 | 153 | 48.0 |
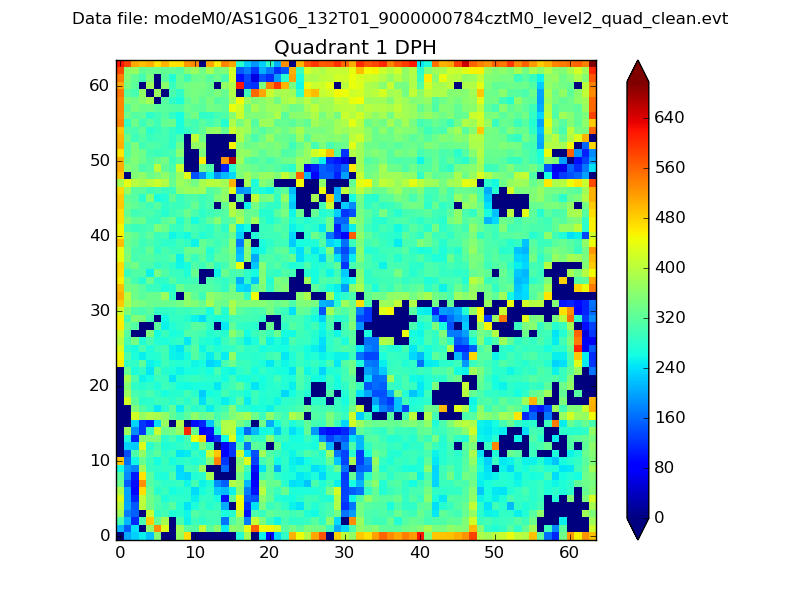
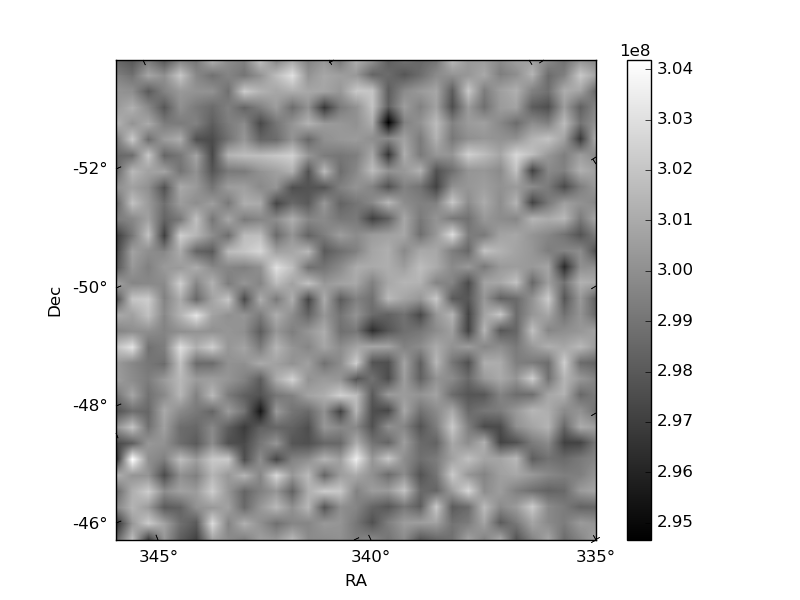
Histogram calculated using DETX and DETY for each event in the final _common_clean file
| Quadrant A |  |
 |
Quadrant B |
|---|---|---|---|
| Quadrant D | 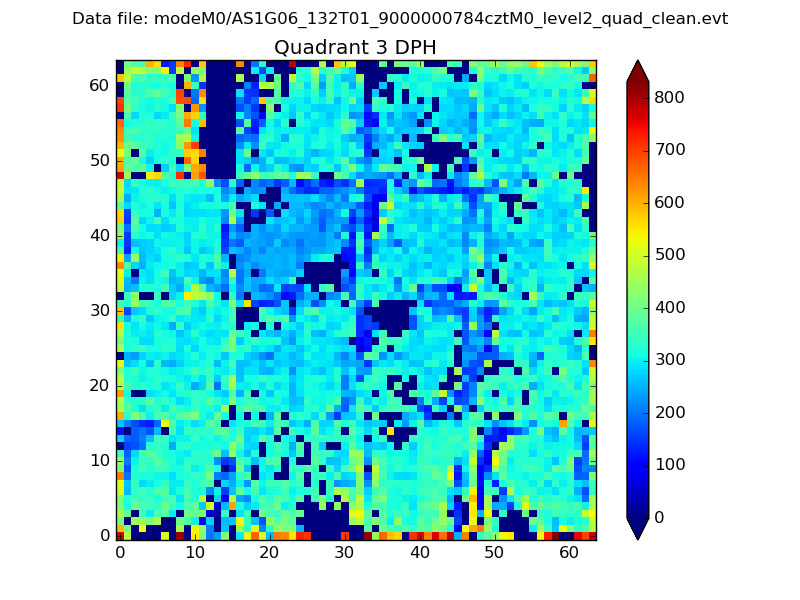 |
 |
Quadrant C |
| Plot type | Count rate plots | Images |
|---|---|---|
| Comparison with Poisson distribution Blue bars denote a histogram of data divided into 1 sec bins. Red curve is a Poisson curve with rate = median count rate of data. |
 |
 |
| Quadrant-wise count rates Data is divided into 100 sec bins |
 |
|
| Module-wise count rates for Quadrant A Data is divided into 100 sec bins |
 |
 |
| Module-wise count rates for Quadrant B Data is divided into 100 sec bins |
 |
 |
| Module-wise count rates for Quadrant C Data is divided into 100 sec bins |
 |
 |
| Module-wise count rates for Quadrant D Data is divided into 100 sec bins |
 |
 |
| Parameter | Plot |
|---|---|
| CZT HV Monitor |  |
| D_VDD | 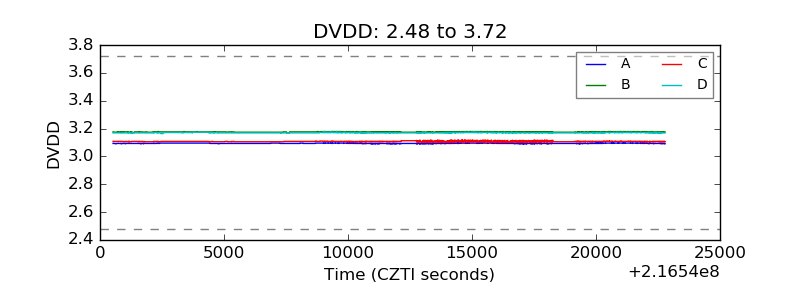 |
| Temperature 1 |  |
| Veto HV Monitor |  |
| Veto LLD |  |
| Alpha Counter |  |
| _CPM_Rate |  |
| CZT Counter |  |
| +2.5 Volts monitor |  |
| +5 Volts monitor |  |
| _ROLL_ROT |  |
| _Roll_DEC |  |
| _Roll_RA |  |
| Veto Counter |  |