| Param | Original file | Final file |
|---|---|---|
| Filename | modeM0/AS1G06_132T01_9000000784_06074cztM0_level2.evt | modeM0/AS1G06_132T01_9000000784_06074cztM0_level2_quad_clean.evt |
| Size (bytes) | 452,721,600 | 100,336,320 |
| Size | 431.7 MB | 95.7 MB |
| Events in quadrant A | 3,668,158 | 644,845 |
| Events in quadrant B | 3,367,160 | 652,306 |
| Events in quadrant C | 2,882,127 | 650,352 |
| Events in quadrant D | 3,327,015 | 614,014 |
| Mode M0 | |||
|---|---|---|---|
| Quadrant | BADHDUFLAG | Total packets | Discarded packets |
| A | 0 | 16573 | 652 |
| B | 0 | 15284 | 607 |
| C | 0 | 14476 | 567 |
| D | 0 | 15784 | 710 |
| Mode SS | |||
|---|---|---|---|
| Quadrant | BADHDUFLAG | Total packets | Discarded packets |
| A | 0 | 144 | 6 |
| B | 0 | 144 | 2 |
| C | 0 | 144 | 8 |
| D | 0 | 144 | 10 |
| Mode M9 | |||
|---|---|---|---|
| Quadrant | BADHDUFLAG | Total packets | Discarded packets |
| A | 0 | 9 | 0 |
| B | 0 | 9 | 0 |
| C | 0 | 9 | 0 |
| D | 0 | 9 | 0 |
| Quadrant | Total seconds | Saturated seconds | Saturation percentage |
|---|---|---|---|
| A | 6844 | 129 | 1.884863% |
| B | 6856 | 105 | 1.531505% |
| C | 6868 | 51 | 0.742574% |
| D | 6826 | 208 | 3.047173% |
Noise dominated data is calculated using 1-second bins in cleaned event files. If a bin has >2000 counts, and if more than 50% of those come from <1% of pixels, then it is considered to be noise-dominated and hence unusable.
| Quadrant | # 1 sec bins | Bins with >0 counts | Bins with >2000 counts | High rate bins dominated by noise | Noise dominated (total time) | Noise dominated (detector-on time) | Marked lightcurve |
|---|---|---|---|---|---|---|---|
| A | 7990 | 7098 | 77 | 77 | 0.96% | 1.08% | 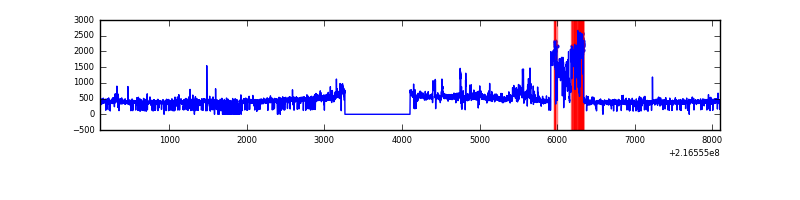 |
| B | 7990 | 7097 | 28 | 28 | 0.35% | 0.39% | 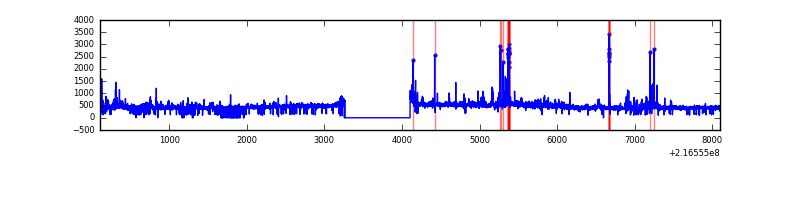 |
| C | 7990 | 7109 | 4 | 4 | 0.05% | 0.06% | 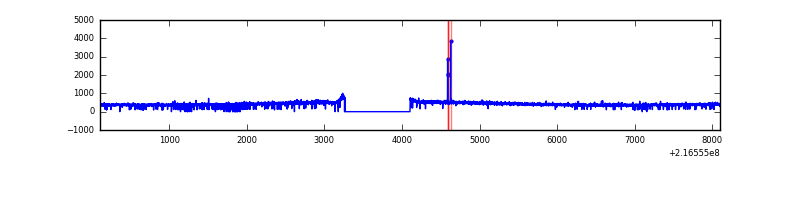 |
| D | 7990 | 7095 | 27 | 27 | 0.34% | 0.38% | 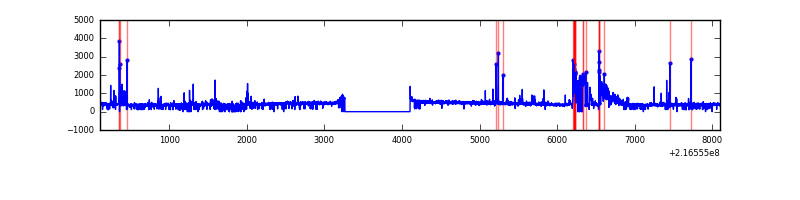 |
Top three noisy pixels from each quadrant. If the there are fewer than three noisy pixels in the level2.evt file, extra rows are filled as -1
| Pixel properties | Quadrant properties | ||||||
|---|---|---|---|---|---|---|---|
| Quadrant | DetID | PixID | Counts | Sigma | Mean | Median | Sigma |
| A | 0 | 31 | 684904 | 4425.11 | 753 | 735 | 154.6 |
| A | 3 | 1 | 25655 | 161.18 | 753 | 735 | 154.6 |
| A | 14 | 111 | 22300 | 139.48 | 753 | 735 | 154.6 |
| B | 3 | 64 | 129069 | 868.27 | 762 | 743 | 147.8 |
| B | 0 | 214 | 79245 | 531.16 | 762 | 743 | 147.8 |
| B | 4 | 81 | 72172 | 483.3 | 762 | 743 | 147.8 |
| C | 9 | 54 | 16011 | 89.37 | 729 | 731 | 171.0 |
| C | 8 | 128 | 7172 | 37.67 | 729 | 731 | 171.0 |
| C | 13 | 61 | 5936 | 30.44 | 729 | 731 | 171.0 |
| D | 13 | 169 | 301561 | 1687.49 | 718 | 695 | 178.3 |
| D | 13 | 61 | 58513 | 324.29 | 718 | 695 | 178.3 |
| D | 13 | 44 | 49616 | 274.39 | 718 | 695 | 178.3 |
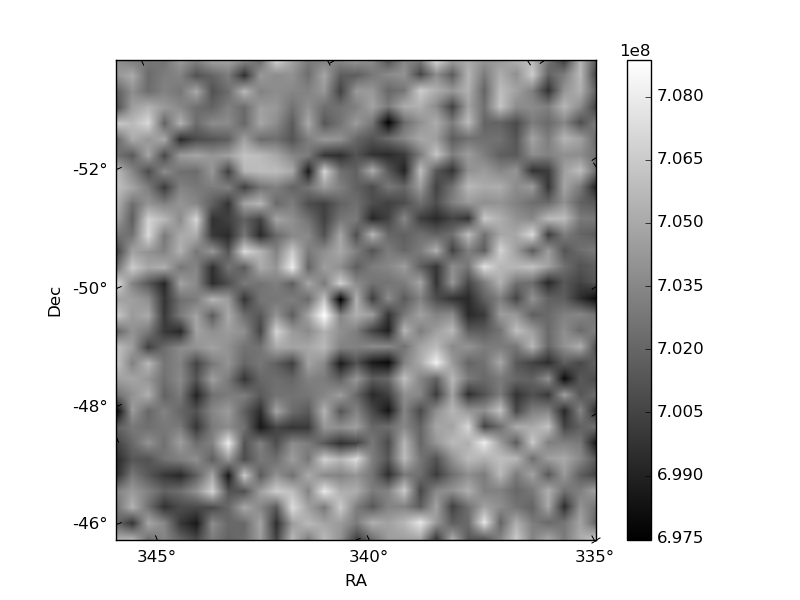
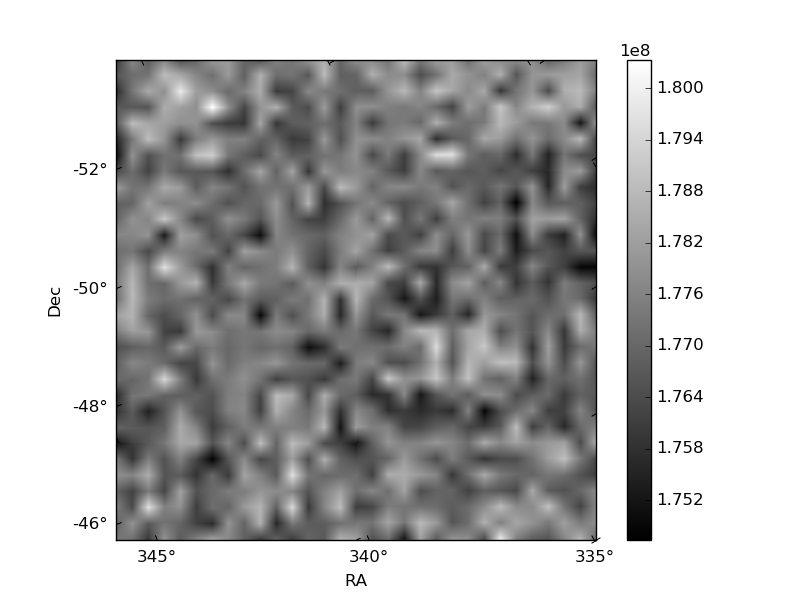
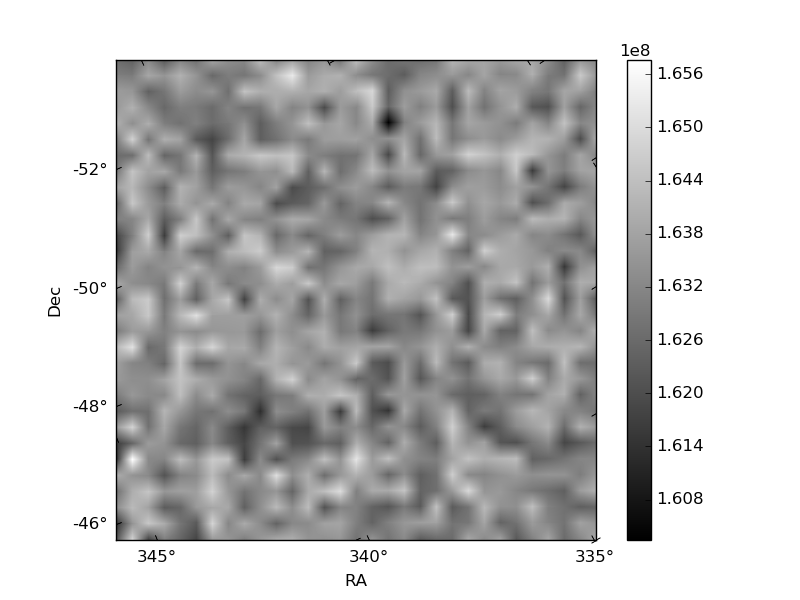
Histogram calculated using DETX and DETY for each event in the final _common_clean file
| Quadrant A | 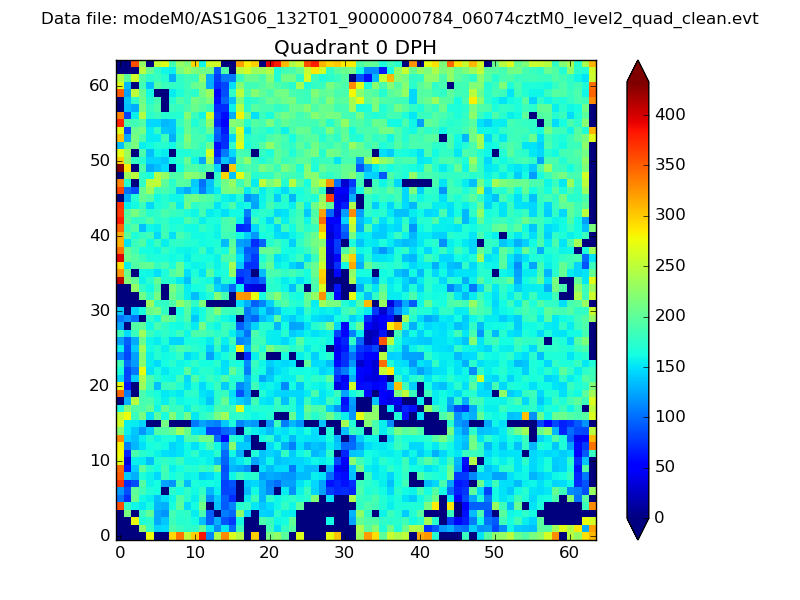 |
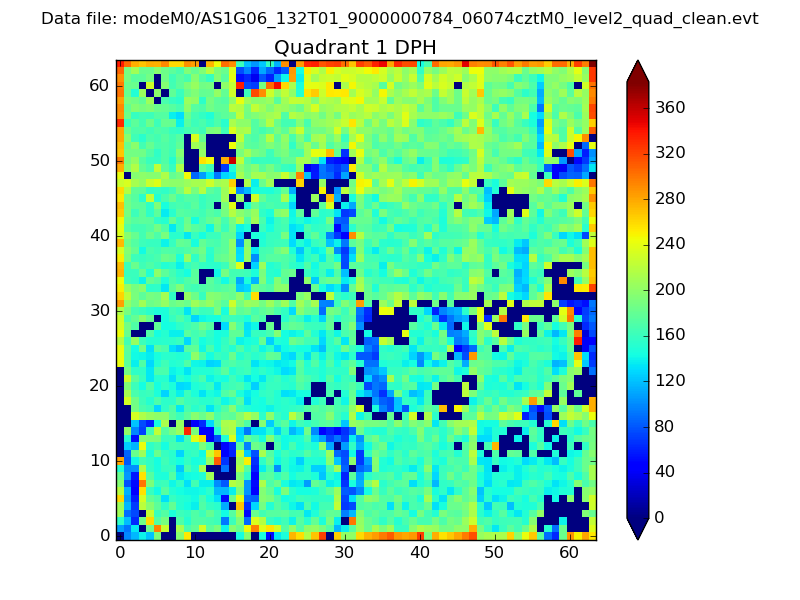 |
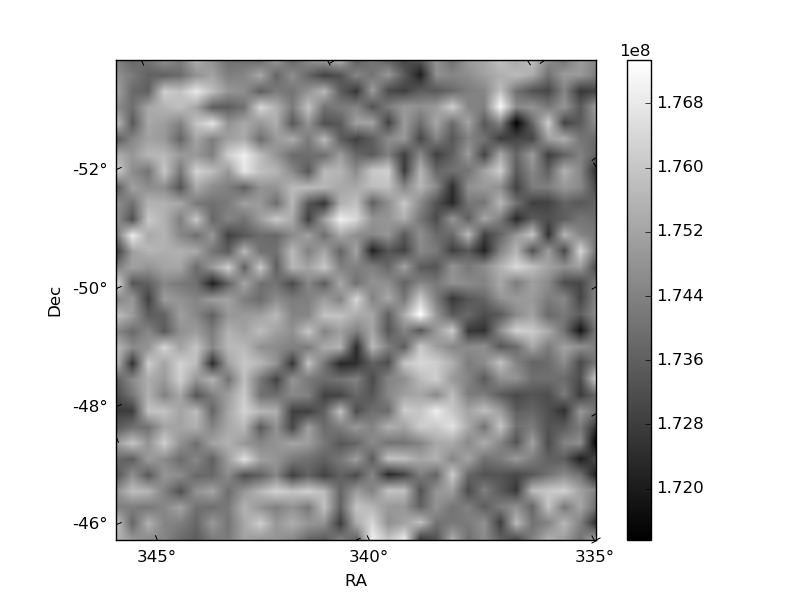
Quadrant B |
|---|---|---|---|
| Quadrant D | 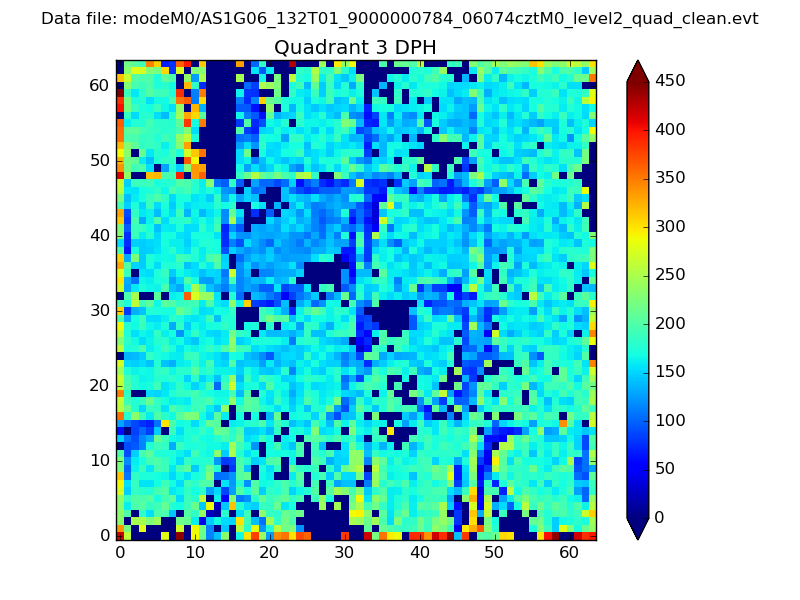 |
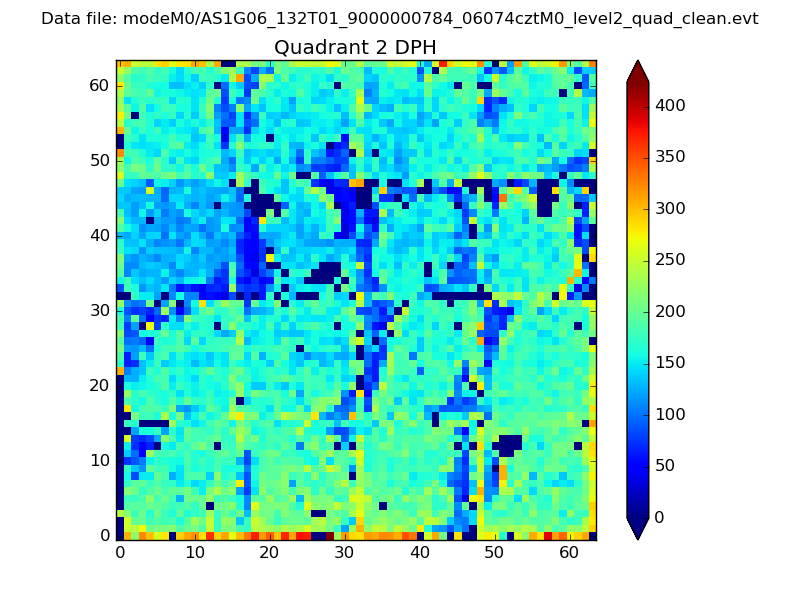 |
Quadrant C |
| Plot type | Count rate plots | Images |
|---|---|---|
| Comparison with Poisson distribution Blue bars denote a histogram of data divided into 1 sec bins. Red curve is a Poisson curve with rate = median count rate of data. |
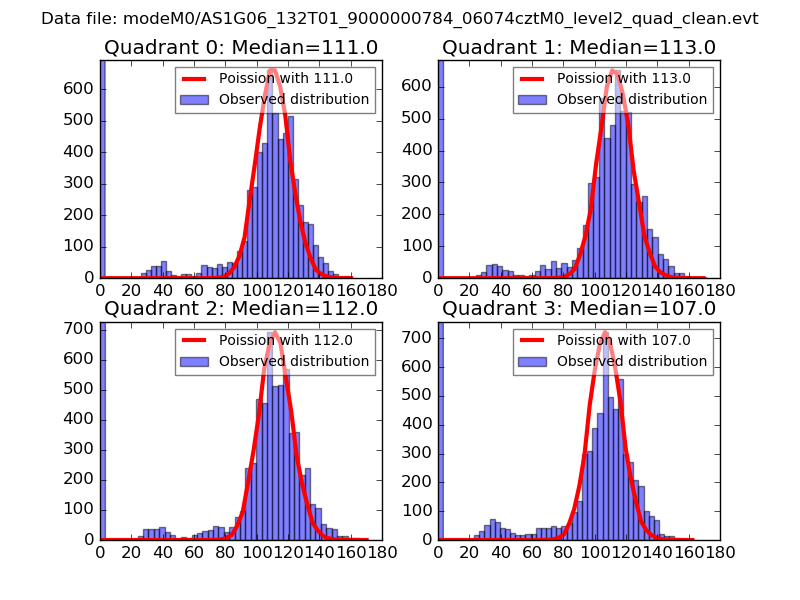 |
 |
| Quadrant-wise count rates Data is divided into 100 sec bins |
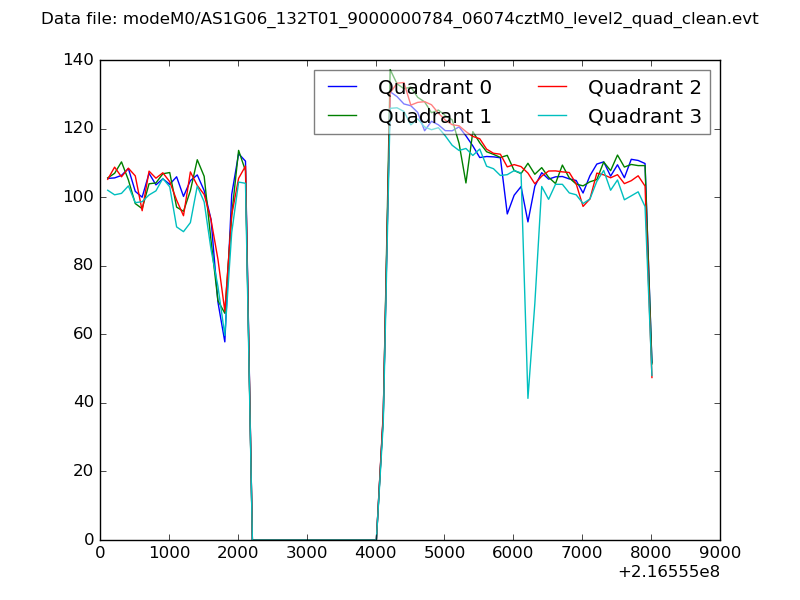 |
|
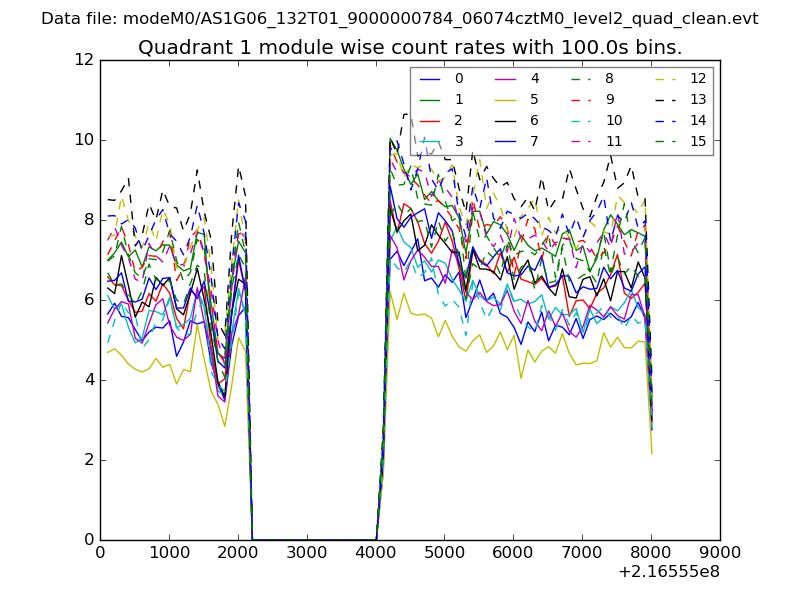
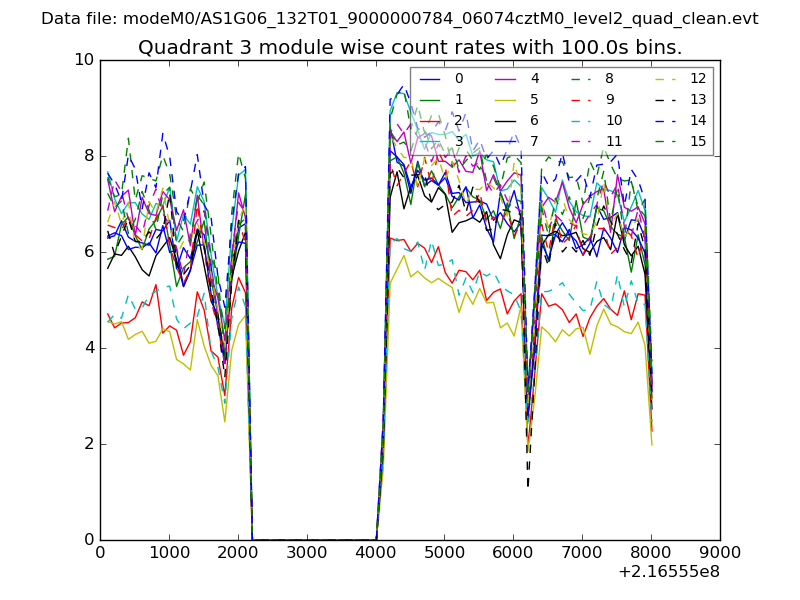
| Module-wise count rates for Quadrant A Data is divided into 100 sec bins |
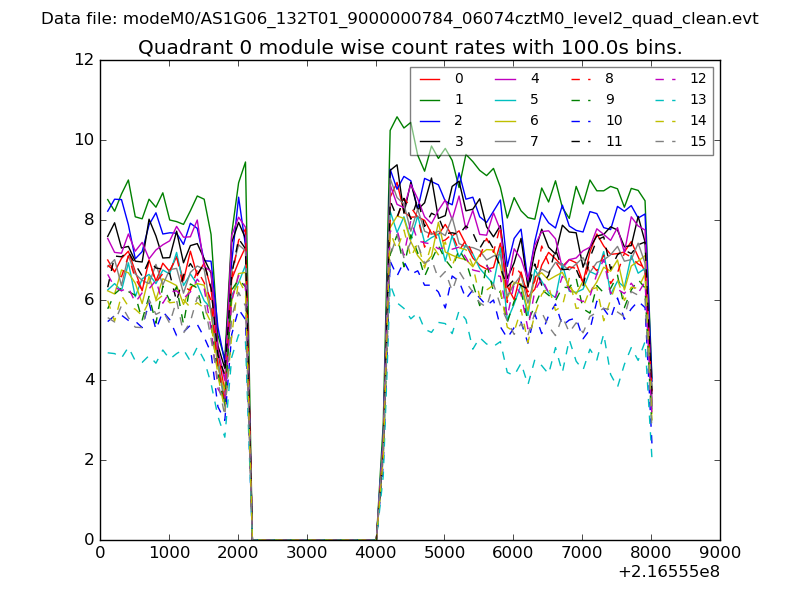 |
 |
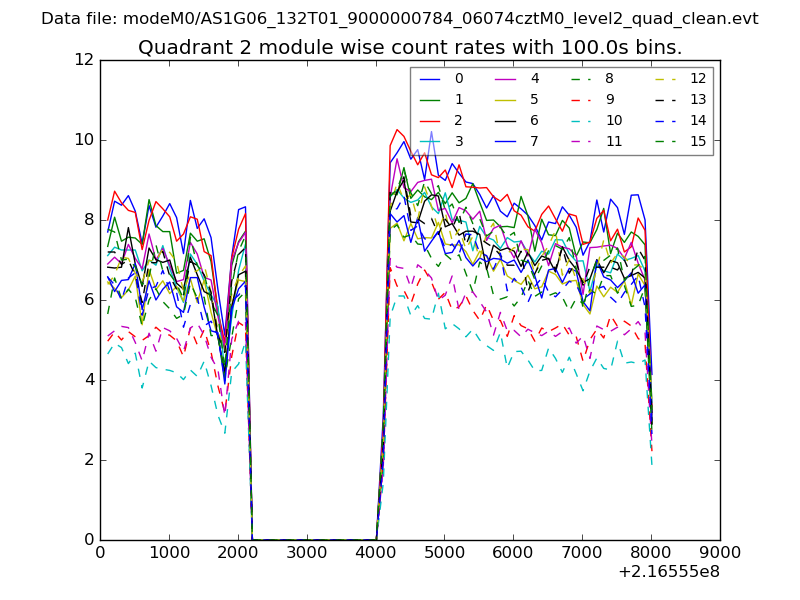
| Module-wise count rates for Quadrant B Data is divided into 100 sec bins |
 |
 |
| Module-wise count rates for Quadrant C Data is divided into 100 sec bins |
 |
 |
| Module-wise count rates for Quadrant D Data is divided into 100 sec bins |
 |
 |
| Parameter | Plot |
|---|---|
| CZT HV Monitor | 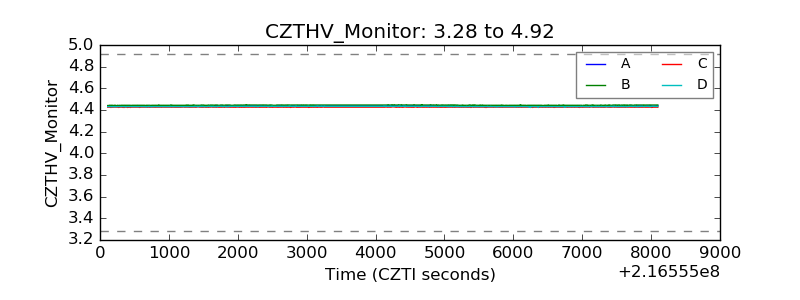 |
| D_VDD | 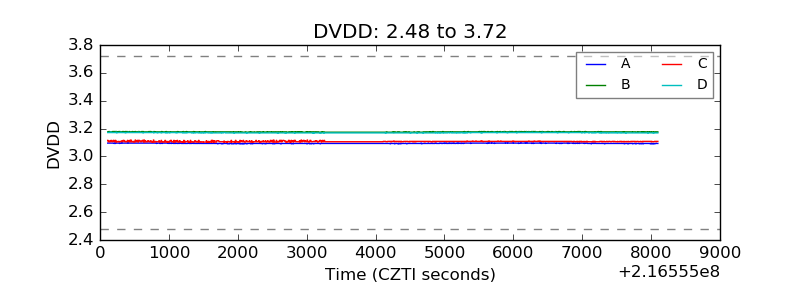 |
| Temperature 1 | 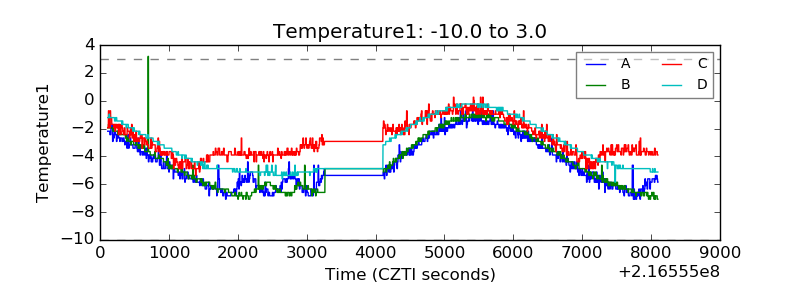 |
| Veto HV Monitor | 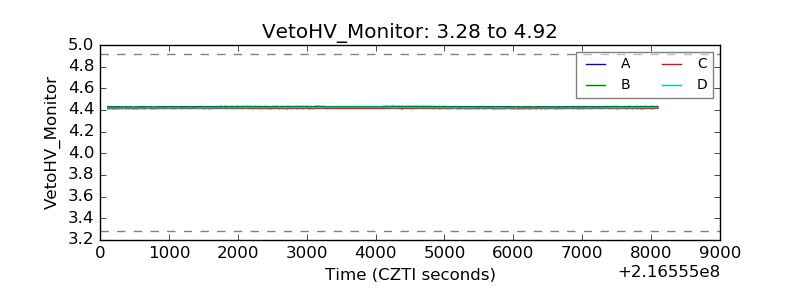 |
| Veto LLD | 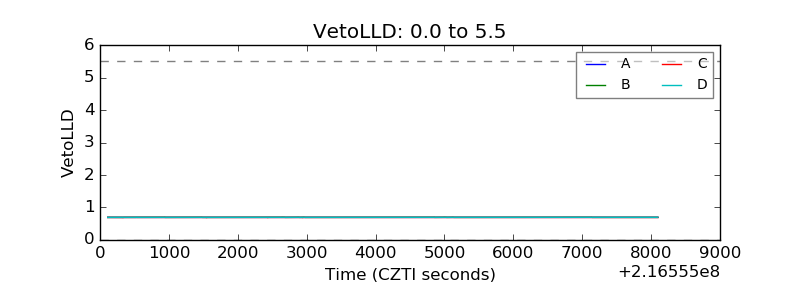 |
| Alpha Counter | 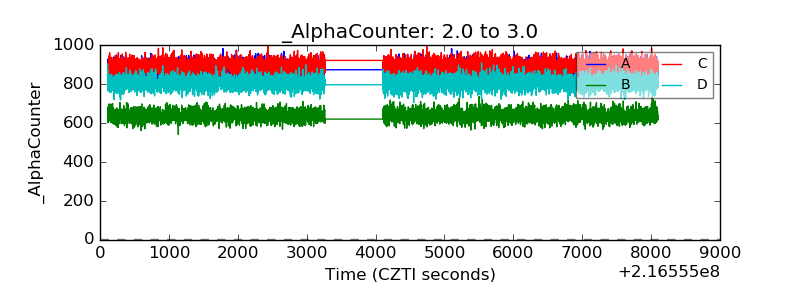 |
| _CPM_Rate | 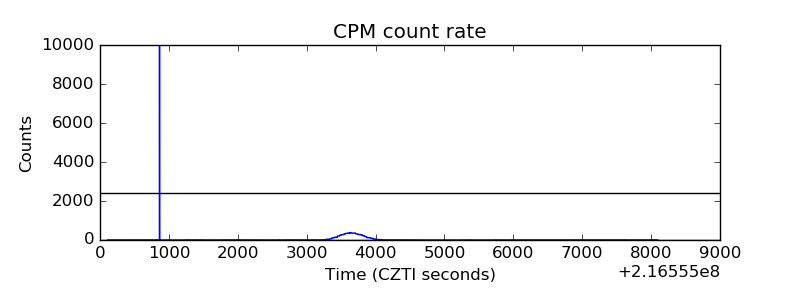 |
| CZT Counter | 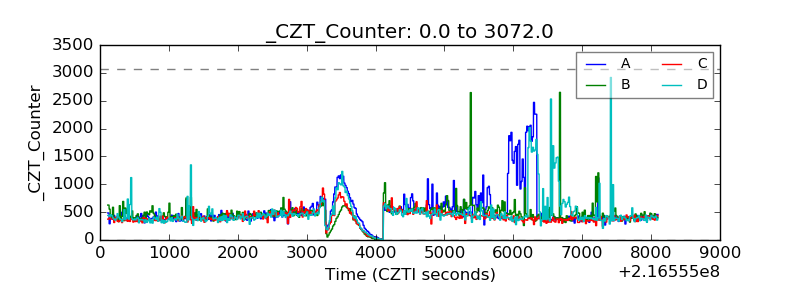 |
| +2.5 Volts monitor |  |
| +5 Volts monitor | 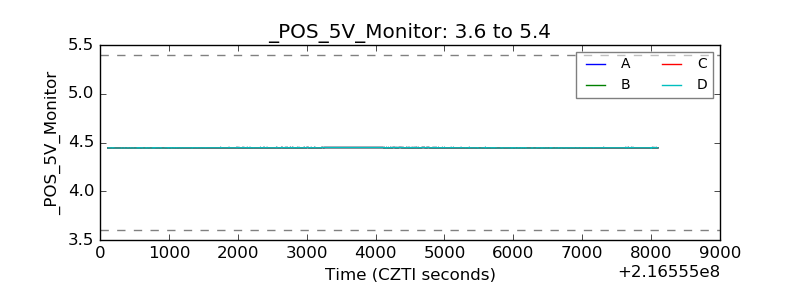 |
| _ROLL_ROT | 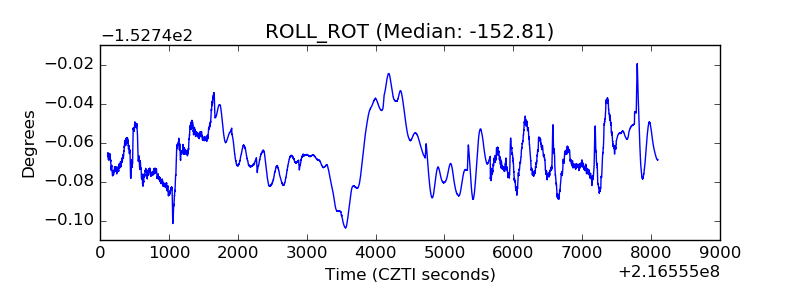 |
| _Roll_DEC | 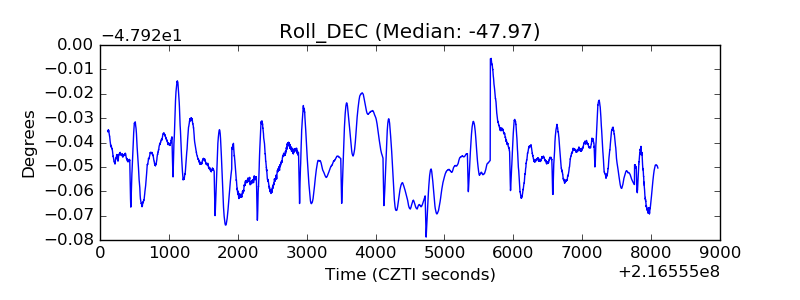 |
| _Roll_RA | 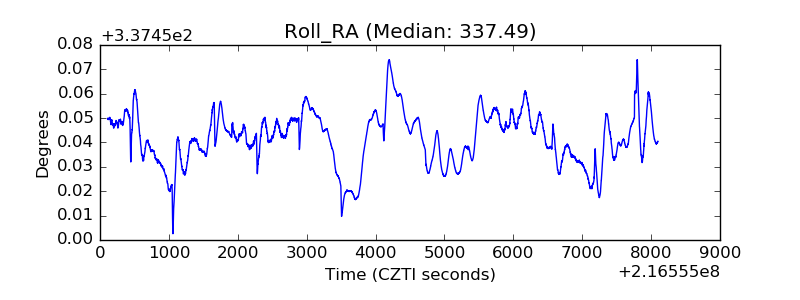 |
| Veto Counter | 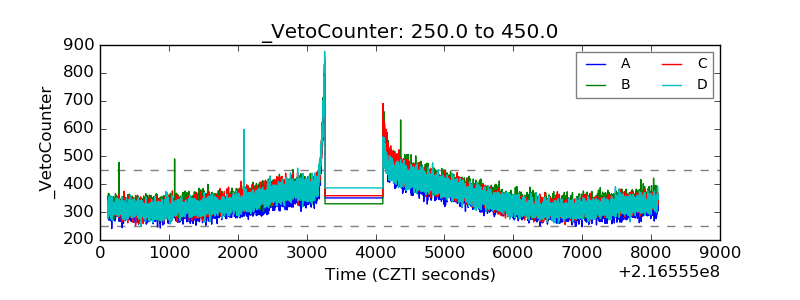 |