| Param | Original file | Final file |
|---|---|---|
| Filename | modeM0/AS1G06_132T01_9000000784_06076cztM0_level2.evt | modeM0/AS1G06_132T01_9000000784_06076cztM0_level2_quad_clean.evt |
| Size (bytes) | 1,324,468,800 | 268,663,680 |
| Size | 1.2 GB | 256.2 MB |
| Events in quadrant A | 9,703,965 | 1,690,102 |
| Events in quadrant B | 10,060,716 | 1,713,502 |
| Events in quadrant C | 8,664,526 | 1,715,445 |
| Events in quadrant D | 10,320,740 | 1,632,959 |
| Mode M0 | |||
|---|---|---|---|
| Quadrant | BADHDUFLAG | Total packets | Discarded packets |
| A | 0 | 43842 | 903 |
| B | 0 | 43704 | 489 |
| C | 0 | 41278 | 440 |
| D | 0 | 45915 | 669 |
| Mode SS | |||
|---|---|---|---|
| Quadrant | BADHDUFLAG | Total packets | Discarded packets |
| A | 0 | 410 | 4 |
| B | 0 | 410 | 4 |
| C | 0 | 410 | 4 |
| D | 0 | 410 | 2 |
| Mode M9 | |||
|---|---|---|---|
| Quadrant | BADHDUFLAG | Total packets | Discarded packets |
| A | 0 | 20 | 0 |
| B | 0 | 20 | 0 |
| C | 0 | 20 | 0 |
| D | 0 | 20 | 0 |
| Quadrant | Total seconds | Saturated seconds | Saturation percentage |
|---|---|---|---|
| A | 20093 | 344 | 1.712039% |
| B | 20135 | 359 | 1.782965% |
| C | 20141 | 206 | 1.022789% |
| D | 20105 | 558 | 2.775429% |
Noise dominated data is calculated using 1-second bins in cleaned event files. If a bin has >2000 counts, and if more than 50% of those come from <1% of pixels, then it is considered to be noise-dominated and hence unusable.
| Quadrant | # 1 sec bins | Bins with >0 counts | Bins with >2000 counts | High rate bins dominated by noise | Noise dominated (total time) | Noise dominated (detector-on time) | Marked lightcurve |
|---|---|---|---|---|---|---|---|
| A | 22261 | 20329 | 67 | 67 | 0.30% | 0.33% | 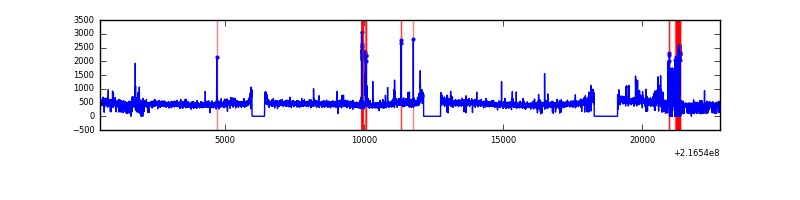 |
| B | 22261 | 20345 | 64 | 64 | 0.29% | 0.31% |  |
| C | 22261 | 20339 | 4 | 4 | 0.02% | 0.02% | 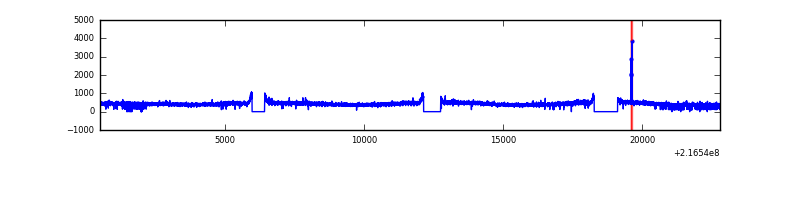 |
| D | 22261 | 20321 | 189 | 189 | 0.85% | 0.93% |  |
Top three noisy pixels from each quadrant. If the there are fewer than three noisy pixels in the level2.evt file, extra rows are filled as -1
| Pixel properties | Quadrant properties | ||||||
|---|---|---|---|---|---|---|---|
| Quadrant | DetID | PixID | Counts | Sigma | Mean | Median | Sigma |
| A | 0 | 31 | 715400 | 1552.89 | 2262 | 2211 | 459.3 |
| A | 8 | 15 | 90326 | 191.86 | 2262 | 2211 | 459.3 |
| A | 14 | 111 | 59907 | 125.63 | 2262 | 2211 | 459.3 |
| B | 3 | 64 | 407165 | 926.67 | 2286 | 2229 | 437.0 |
| B | 0 | 214 | 241206 | 546.89 | 2286 | 2229 | 437.0 |
| B | 4 | 81 | 220180 | 498.77 | 2286 | 2229 | 437.0 |
| C | 9 | 54 | 21317 | 37.38 | 2202 | 2205 | 511.3 |
| C | 13 | 61 | 17573 | 30.05 | 2202 | 2205 | 511.3 |
| C | 8 | 128 | 16239 | 27.45 | 2202 | 2205 | 511.3 |
| D | 13 | 169 | 1484257 | 2745.78 | 2189 | 2122 | 539.8 |
| D | 8 | 195 | 119515 | 217.48 | 2189 | 2122 | 539.8 |
| D | 5 | 97 | 74679 | 134.42 | 2189 | 2122 | 539.8 |
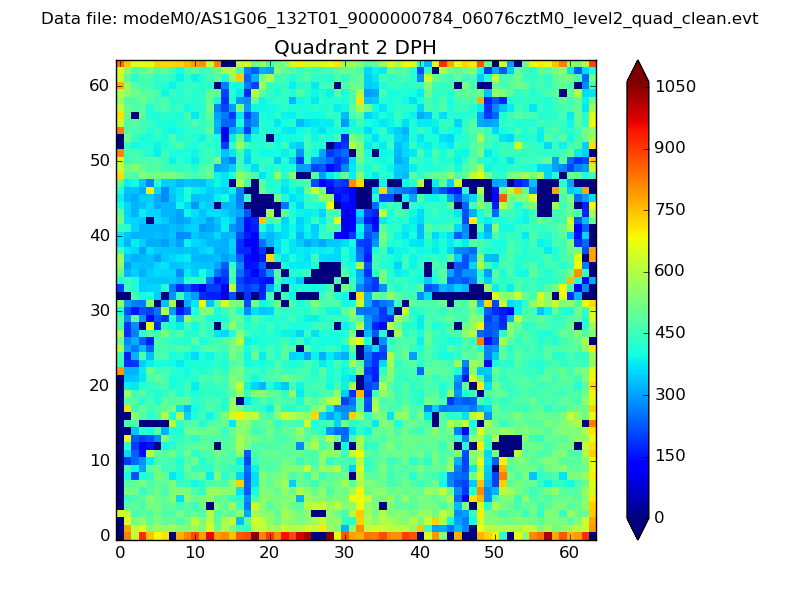
Histogram calculated using DETX and DETY for each event in the final _common_clean file
| Quadrant A | 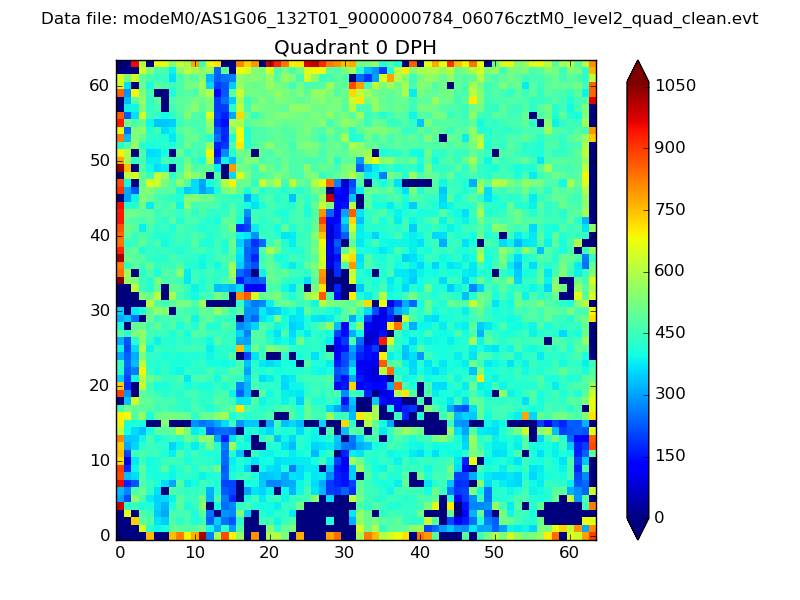 |
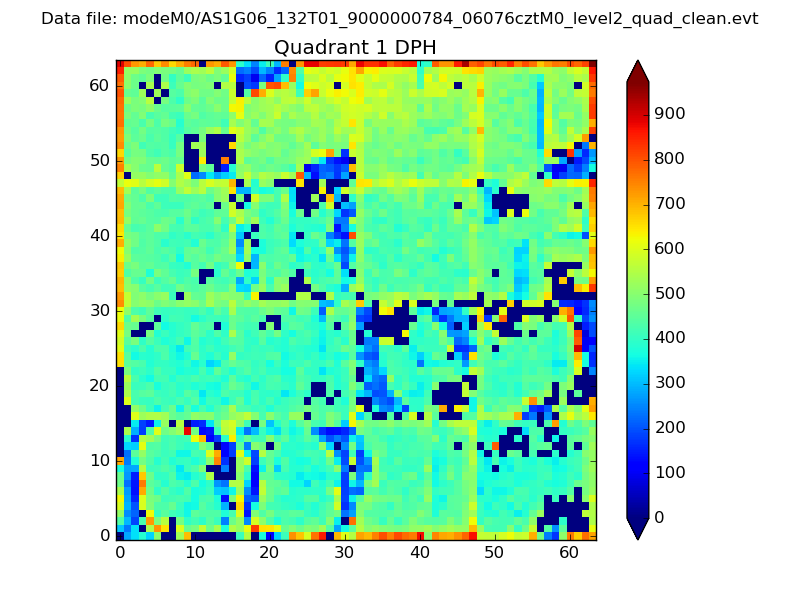 |
Quadrant B |
|---|---|---|---|
| Quadrant D | 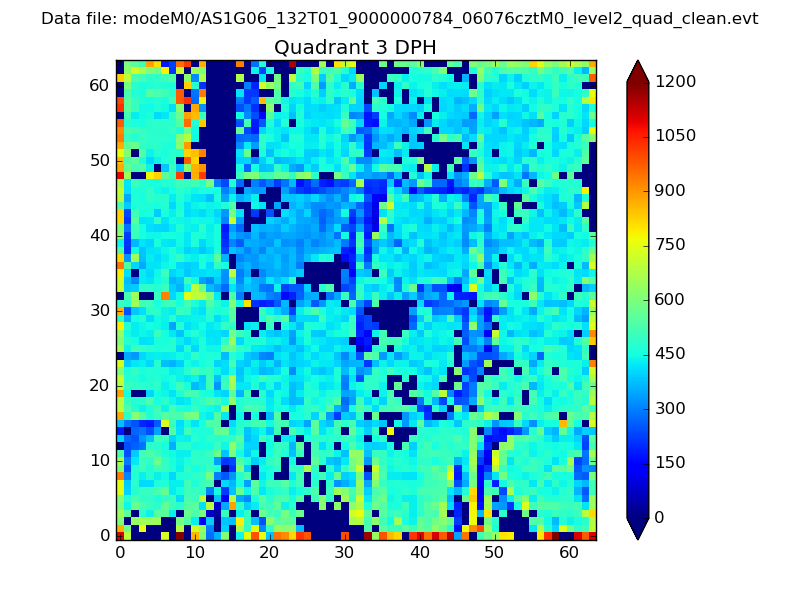 |
 |
Quadrant C |
| Plot type | Count rate plots | Images |
|---|---|---|
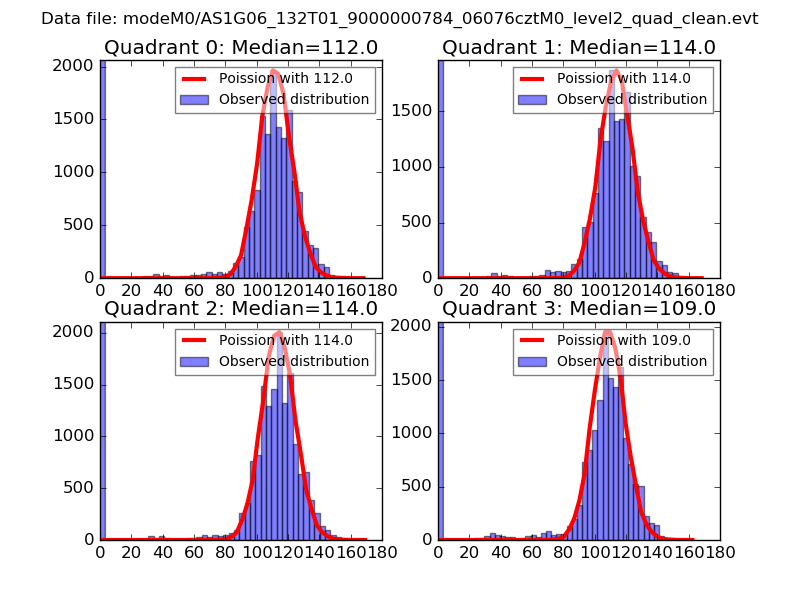
| Comparison with Poisson distribution Blue bars denote a histogram of data divided into 1 sec bins. Red curve is a Poisson curve with rate = median count rate of data. |
 |
 |
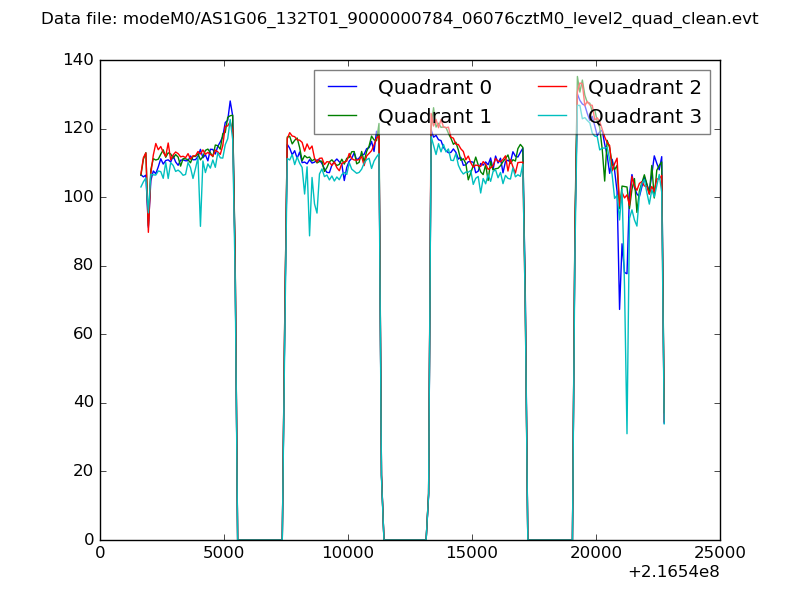
| Quadrant-wise count rates Data is divided into 100 sec bins |
 |
|
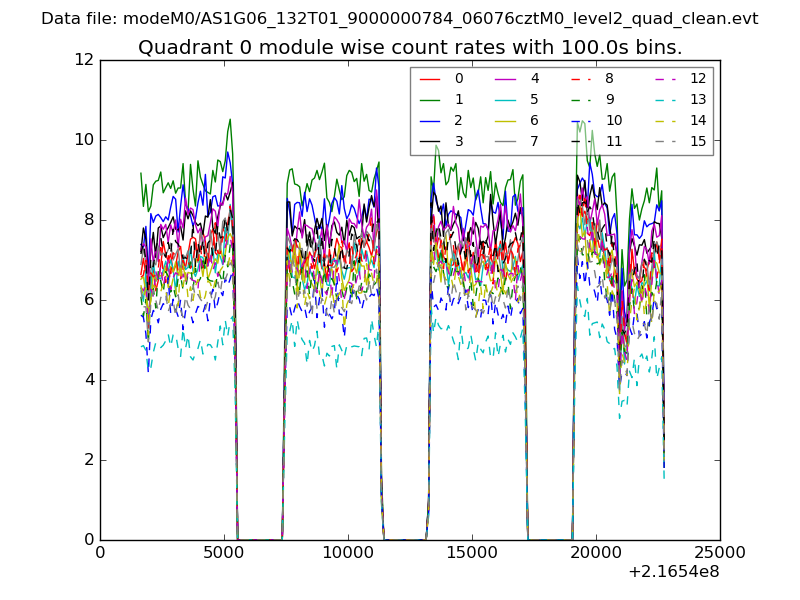
| Module-wise count rates for Quadrant A Data is divided into 100 sec bins |
 |
 |
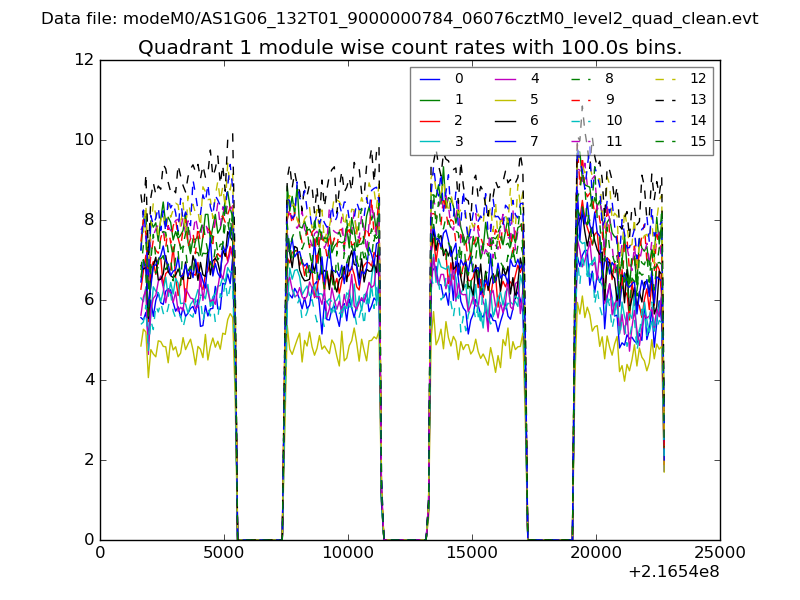
| Module-wise count rates for Quadrant B Data is divided into 100 sec bins |
 |
 |
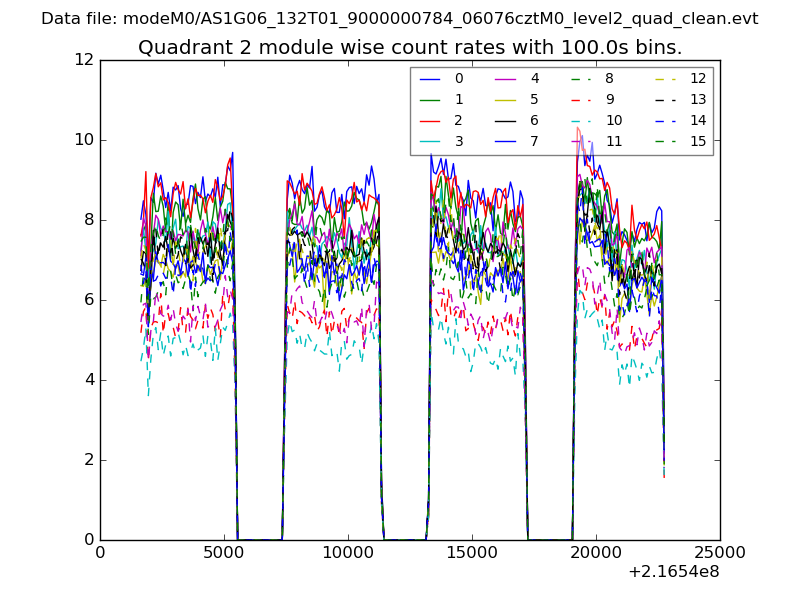
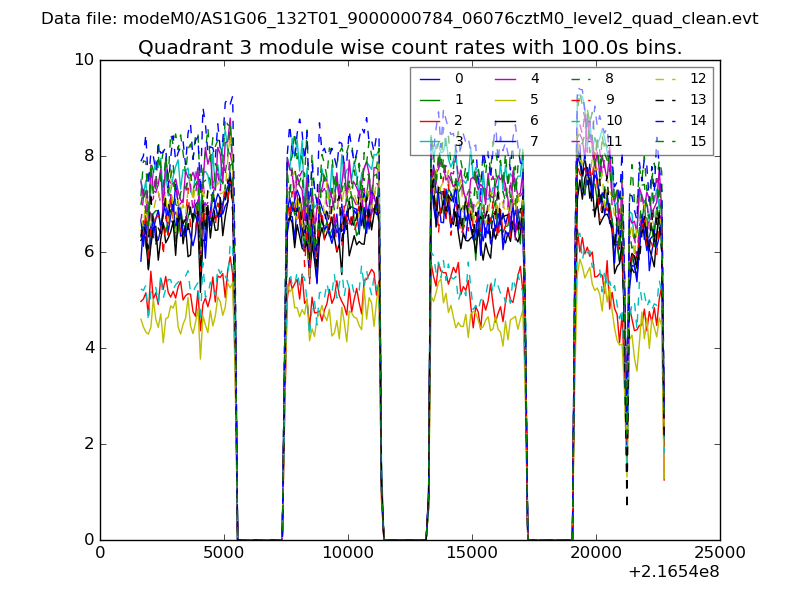
| Module-wise count rates for Quadrant C Data is divided into 100 sec bins |
 |
 |
| Module-wise count rates for Quadrant D Data is divided into 100 sec bins |
 |
 |
| Parameter | Plot |
|---|---|
| CZT HV Monitor | 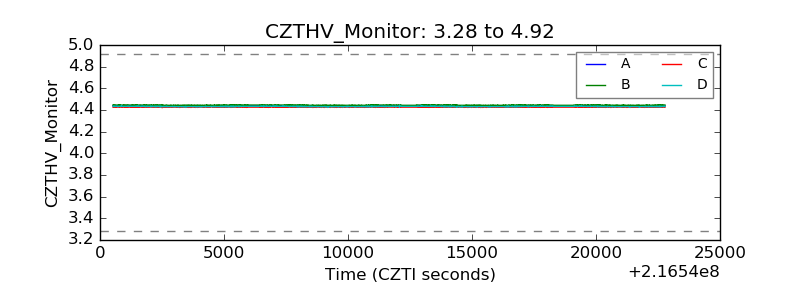 |
| D_VDD | 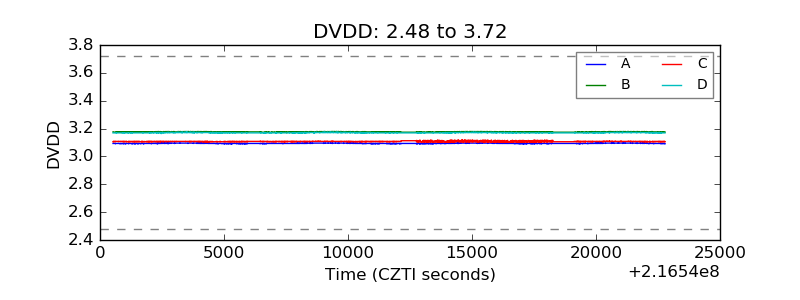 |
| Temperature 1 | 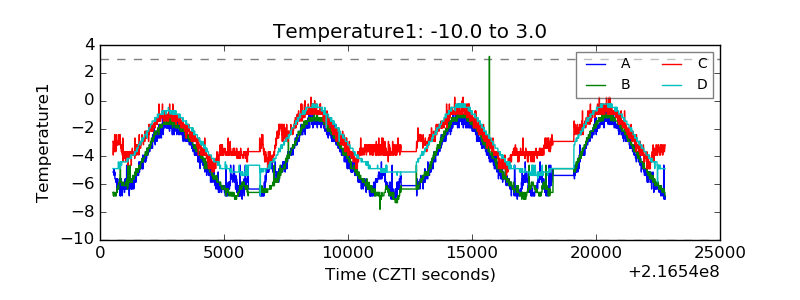 |
| Veto HV Monitor | 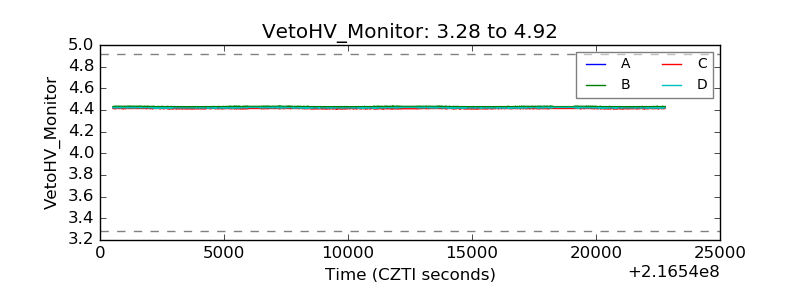 |
| Veto LLD | 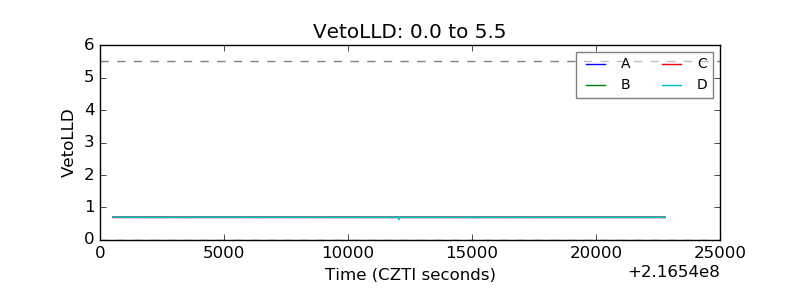 |
| Alpha Counter | 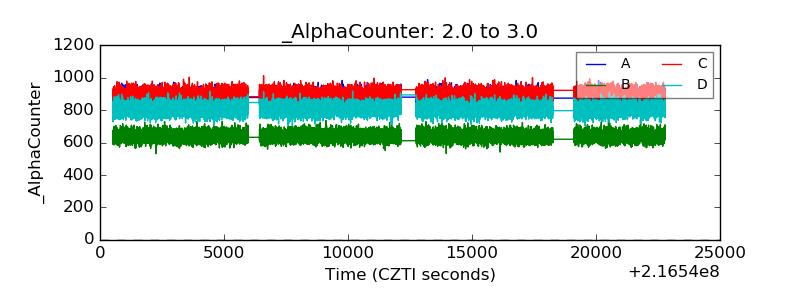 |
| _CPM_Rate | 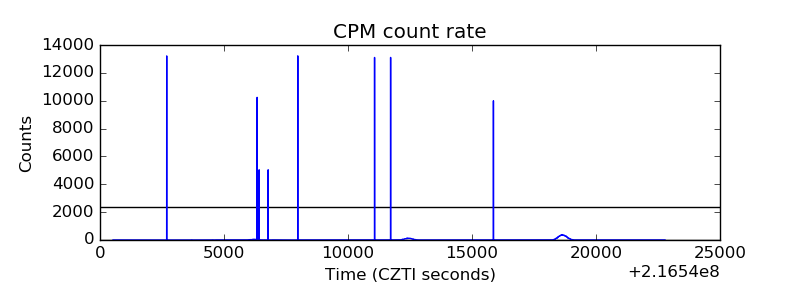 |
| CZT Counter | 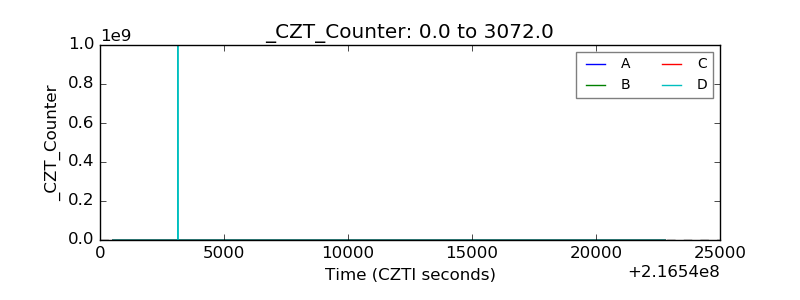 |
| +2.5 Volts monitor |  |
| +5 Volts monitor |  |
| _ROLL_ROT | 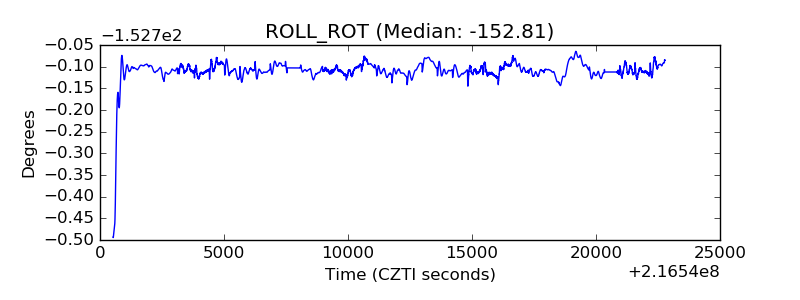 |
| _Roll_DEC | 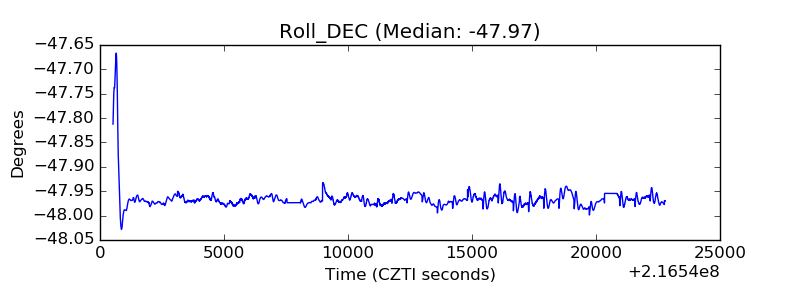 |
| _Roll_RA | 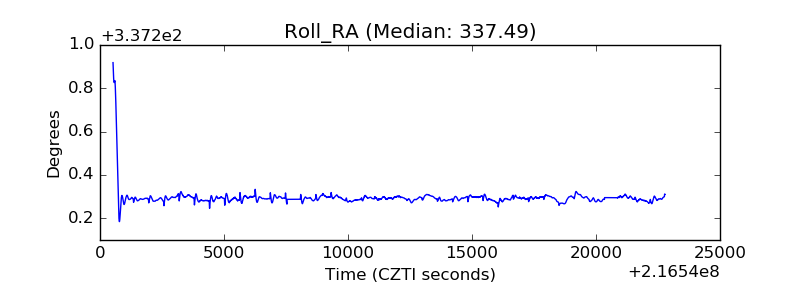 |
| Veto Counter | 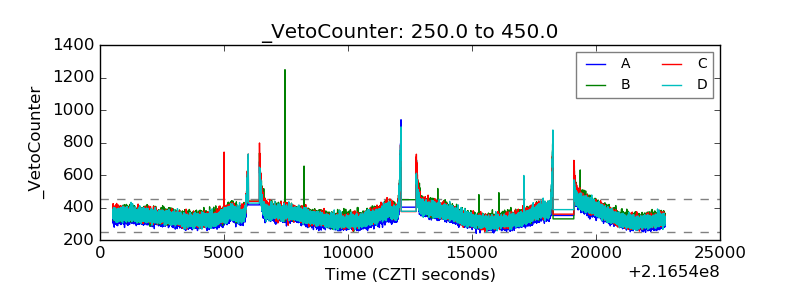 |