| Param | Original file | Final file |
|---|---|---|
| Filename | modeM0/AS1G06_168T01_9000000786cztM0_level2.fits | modeM0/AS1G06_168T01_9000000786cztM0_level2_quad_clean.evt |
| Size (bytes) | 47,416,320 | 50,803,200 |
| Size | 45.2 MB | 48.4 MB |
| Events in quadrant A | 282,268 | 307,627 |
| Events in quadrant B | 273,144 | 305,681 |
| Events in quadrant C | 279,180 | 292,013 |
| Events in quadrant D | 241,054 | 271,994 |
| Mode SS | |||
|---|---|---|---|
| Quadrant | BADHDUFLAG | Total packets | Discarded packets |
| A | 0 | 108 | 0 |
| B | 0 | 108 | 0 |
| C | 0 | 108 | 0 |
| D | 0 | 108 | 0 |
| Mode M9 | |||
|---|---|---|---|
| Quadrant | BADHDUFLAG | Total packets | Discarded packets |
| A | 0 | 9 | 0 |
| B | 0 | 9 | 0 |
| C | 0 | 9 | 0 |
| D | 0 | 9 | 0 |
| Mode M0 | |||
|---|---|---|---|
| Quadrant | BADHDUFLAG | Total packets | Discarded packets |
| A | 0 | 10656 | 0 |
| B | 0 | 10896 | 0 |
| C | 0 | 10478 | 0 |
| D | 0 | 10700 | 0 |
| Quadrant | Total seconds | Saturated seconds | Saturation percentage |
|---|---|---|---|
| A | 5142 | 61 | 1.186309% |
| B | 5121 | 83 | 1.620777% |
| C | 5130 | 45 | 0.877193% |
| D | 5138 | 56 | 1.089918% |
Noise dominated data is calculated using 1-second bins in cleaned event files. If a bin has >2000 counts, and if more than 50% of those come from <1% of pixels, then it is considered to be noise-dominated and hence unusable.
| Quadrant | # 1 sec bins | Bins with >0 counts | Bins with >2000 counts | High rate bins dominated by noise | Noise dominated (total time) | Noise dominated (detector-on time) | Marked lightcurve |
|---|---|---|---|---|---|---|---|
| A | 6198 | 5203 | 0 | 0 | 0.00% | 0.00% | 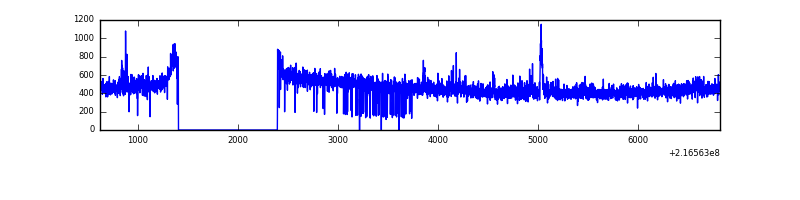 |
| B | 6198 | 5199 | 0 | 0 | 0.00% | 0.00% | 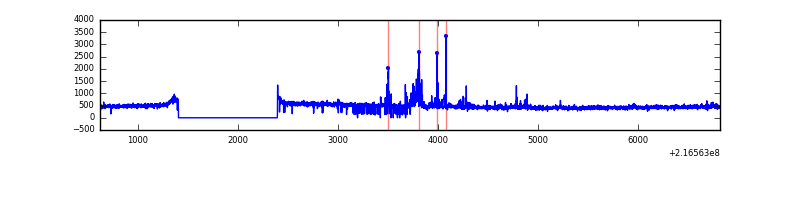 |
| C | 6198 | 5202 | 0 | 0 | 0.00% | 0.00% | 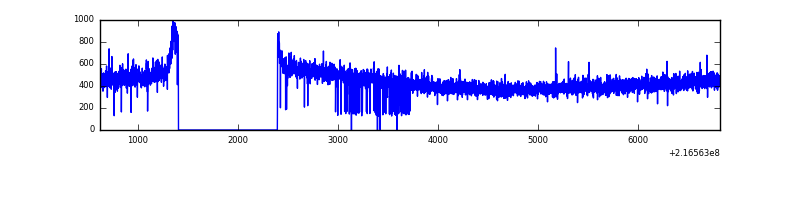 |
| D | 6198 | 5197 | 0 | 0 | 0.00% | 0.00% | 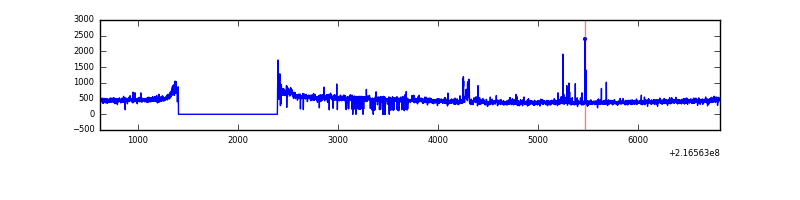 |
Top three noisy pixels from each quadrant. If the there are fewer than three noisy pixels in the level2.evt file, extra rows are filled as -1
| Pixel properties | Quadrant properties | ||||||
|---|---|---|---|---|---|---|---|
| Quadrant | DetID | PixID | Counts | Sigma | Mean | Median | Sigma |
| A | 0 | 29 | 322 | 12.12 | 73 | 69 | 20.9 |
| A | 14 | 188 | 281 | 10.16 | 73 | 69 | 20.9 |
| A | 7 | 110 | 262 | 9.24 | 73 | 69 | 20.9 |
| B | 2 | 9 | 231 | 9.64 | 72 | 68 | 16.9 |
| B | 12 | 226 | 202 | 7.93 | 72 | 68 | 16.9 |
| B | 5 | 225 | 189 | 7.16 | 72 | 68 | 16.9 |
| C | 12 | 241 | 215 | 6.79 | 73 | 68 | 21.7 |
| C | 1 | 80 | 204 | 6.28 | 73 | 68 | 21.7 |
| C | 9 | 242 | 200 | 6.09 | 73 | 68 | 21.7 |
| D | 1 | 19 | 189 | 6.28 | 68 | 62 | 20.2 |
| D | 3 | 14 | 182 | 5.94 | 68 | 62 | 20.2 |
| D | 1 | 3 | 179 | 5.79 | 68 | 62 | 20.2 |
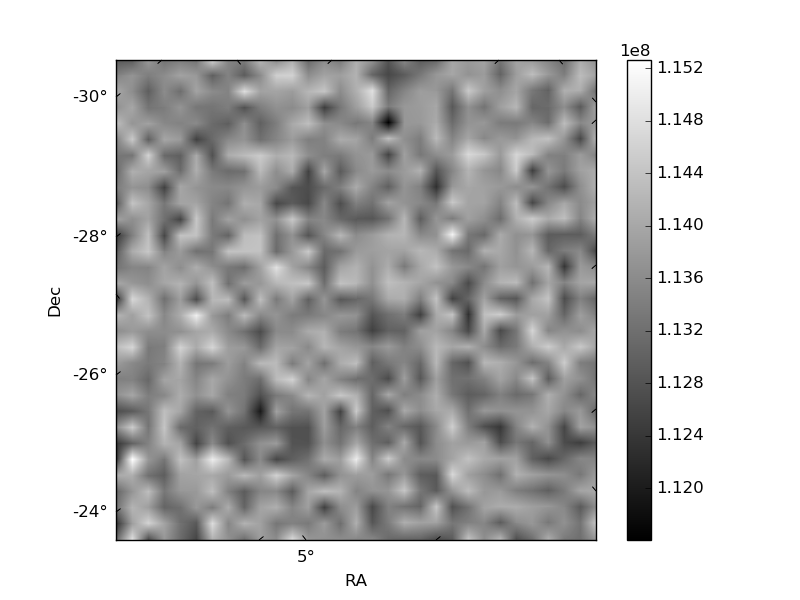
Histogram calculated using DETX and DETY for each event in the final _common_clean file
| Quadrant A | 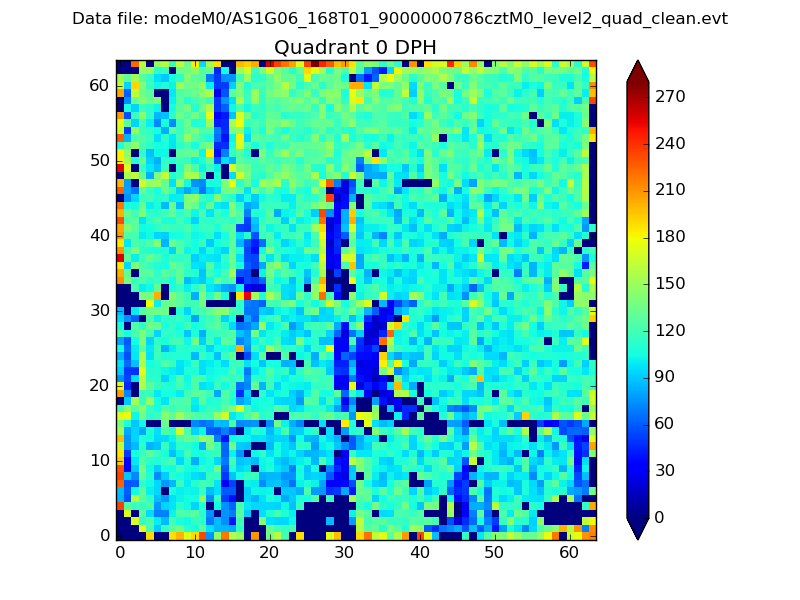 |
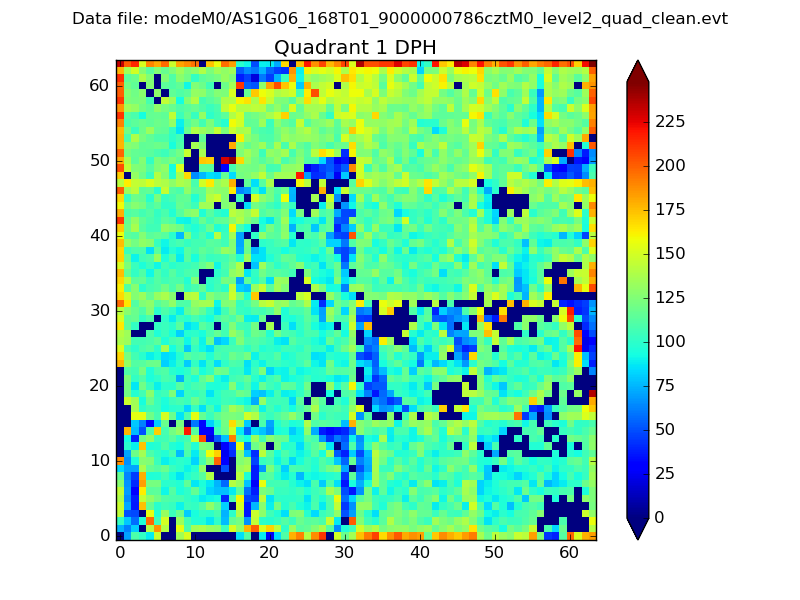 |
Quadrant B |
|---|---|---|---|
| Quadrant D | 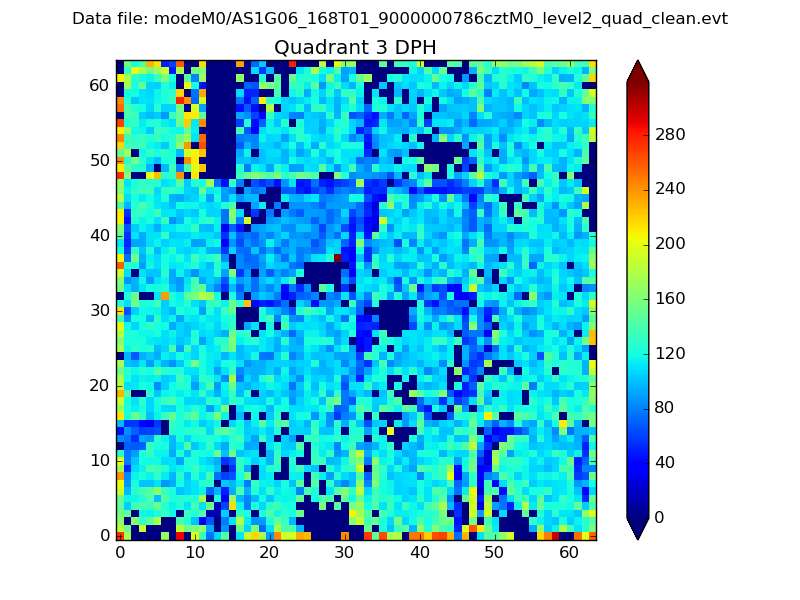 |
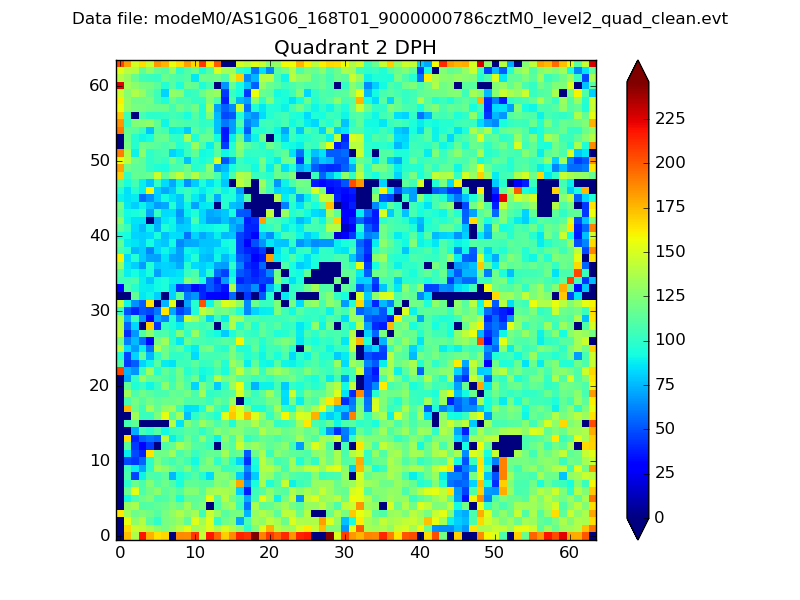 |
Quadrant C |
| Plot type | Count rate plots | Images |
|---|---|---|
| Comparison with Poisson distribution Blue bars denote a histogram of data divided into 1 sec bins. Red curve is a Poisson curve with rate = median count rate of data. |
 |
 |
| Quadrant-wise count rates Data is divided into 100 sec bins |
 |
|
| Module-wise count rates for Quadrant A Data is divided into 100 sec bins |
 |
 |
| Module-wise count rates for Quadrant B Data is divided into 100 sec bins |
 |
 |
| Module-wise count rates for Quadrant C Data is divided into 100 sec bins |
 |
 |
| Module-wise count rates for Quadrant D Data is divided into 100 sec bins |
 |
 |
| Parameter | Plot |
|---|---|
| CZT HV Monitor | 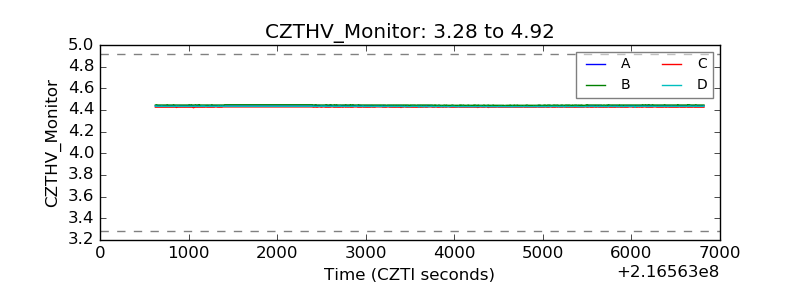 |
| D_VDD |  |
| Temperature 1 |  |
| Veto HV Monitor | 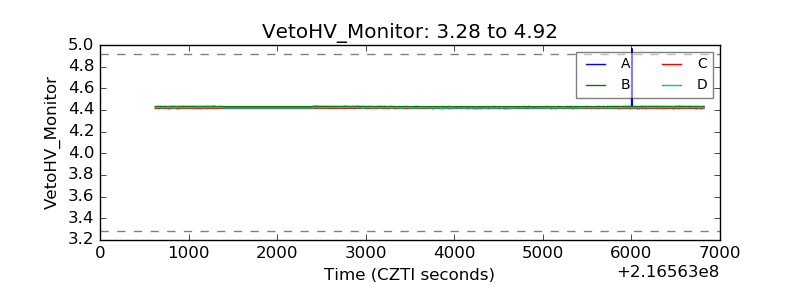 |
| Veto LLD |  |
| Alpha Counter |  |
| _CPM_Rate | 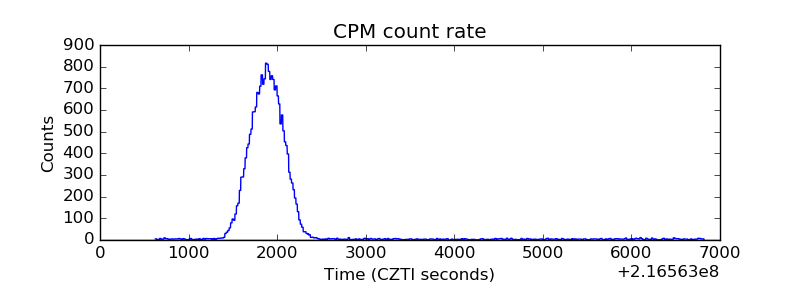 |
| CZT Counter |  |
| +2.5 Volts monitor |  |
| +5 Volts monitor |  |
| _ROLL_ROT | 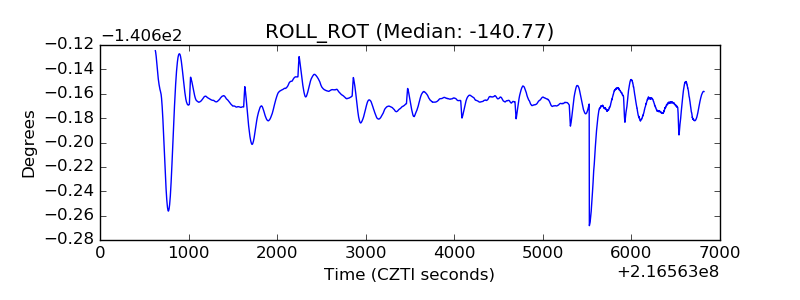 |
| _Roll_DEC |  |
| _Roll_RA |  |
| Veto Counter |  |