| Param | Original file | Final file |
|---|---|---|
| Filename | modeM0/AS1G06_168T01_9000000786_06074cztM0_level2.evt | modeM0/AS1G06_168T01_9000000786_06074cztM0_level2_quad_clean.evt |
| Size (bytes) | 146,675,520 | 23,454,720 |
| Size | 139.9 MB | 22.4 MB |
| Events in quadrant A | 1,081,089 | 140,848 |
| Events in quadrant B | 1,103,141 | 143,061 |
| Events in quadrant C | 1,046,066 | 141,065 |
| Events in quadrant D | 1,069,029 | 135,101 |
| Mode SS | |||
|---|---|---|---|
| Quadrant | BADHDUFLAG | Total packets | Discarded packets |
| A | 0 | 46 | 2 |
| B | 0 | 46 | 0 |
| C | 0 | 46 | 0 |
| D | 0 | 46 | 0 |
| Mode M9 | |||
|---|---|---|---|
| Quadrant | BADHDUFLAG | Total packets | Discarded packets |
| A | 0 | 9 | 0 |
| B | 0 | 9 | 0 |
| C | 0 | 9 | 0 |
| D | 0 | 9 | 0 |
| Mode M0 | |||
|---|---|---|---|
| Quadrant | BADHDUFLAG | Total packets | Discarded packets |
| A | 0 | 4576 | 139 |
| B | 0 | 4674 | 196 |
| C | 0 | 4481 | 158 |
| D | 0 | 4612 | 150 |
| Quadrant | Total seconds | Saturated seconds | Saturation percentage |
|---|---|---|---|
| A | 2063 | 60 | 2.908386% |
| B | 2042 | 73 | 3.574927% |
| C | 2051 | 45 | 2.194052% |
| D | 2059 | 56 | 2.719767% |
Noise dominated data is calculated using 1-second bins in cleaned event files. If a bin has >2000 counts, and if more than 50% of those come from <1% of pixels, then it is considered to be noise-dominated and hence unusable.
| Quadrant | # 1 sec bins | Bins with >0 counts | Bins with >2000 counts | High rate bins dominated by noise | Noise dominated (total time) | Noise dominated (detector-on time) | Marked lightcurve |
|---|---|---|---|---|---|---|---|
| A | 3119 | 2125 | 0 | 0 | 0.00% | 0.00% |  |
| B | 3119 | 2121 | 1 | 1 | 0.03% | 0.05% |  |
| C | 3119 | 2124 | 0 | 0 | 0.00% | 0.00% | 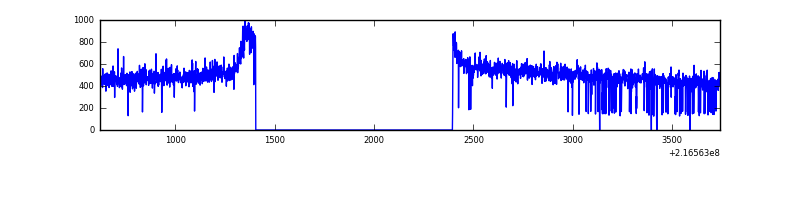 |
| D | 3119 | 2119 | 0 | 0 | 0.00% | 0.00% |  |
Top three noisy pixels from each quadrant. If the there are fewer than three noisy pixels in the level2.evt file, extra rows are filled as -1
| Pixel properties | Quadrant properties | ||||||
|---|---|---|---|---|---|---|---|
| Quadrant | DetID | PixID | Counts | Sigma | Mean | Median | Sigma |
| A | 13 | 210 | 10140 | 168.01 | 275 | 269 | 58.8 |
| A | 14 | 111 | 5264 | 85.02 | 275 | 269 | 58.8 |
| A | 8 | 15 | 4047 | 64.3 | 275 | 269 | 58.8 |
| B | 3 | 64 | 16988 | 305.45 | 274 | 268 | 54.7 |
| B | 0 | 219 | 9931 | 176.53 | 274 | 268 | 54.7 |
| B | 4 | 81 | 6830 | 119.88 | 274 | 268 | 54.7 |
| C | 14 | 206 | 2366 | 32.72 | 267 | 268 | 64.1 |
| C | 13 | 61 | 2119 | 28.87 | 267 | 268 | 64.1 |
| C | 8 | 222 | 949 | 10.62 | 267 | 268 | 64.1 |
| D | 12 | 221 | 28441 | 412.09 | 268 | 259 | 68.4 |
| D | 5 | 239 | 9260 | 131.62 | 268 | 259 | 68.4 |
| D | 8 | 195 | 7282 | 102.69 | 268 | 259 | 68.4 |
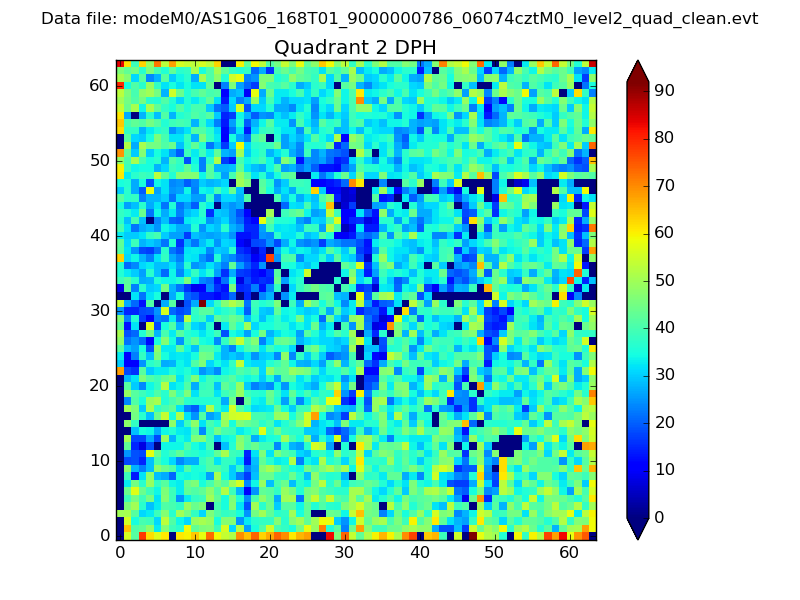
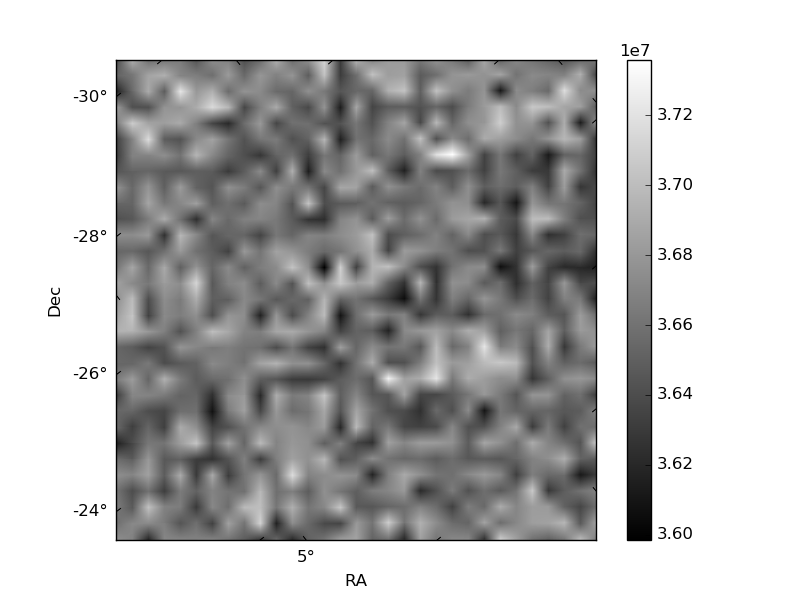
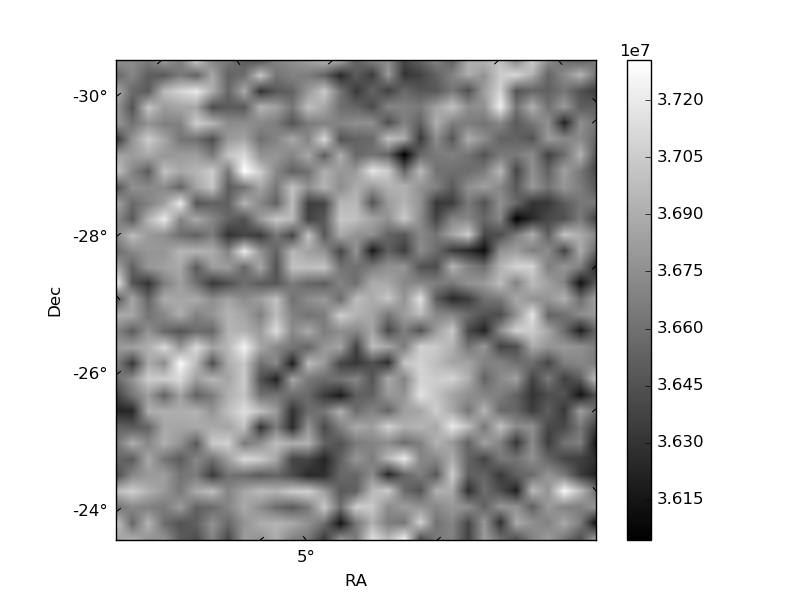
Histogram calculated using DETX and DETY for each event in the final _common_clean file
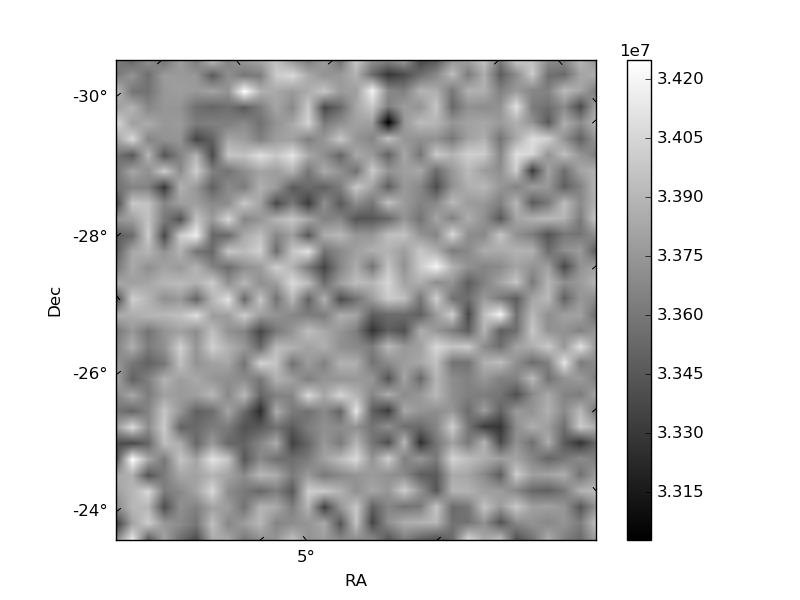
| Quadrant A | 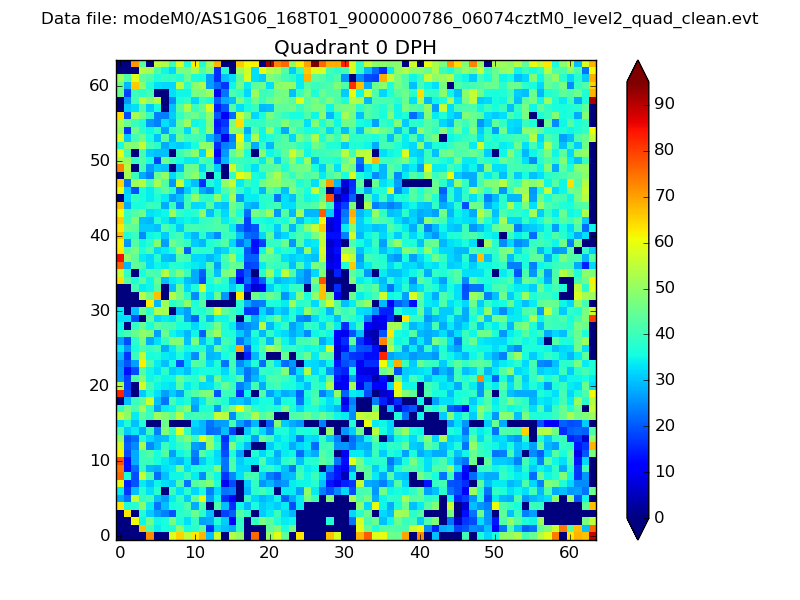 |
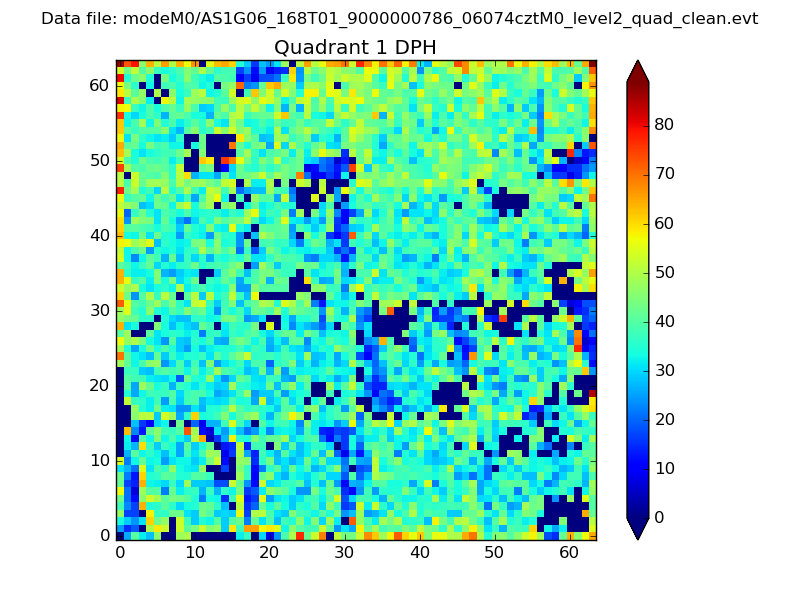 |
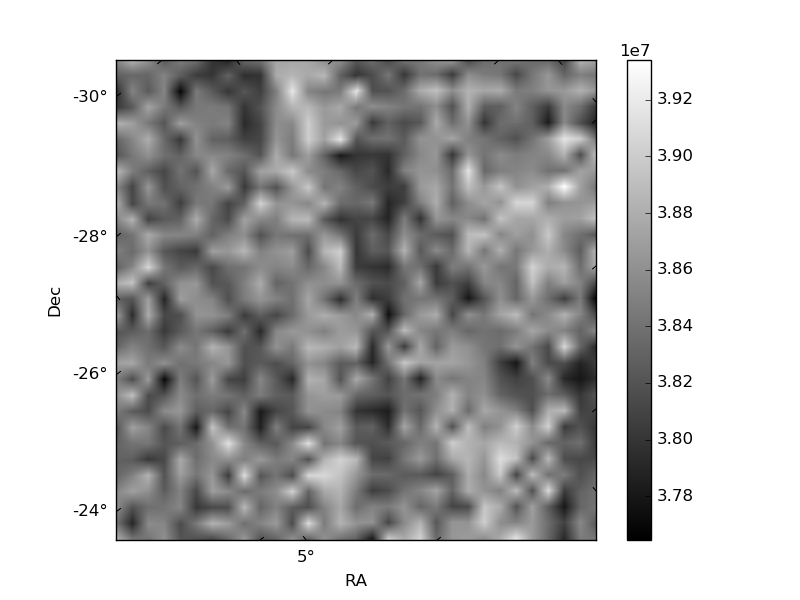
Quadrant B |
|---|---|---|---|
| Quadrant D | 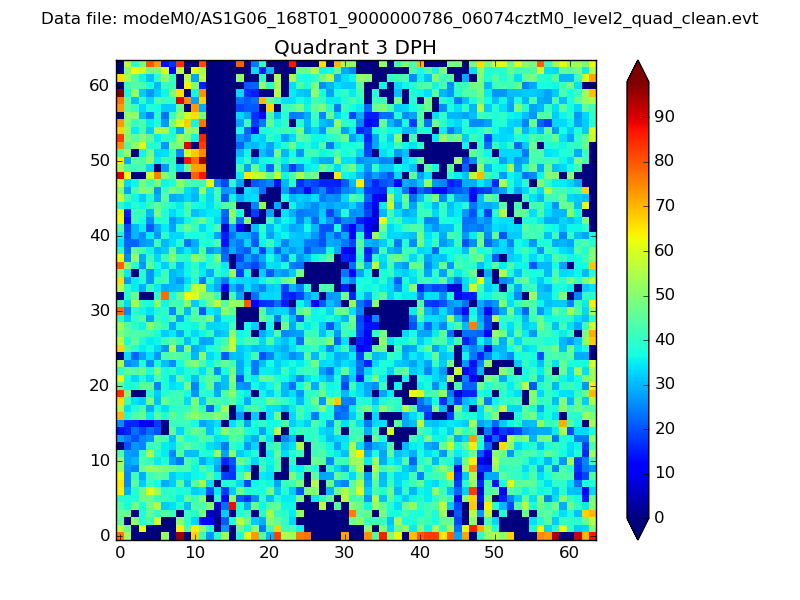 |
 |
Quadrant C |
| Plot type | Count rate plots | Images |
|---|---|---|
| Comparison with Poisson distribution Blue bars denote a histogram of data divided into 1 sec bins. Red curve is a Poisson curve with rate = median count rate of data. |
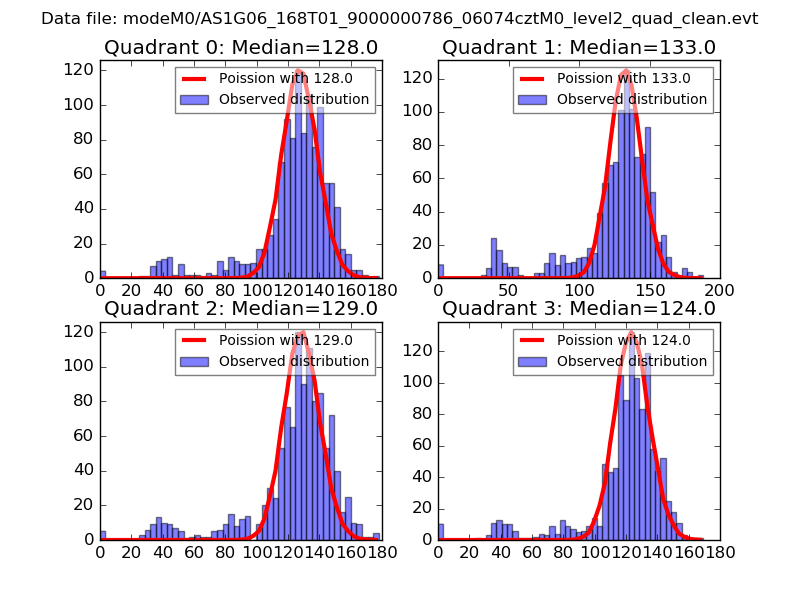 |
 |
| Quadrant-wise count rates Data is divided into 100 sec bins |
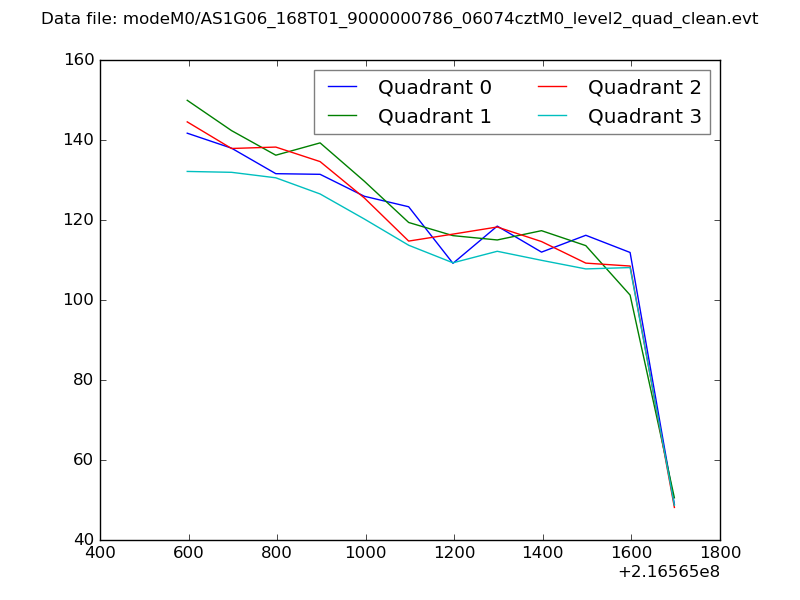 |
|
| Module-wise count rates for Quadrant A Data is divided into 100 sec bins |
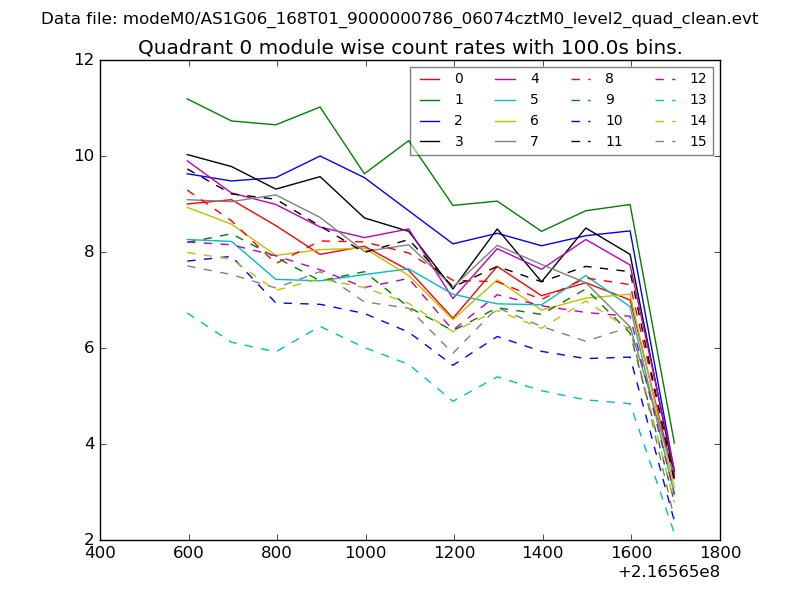 |
 |
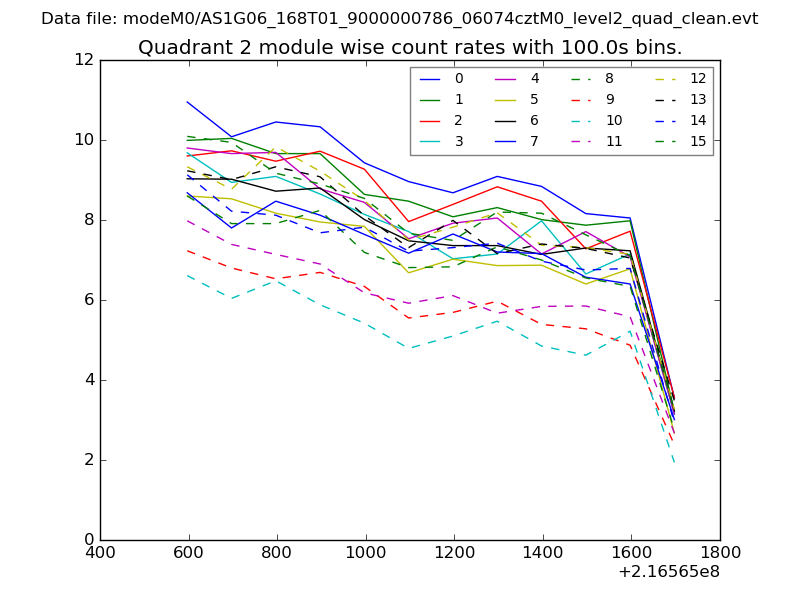
| Module-wise count rates for Quadrant B Data is divided into 100 sec bins |
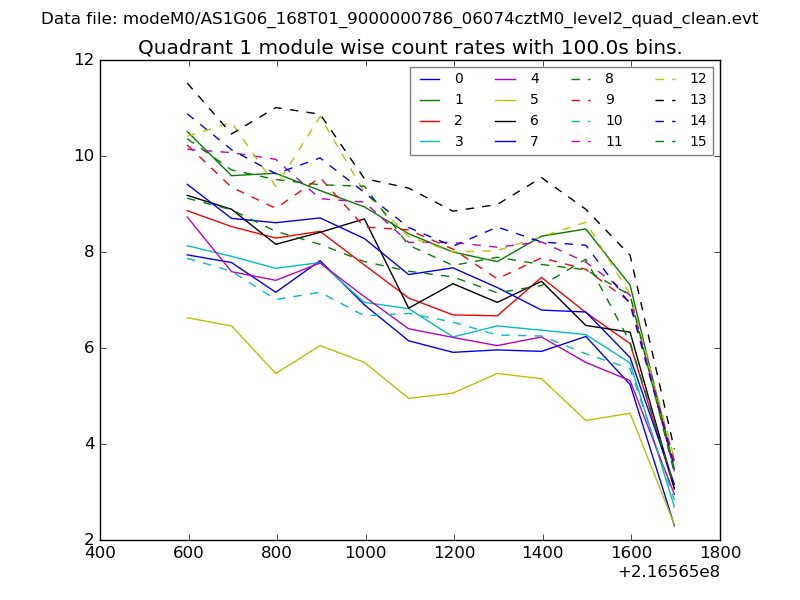 |
 |
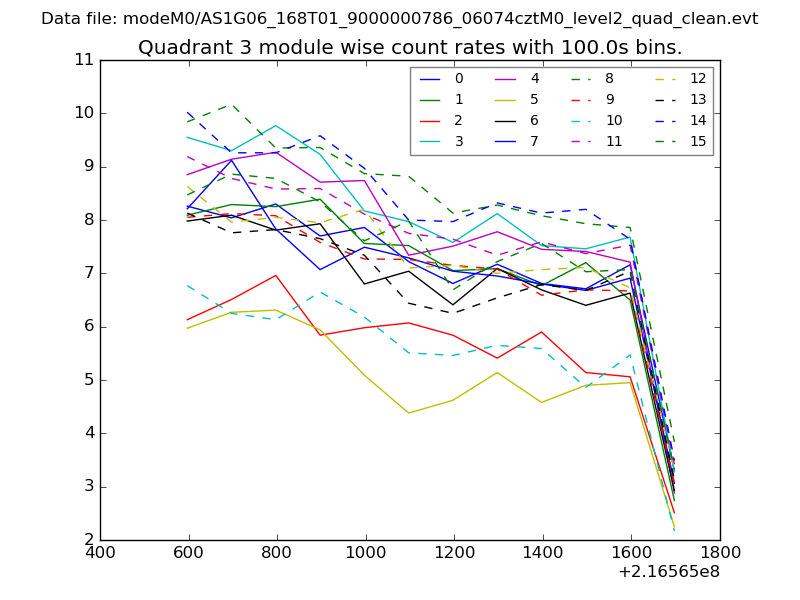
| Module-wise count rates for Quadrant C Data is divided into 100 sec bins |
 |
 |
| Module-wise count rates for Quadrant D Data is divided into 100 sec bins |
 |
 |
| Parameter | Plot |
|---|---|
| CZT HV Monitor | 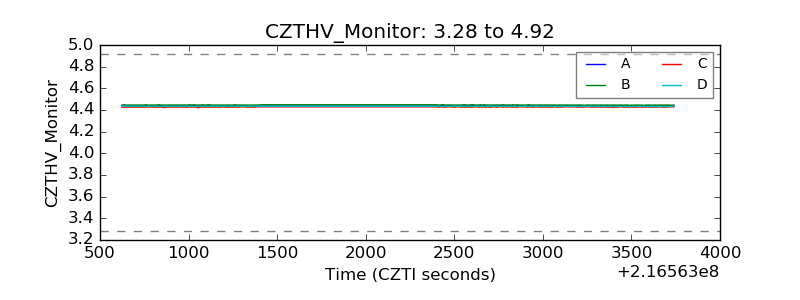 |
| D_VDD | 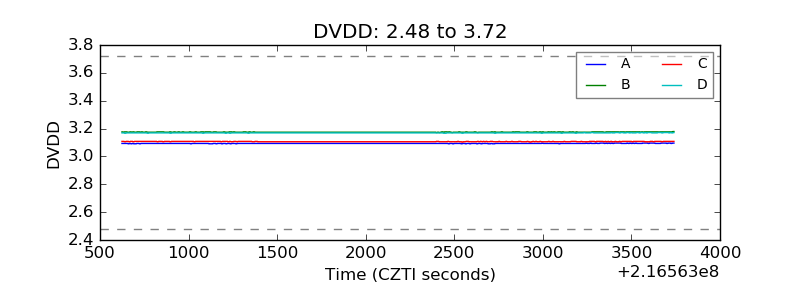 |
| Temperature 1 | 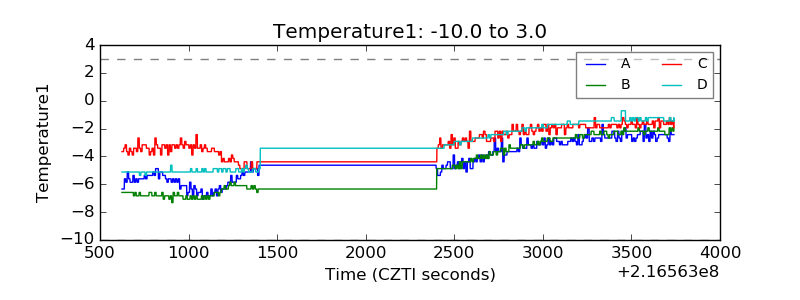 |
| Veto HV Monitor | 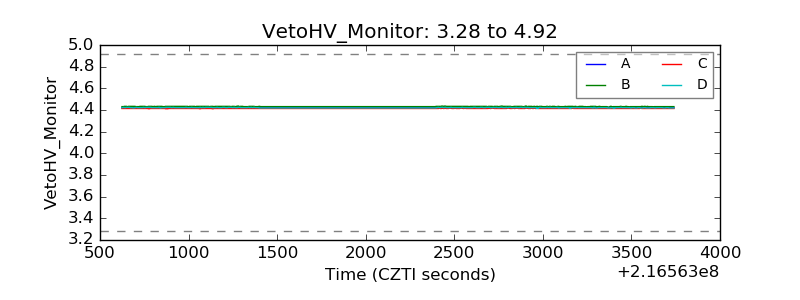 |
| Veto LLD | 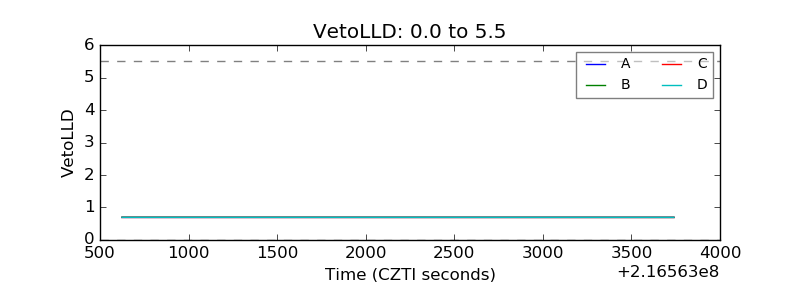 |
| Alpha Counter | 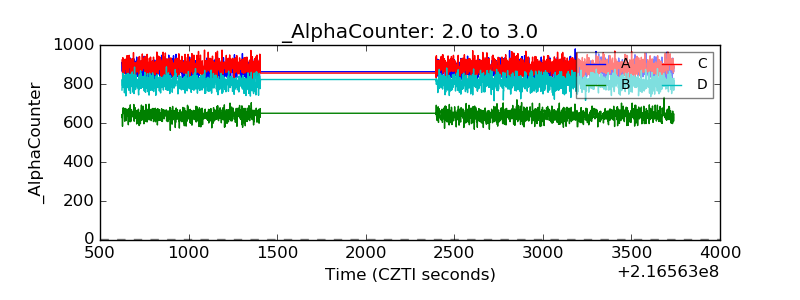 |
| _CPM_Rate | 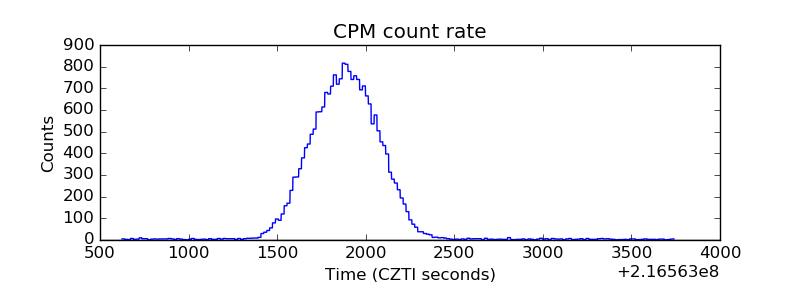 |
| CZT Counter | 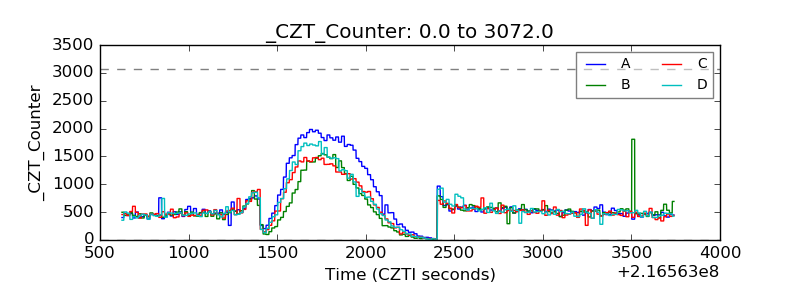 |
| +2.5 Volts monitor | 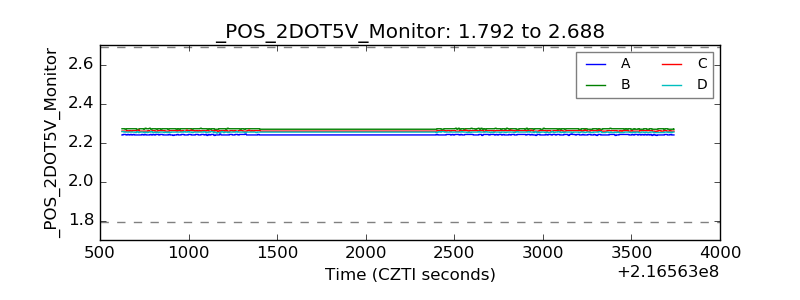 |
| +5 Volts monitor | 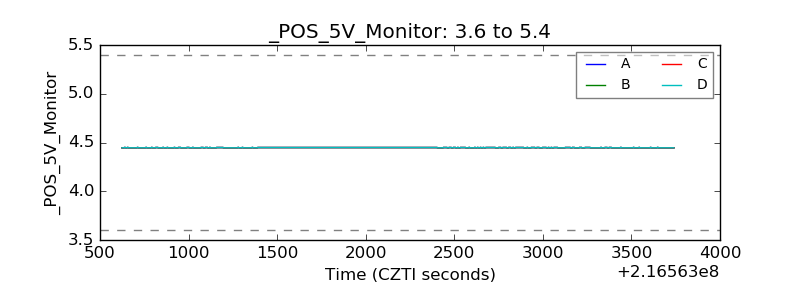 |
| _ROLL_ROT | 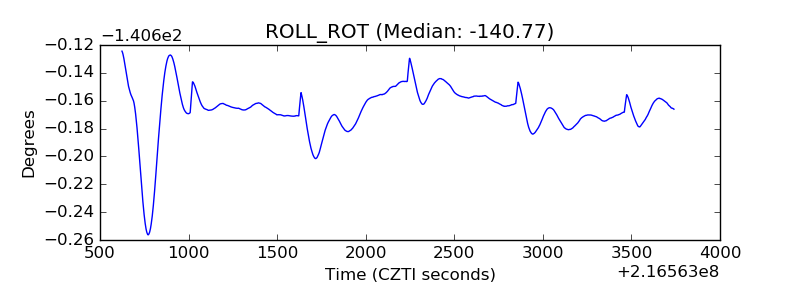 |
| _Roll_DEC | 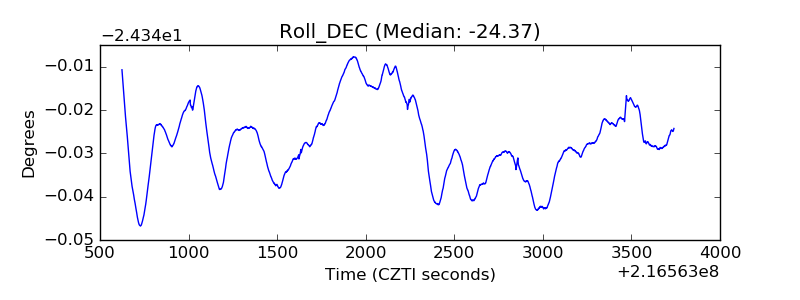 |
| _Roll_RA | 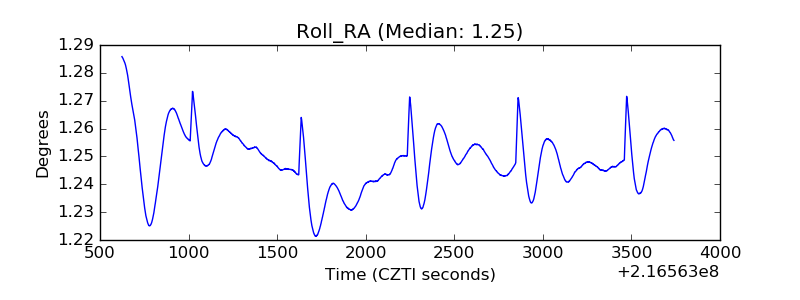 |
| Veto Counter | 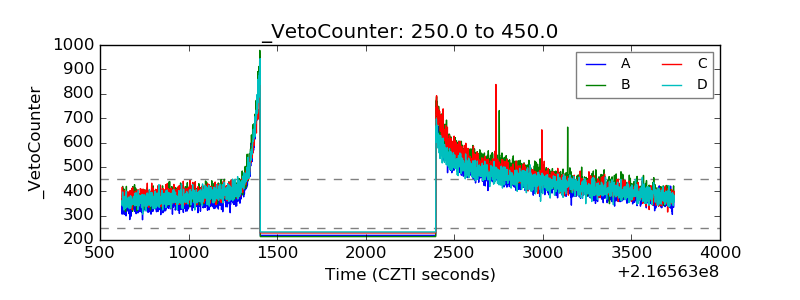 |