| Param | Original file | Final file |
|---|---|---|
| Filename | modeM0/AS1G06_168T01_9000000786_06076cztM0_level2.evt | modeM0/AS1G06_168T01_9000000786_06076cztM0_level2_quad_clean.evt |
| Size (bytes) | 231,379,200 | 59,348,160 |
| Size | 220.7 MB | 56.6 MB |
| Events in quadrant A | 1,707,128 | 383,942 |
| Events in quadrant B | 1,823,857 | 389,987 |
| Events in quadrant C | 1,580,118 | 380,930 |
| Events in quadrant D | 1,631,114 | 368,833 |
| Mode SS | |||
|---|---|---|---|
| Quadrant | BADHDUFLAG | Total packets | Discarded packets |
| A | 0 | 78 | 0 |
| B | 0 | 78 | 0 |
| C | 0 | 78 | 0 |
| D | 0 | 78 | 0 |
| Mode M0 | |||
|---|---|---|---|
| Quadrant | BADHDUFLAG | Total packets | Discarded packets |
| A | 0 | 7825 | 0 |
| B | 0 | 8118 | 0 |
| C | 0 | 7734 | 0 |
| D | 0 | 7834 | 0 |
| Quadrant | Total seconds | Saturated seconds | Saturation percentage |
|---|---|---|---|
| A | 3867 | 2 | 0.051720% |
| B | 3867 | 14 | 0.362038% |
| C | 3867 | 1 | 0.025860% |
| D | 3867 | 0 | 0.000000% |
Noise dominated data is calculated using 1-second bins in cleaned event files. If a bin has >2000 counts, and if more than 50% of those come from <1% of pixels, then it is considered to be noise-dominated and hence unusable.
| Quadrant | # 1 sec bins | Bins with >0 counts | Bins with >2000 counts | High rate bins dominated by noise | Noise dominated (total time) | Noise dominated (detector-on time) | Marked lightcurve |
|---|---|---|---|---|---|---|---|
| A | 3867 | 3867 | 0 | 0 | 0.00% | 0.00% | 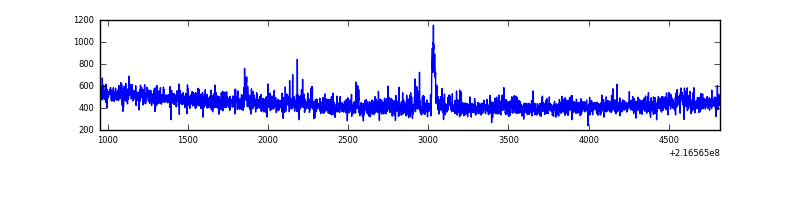 |
| B | 3867 | 3867 | 5 | 5 | 0.13% | 0.13% | 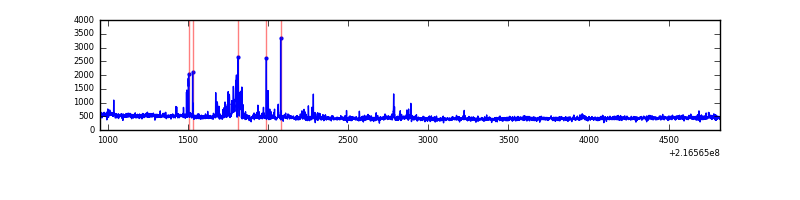 |
| C | 3867 | 3867 | 0 | 0 | 0.00% | 0.00% | 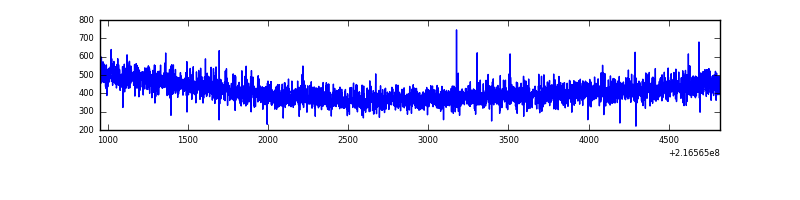 |
| D | 3867 | 3867 | 1 | 1 | 0.03% | 0.03% | 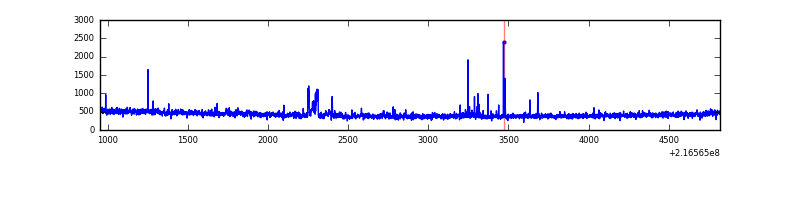 |
Top three noisy pixels from each quadrant. If the there are fewer than three noisy pixels in the level2.evt file, extra rows are filled as -1
| Pixel properties | Quadrant properties | ||||||
|---|---|---|---|---|---|---|---|
| Quadrant | DetID | PixID | Counts | Sigma | Mean | Median | Sigma |
| A | 8 | 15 | 37148 | 419.98 | 420 | 411 | 87.5 |
| A | 15 | 174 | 19316 | 216.12 | 420 | 411 | 87.5 |
| A | 14 | 111 | 16008 | 178.31 | 420 | 411 | 87.5 |
| B | 0 | 214 | 68015 | 809.25 | 424 | 415 | 83.5 |
| B | 0 | 219 | 38034 | 450.34 | 424 | 415 | 83.5 |
| B | 3 | 64 | 22057 | 259.08 | 424 | 415 | 83.5 |
| C | 13 | 61 | 3103 | 28.41 | 404 | 407 | 94.9 |
| C | 8 | 222 | 1384 | 10.3 | 404 | 407 | 94.9 |
| C | 3 | 202 | 1014 | 6.4 | 404 | 407 | 94.9 |
| D | 13 | 169 | 28987 | 283.05 | 405 | 392 | 101.0 |
| D | 12 | 221 | 22377 | 217.62 | 405 | 392 | 101.0 |
| D | 8 | 195 | 19403 | 188.18 | 405 | 392 | 101.0 |
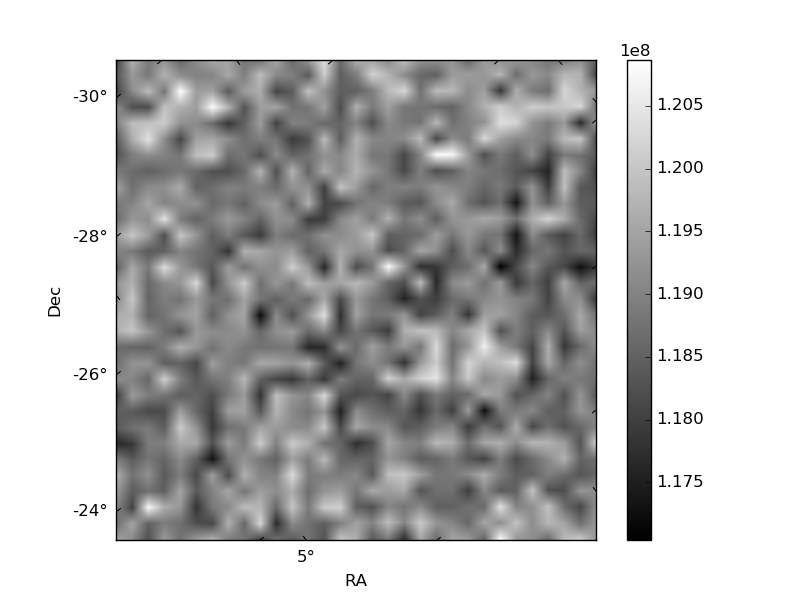
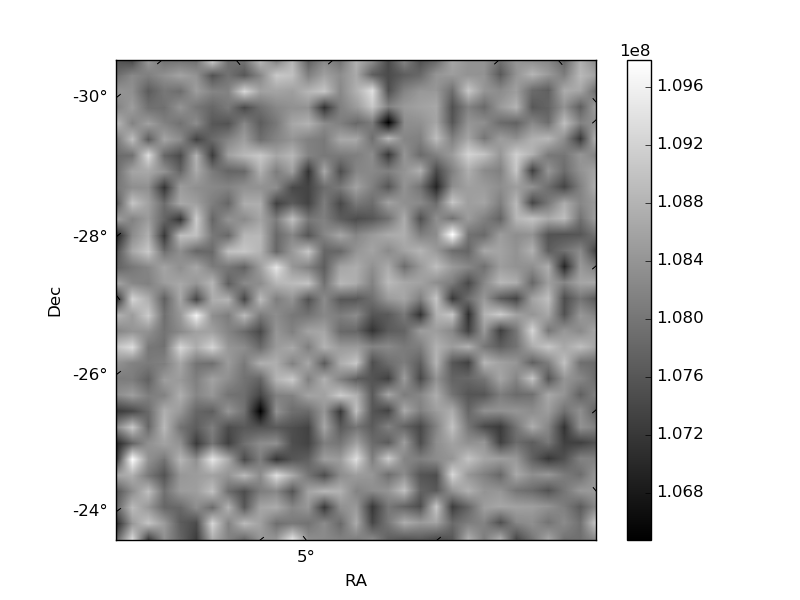
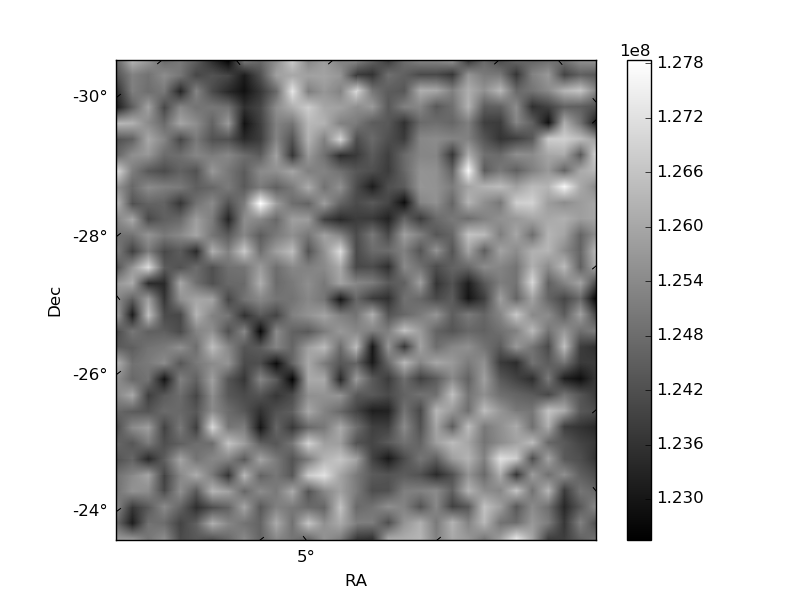
Histogram calculated using DETX and DETY for each event in the final _common_clean file
| Quadrant A | 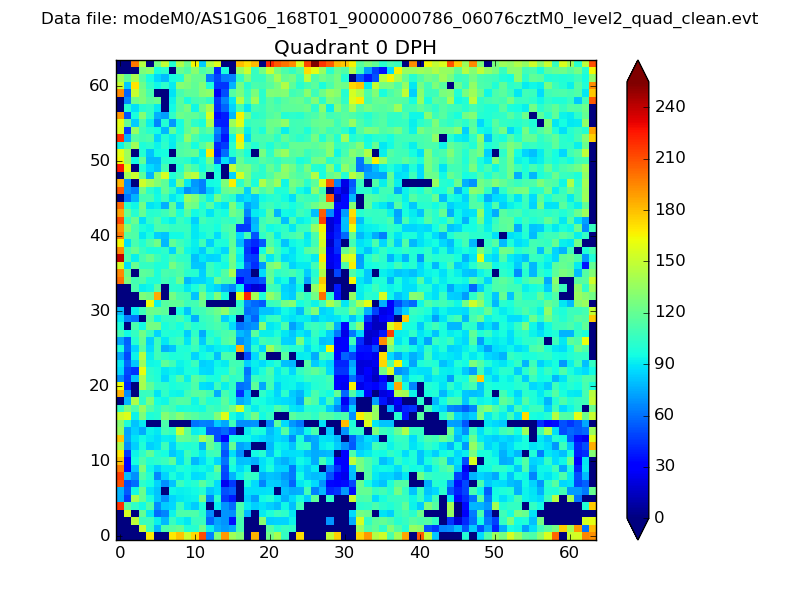 |
 |
Quadrant B |
|---|---|---|---|
| Quadrant D | 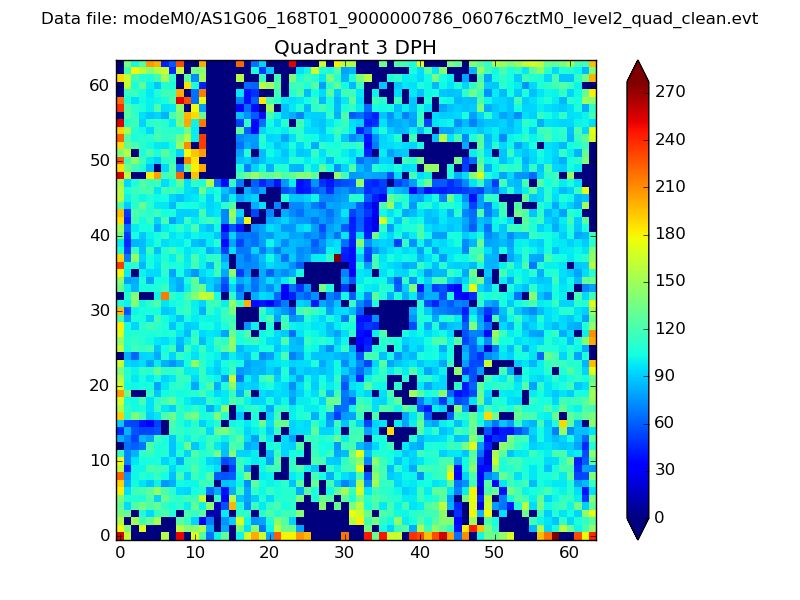 |
 |
Quadrant C |
| Plot type | Count rate plots | Images |
|---|---|---|
| Comparison with Poisson distribution Blue bars denote a histogram of data divided into 1 sec bins. Red curve is a Poisson curve with rate = median count rate of data. |
 |
 |
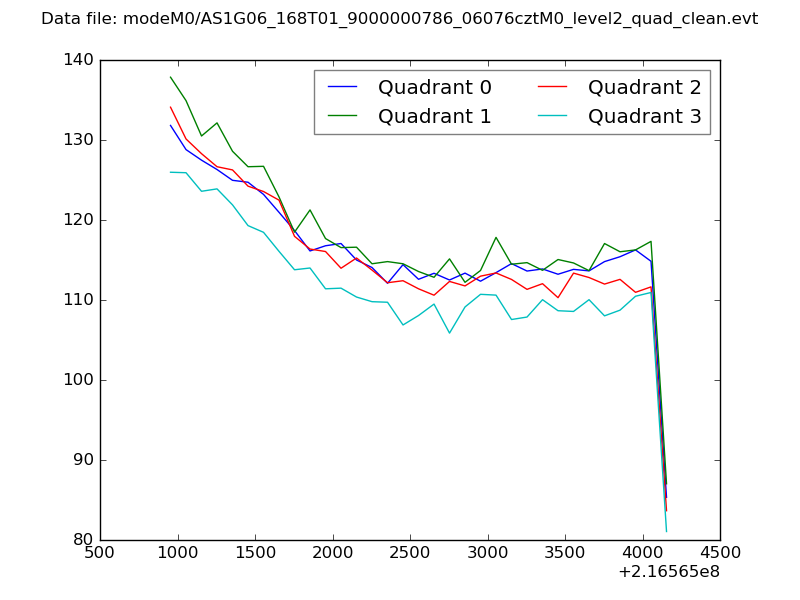
| Quadrant-wise count rates Data is divided into 100 sec bins |
 |
|
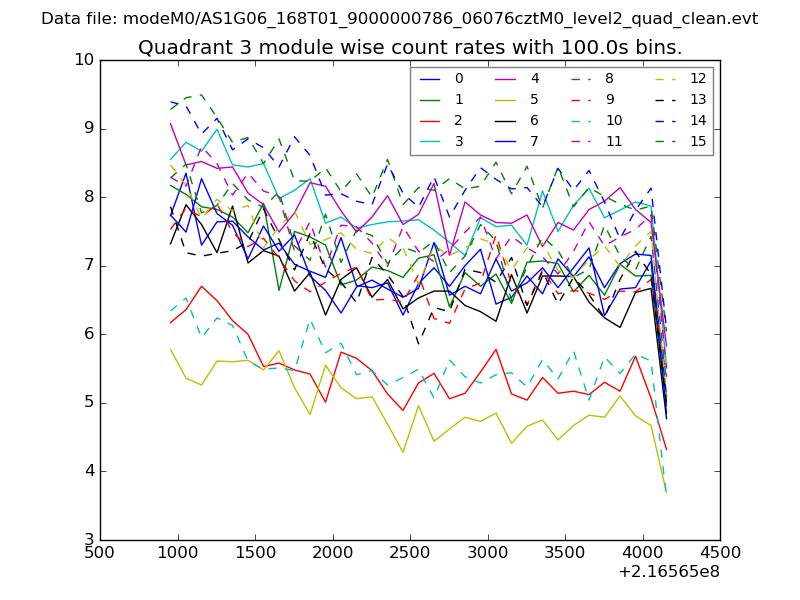
| Module-wise count rates for Quadrant A Data is divided into 100 sec bins |
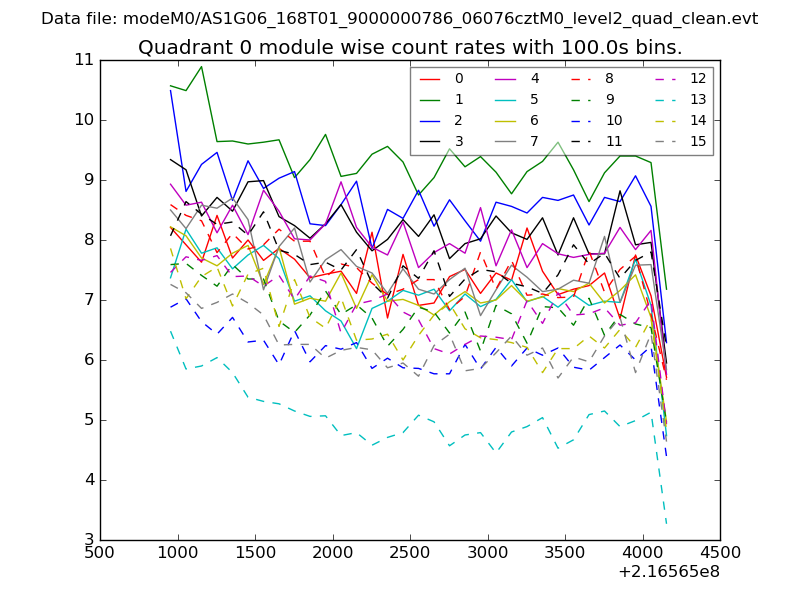 |
 |
| Module-wise count rates for Quadrant B Data is divided into 100 sec bins |
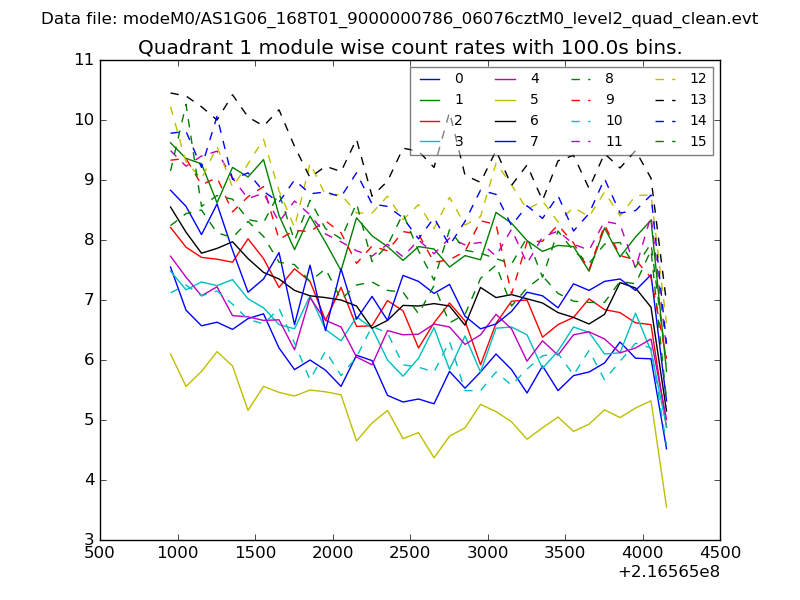 |
 |
| Module-wise count rates for Quadrant C Data is divided into 100 sec bins |
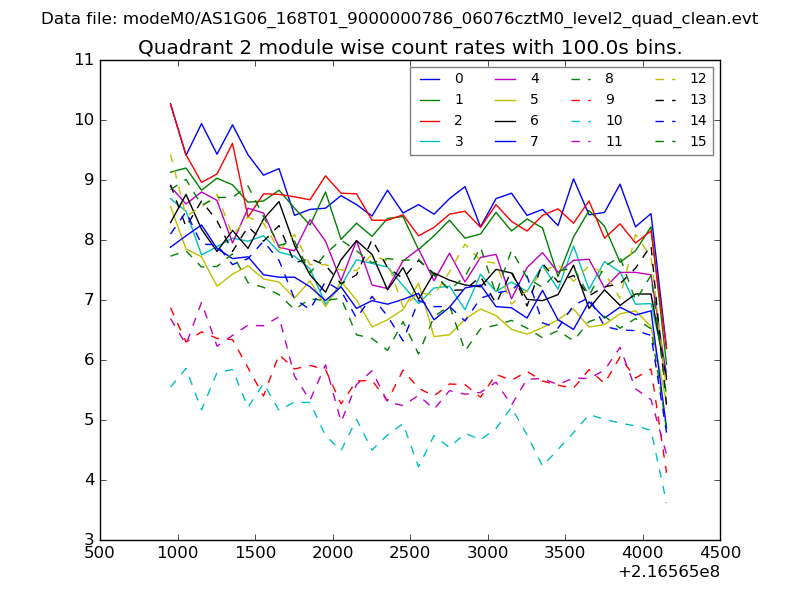 |
 |
| Module-wise count rates for Quadrant D Data is divided into 100 sec bins |
 |
 |
| Parameter | Plot |
|---|---|
| CZT HV Monitor |  |
| D_VDD | 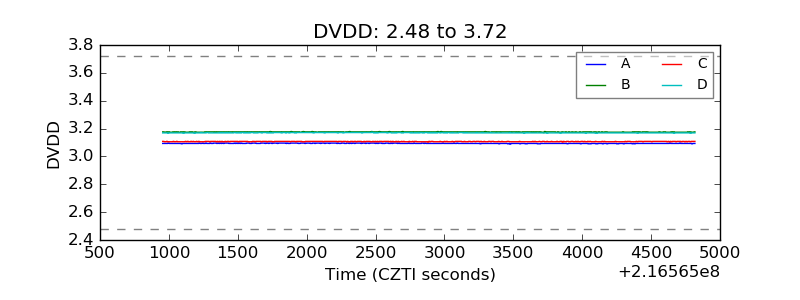 |
| Temperature 1 | 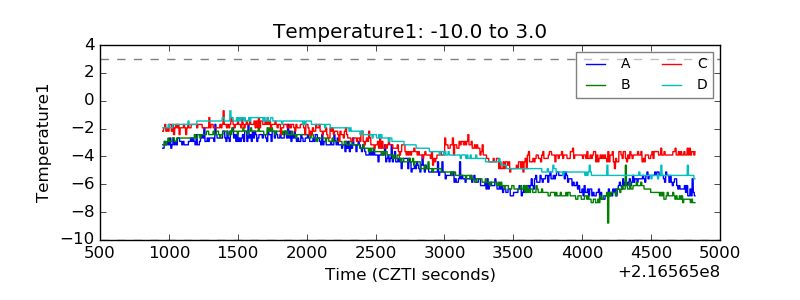 |
| Veto HV Monitor | 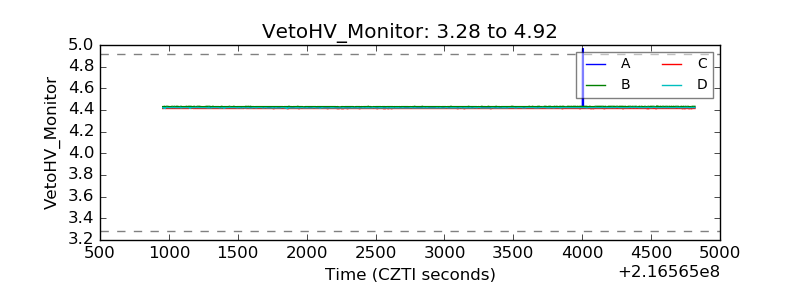 |
| Veto LLD | 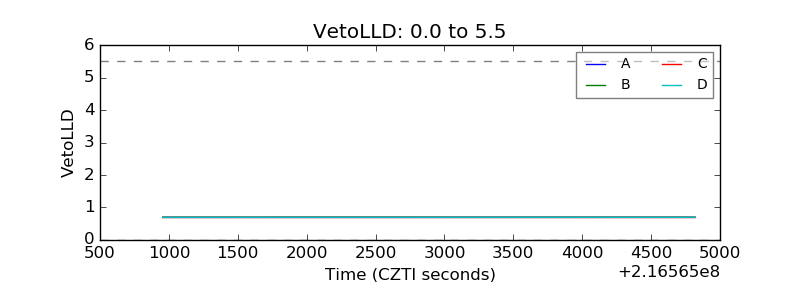 |
| Alpha Counter | 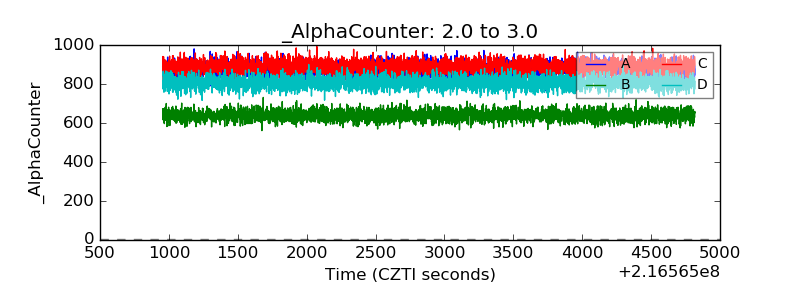 |
| _CPM_Rate | 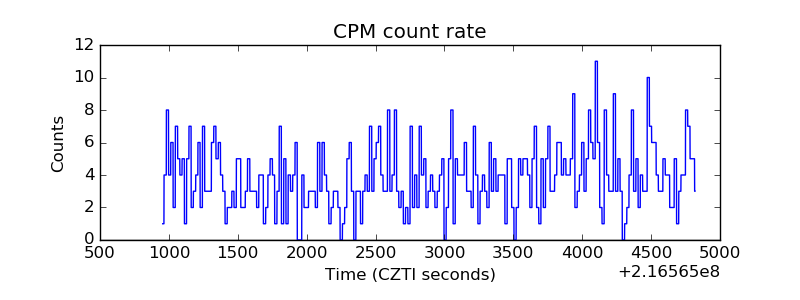 |
| CZT Counter |  |
| +2.5 Volts monitor |  |
| +5 Volts monitor |  |
| _ROLL_ROT | 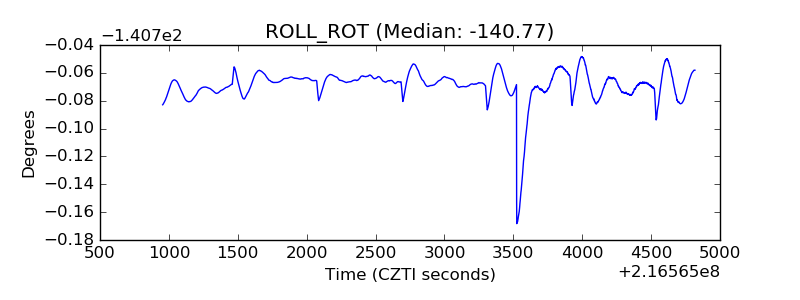 |
| _Roll_DEC | 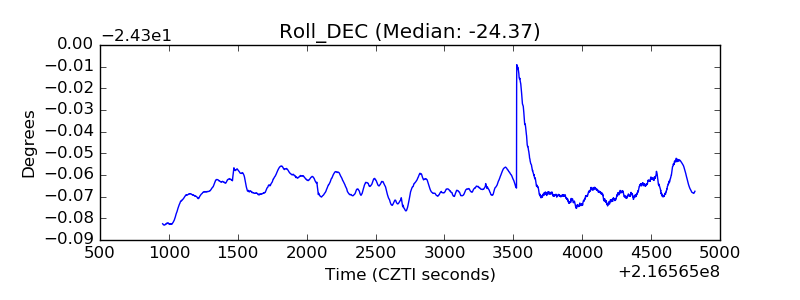 |
| _Roll_RA | 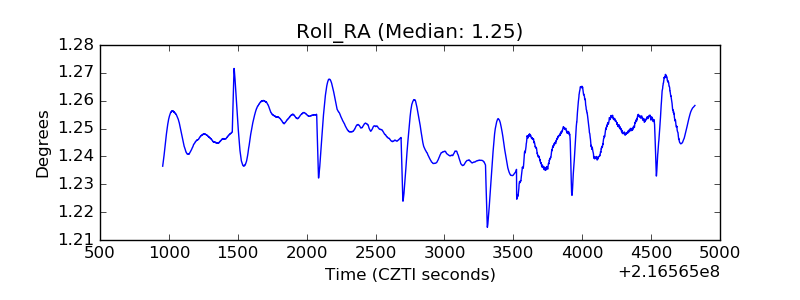 |
| Veto Counter | 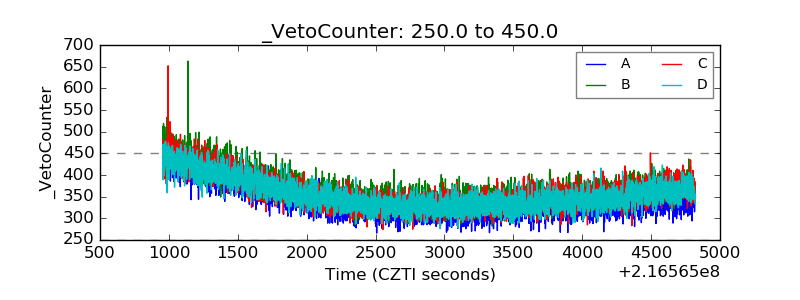 |