| Param | Original file | Final file |
|---|---|---|
| Filename | modeM0/AS1G06_033T01_9000000792cztM0_level2.fits | modeM0/AS1G06_033T01_9000000792cztM0_level2_quad_clean.evt |
| Size (bytes) | 687,695,040 | 628,021,440 |
| Size | 655.8 MB | 598.9 MB |
| Events in quadrant A | 4,073,932 | 3,557,529 |
| Events in quadrant B | 4,010,282 | 3,643,843 |
| Events in quadrant C | 4,104,736 | 3,508,510 |
| Events in quadrant D | 3,468,400 | 3,142,302 |
| Mode M0 | |||
|---|---|---|---|
| Quadrant | BADHDUFLAG | Total packets | Discarded packets |
| A | 0 | 186987 | 0 |
| B | 0 | 165005 | 0 |
| C | 0 | 158180 | 0 |
| D | 0 | 186158 | 0 |
| Mode SS | |||
|---|---|---|---|
| Quadrant | BADHDUFLAG | Total packets | Discarded packets |
| A | 0 | 1534 | 0 |
| B | 0 | 1534 | 0 |
| C | 0 | 1536 | 0 |
| D | 0 | 1536 | 0 |
| Mode M9 | |||
|---|---|---|---|
| Quadrant | BADHDUFLAG | Total packets | Discarded packets |
| A | 0 | 121 | 0 |
| B | 0 | 121 | 0 |
| C | 0 | 120 | 0 |
| D | 0 | 120 | 0 |
| Quadrant | Total seconds | Saturated seconds | Saturation percentage |
|---|---|---|---|
| A | 75228 | 2251 | 2.992237% |
| B | 75393 | 1475 | 1.956415% |
| C | 75393 | 613 | 0.813073% |
| D | 75343 | 3323 | 4.410496% |
Noise dominated data is calculated using 1-second bins in cleaned event files. If a bin has >2000 counts, and if more than 50% of those come from <1% of pixels, then it is considered to be noise-dominated and hence unusable.
| Quadrant | # 1 sec bins | Bins with >0 counts | Bins with >2000 counts | High rate bins dominated by noise | Noise dominated (total time) | Noise dominated (detector-on time) | Marked lightcurve |
|---|---|---|---|---|---|---|---|
| A | 118432 | 75883 | 0 | 0 | 0.00% | 0.00% |  |
| B | 118432 | 75982 | 0 | 0 | 0.00% | 0.00% |  |
| C | 118432 | 76020 | 0 | 0 | 0.00% | 0.00% |  |
| D | 118432 | 75948 | 0 | 0 | 0.00% | 0.00% |  |
Top three noisy pixels from each quadrant. If the there are fewer than three noisy pixels in the level2.evt file, extra rows are filled as -1
| Pixel properties | Quadrant properties | ||||||
|---|---|---|---|---|---|---|---|
| Quadrant | DetID | PixID | Counts | Sigma | Mean | Median | Sigma |
| A | 14 | 188 | 4047 | 11.32 | 1057 | 983 | 270.7 |
| A | 0 | 29 | 4034 | 11.27 | 1057 | 983 | 270.7 |
| A | 7 | 110 | 3501 | 9.3 | 1057 | 983 | 270.7 |
| B | 2 | 9 | 3508 | 11.64 | 1058 | 1003 | 215.3 |
| B | 12 | 226 | 2774 | 8.23 | 1058 | 1003 | 215.3 |
| B | 14 | 254 | 2744 | 8.09 | 1058 | 1003 | 215.3 |
| C | 1 | 81 | 3178 | 7.51 | 1083 | 999 | 290.2 |
| C | 1 | 80 | 3148 | 7.4 | 1083 | 999 | 290.2 |
| C | 12 | 241 | 2927 | 6.64 | 1083 | 999 | 290.2 |
| D | 3 | 14 | 2694 | 6.67 | 988 | 892 | 270.2 |
| D | 11 | 82 | 2568 | 6.2 | 988 | 892 | 270.2 |
| D | 4 | 160 | 2518 | 6.02 | 988 | 892 | 270.2 |
Histogram calculated using DETX and DETY for each event in the final _common_clean file
| Quadrant A | 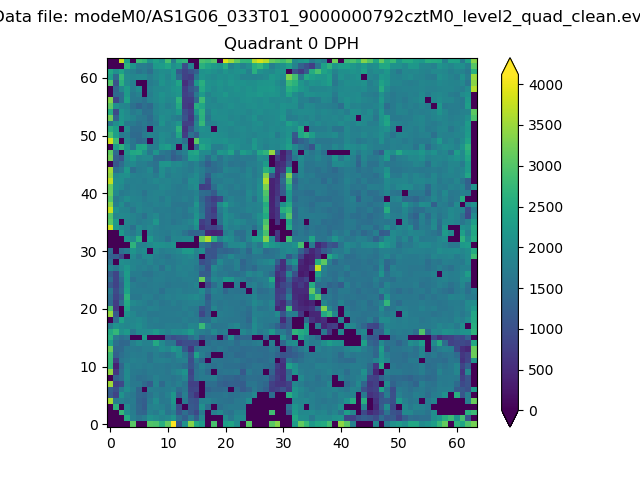 |
 |
Quadrant B |
|---|---|---|---|
| Quadrant D |  |
 |
Quadrant C |
| Plot type | Count rate plots | Images |
|---|---|---|
| Comparison with Poisson distribution Blue bars denote a histogram of data divided into 1 sec bins. Red curve is a Poisson curve with rate = median count rate of data. |
 |
 |
| Quadrant-wise count rates Data is divided into 100 sec bins |
 |
|
| Module-wise count rates for Quadrant A Data is divided into 100 sec bins |
 |
 |
| Module-wise count rates for Quadrant B Data is divided into 100 sec bins |
 |
 |
| Module-wise count rates for Quadrant C Data is divided into 100 sec bins |
 |
 |
| Module-wise count rates for Quadrant D Data is divided into 100 sec bins |
 |
 |
| Parameter | Plot |
|---|---|
| CZT HV Monitor |  |
| D_VDD | 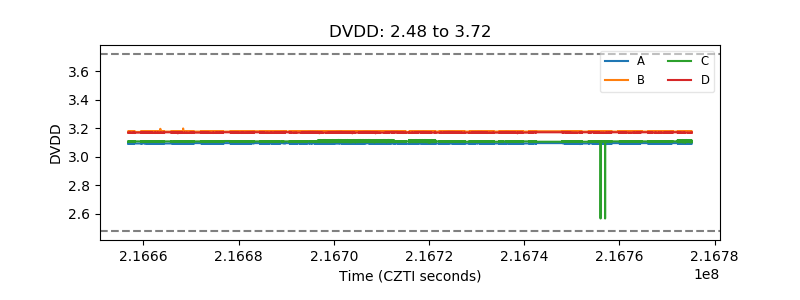 |
| Temperature 1 |  |
| Veto HV Monitor |  |
| Veto LLD |  |
| Alpha Counter |  |
| _CPM_Rate |  |
| CZT Counter |  |
| +2.5 Volts monitor |  |
| +5 Volts monitor |  |
| _ROLL_ROT |  |
| _Roll_DEC |  |
| _Roll_RA |  |
| Veto Counter |  |