| Param | Original file | Final file |
|---|---|---|
| Filename | modeM0/AS1G06_033T01_9000000792_06092cztM0_level2.evt | modeM0/AS1G06_033T01_9000000792_06092cztM0_level2_quad_clean.evt |
| Size (bytes) | 480,510,720 | 72,103,680 |
| Size | 458.3 MB | 68.8 MB |
| Events in quadrant A | 3,476,674 | 455,032 |
| Events in quadrant B | 3,000,117 | 476,405 |
| Events in quadrant C | 2,719,979 | 463,097 |
| Events in quadrant D | 4,969,105 | 390,418 |
| Mode M0 | |||
|---|---|---|---|
| Quadrant | BADHDUFLAG | Total packets | Discarded packets |
| A | 0 | 13999 | 4 |
| B | 0 | 12505 | 1 |
| C | 0 | 11898 | 3 |
| D | 0 | 18664 | 1 |
| Mode SS | |||
|---|---|---|---|
| Quadrant | BADHDUFLAG | Total packets | Discarded packets |
| A | 0 | 116 | 0 |
| B | 0 | 116 | 0 |
| C | 0 | 116 | 0 |
| D | 0 | 116 | 0 |
| Mode M9 | |||
|---|---|---|---|
| Quadrant | BADHDUFLAG | Total packets | Discarded packets |
| A | 0 | 13 | 0 |
| B | 0 | 13 | 0 |
| C | 0 | 13 | 0 |
| D | 0 | 13 | 0 |
| Quadrant | Total seconds | Saturated seconds | Saturation percentage |
|---|---|---|---|
| A | 5689 | 172 | 3.023378% |
| B | 5690 | 43 | 0.755712% |
| C | 5689 | 13 | 0.228511% |
| D | 5690 | 736 | 12.934974% |
Noise dominated data is calculated using 1-second bins in cleaned event files. If a bin has >2000 counts, and if more than 50% of those come from <1% of pixels, then it is considered to be noise-dominated and hence unusable.
| Quadrant | # 1 sec bins | Bins with >0 counts | Bins with >2000 counts | High rate bins dominated by noise | Noise dominated (total time) | Noise dominated (detector-on time) | Marked lightcurve |
|---|---|---|---|---|---|---|---|
| A | 6980 | 5691 | 126 | 126 | 1.81% | 2.21% | 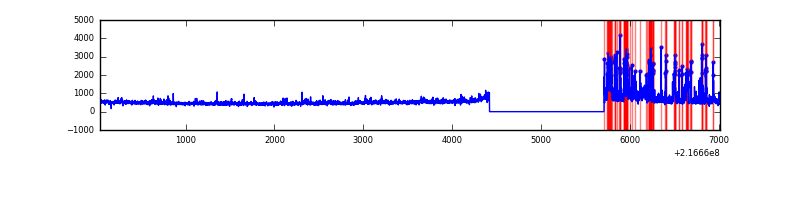 |
| B | 6980 | 5691 | 14 | 14 | 0.20% | 0.25% | 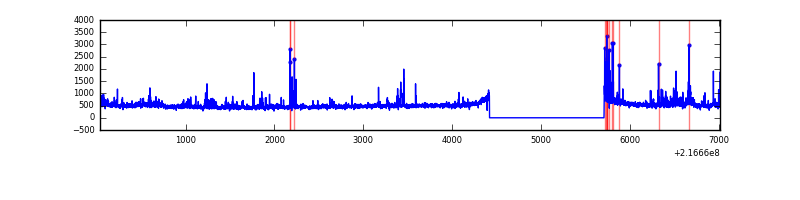 |
| C | 6980 | 5691 | 4 | 4 | 0.06% | 0.07% | 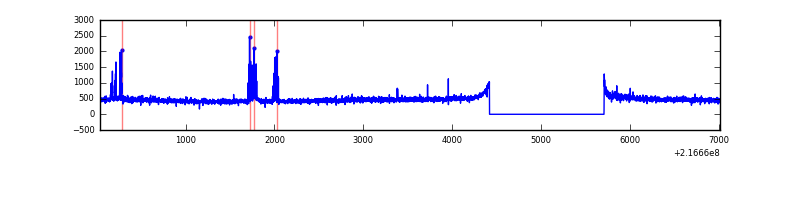 |
| D | 6980 | 5691 | 715 | 715 | 10.24% | 12.56% |  |
Top three noisy pixels from each quadrant. If the there are fewer than three noisy pixels in the level2.evt file, extra rows are filled as -1
| Pixel properties | Quadrant properties | ||||||
|---|---|---|---|---|---|---|---|
| Quadrant | DetID | PixID | Counts | Sigma | Mean | Median | Sigma |
| A | 8 | 15 | 782048 | 5650.61 | 672 | 659 | 138.3 |
| A | 4 | 2 | 78972 | 566.32 | 672 | 659 | 138.3 |
| A | 14 | 111 | 22732 | 159.62 | 672 | 659 | 138.3 |
| B | 3 | 64 | 137340 | 1035.49 | 691 | 676 | 132.0 |
| B | 15 | 204 | 64727 | 485.31 | 691 | 676 | 132.0 |
| B | 0 | 245 | 43503 | 324.49 | 691 | 676 | 132.0 |
| C | 9 | 16 | 90447 | 579.01 | 664 | 670 | 155.1 |
| C | 1 | 16 | 33002 | 208.52 | 664 | 670 | 155.1 |
| C | 4 | 222 | 5586 | 31.71 | 664 | 670 | 155.1 |
| D | 11 | 241 | 2453953 | 15685.24 | 630 | 610 | 156.4 |
| D | 2 | 33 | 33021 | 207.21 | 630 | 610 | 156.4 |
| D | 8 | 195 | 26028 | 162.5 | 630 | 610 | 156.4 |
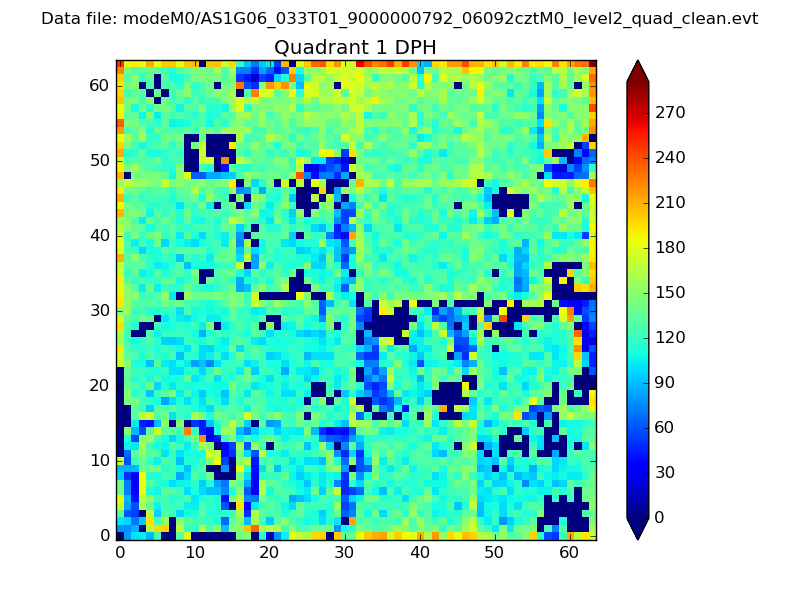
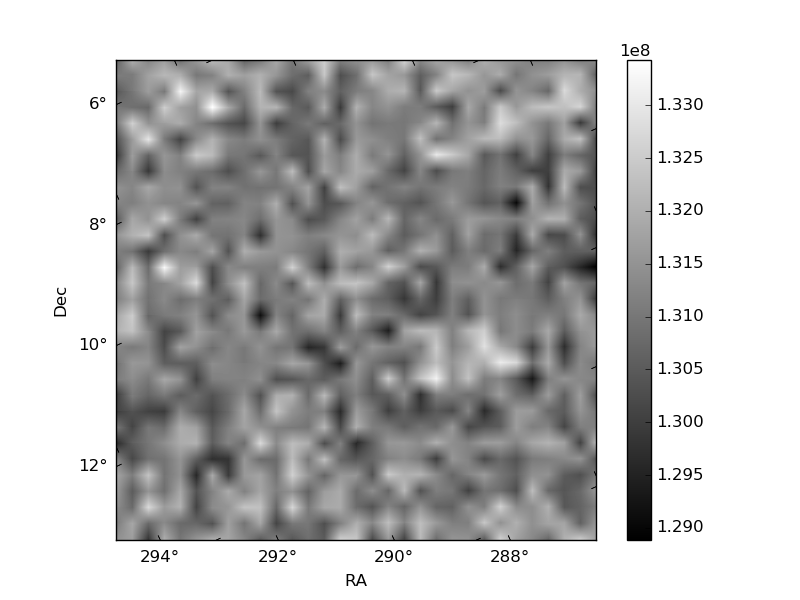
Histogram calculated using DETX and DETY for each event in the final _common_clean file
| Quadrant A | 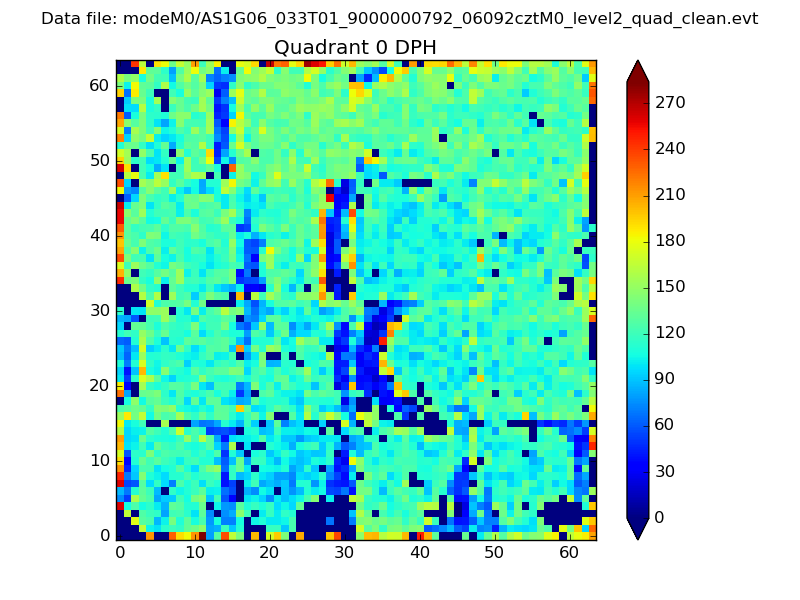 |
 |
Quadrant B |
|---|---|---|---|
| Quadrant D | 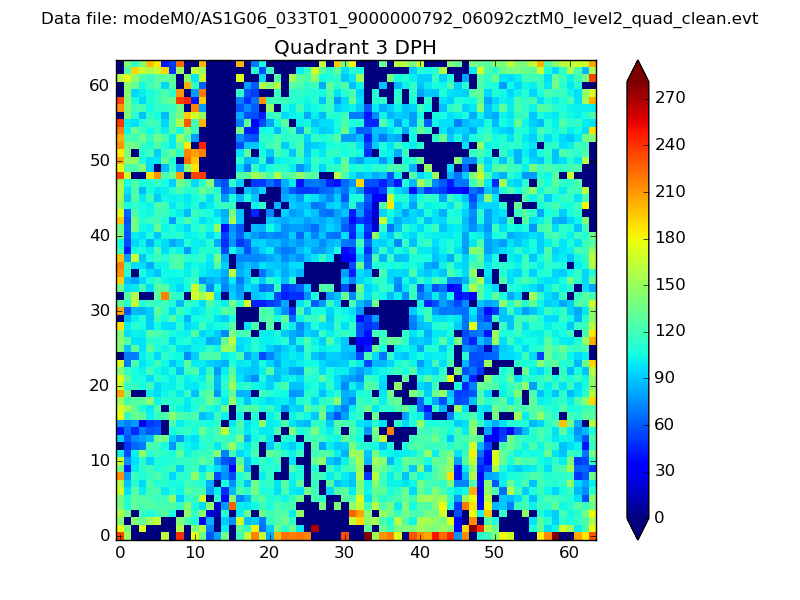 |
 |
Quadrant C |
| Plot type | Count rate plots | Images |
|---|---|---|
| Comparison with Poisson distribution Blue bars denote a histogram of data divided into 1 sec bins. Red curve is a Poisson curve with rate = median count rate of data. |
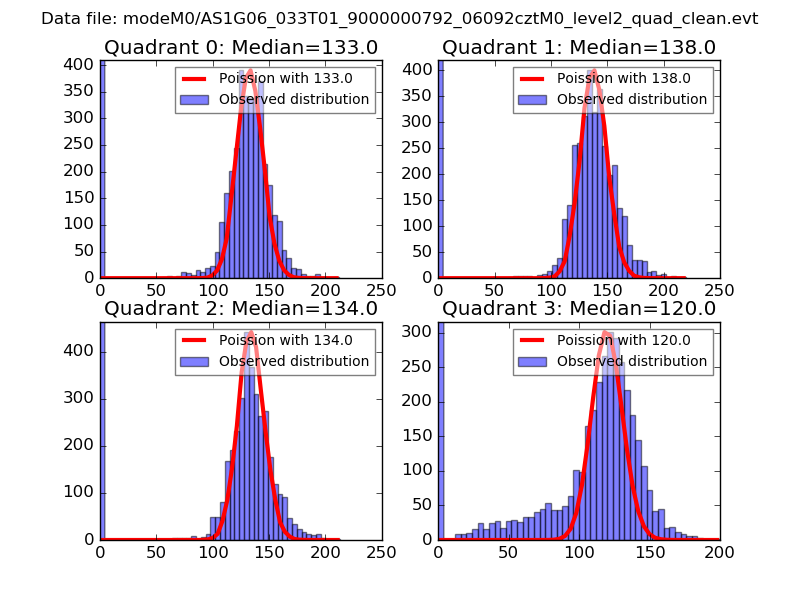 |
 |
| Quadrant-wise count rates Data is divided into 100 sec bins |
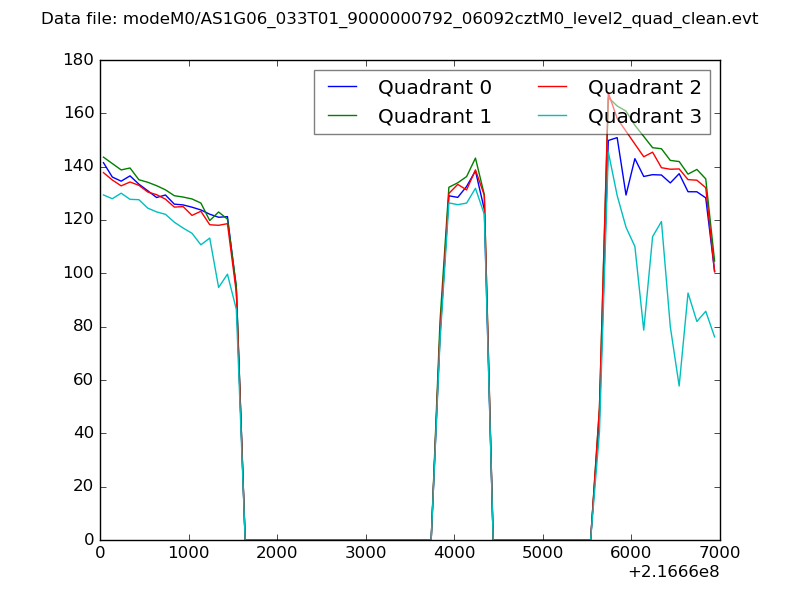 |
|
| Module-wise count rates for Quadrant A Data is divided into 100 sec bins |
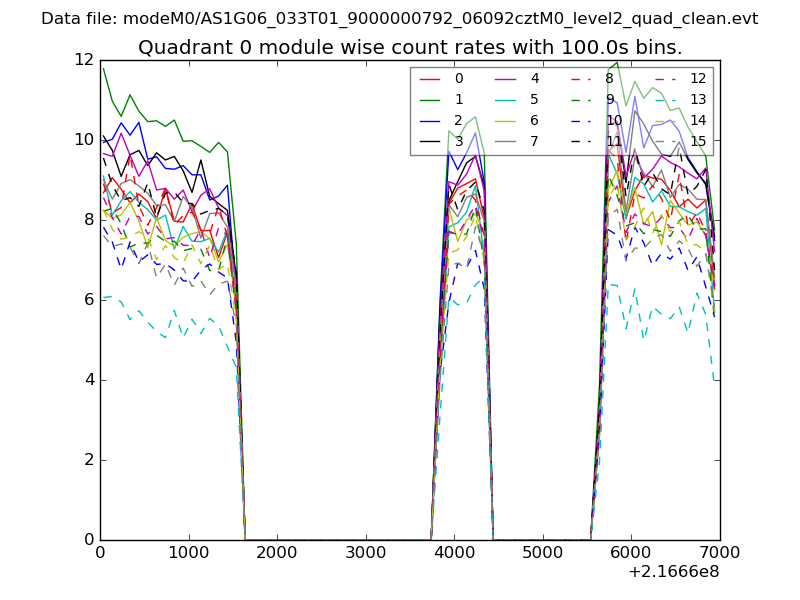 |
 |
| Module-wise count rates for Quadrant B Data is divided into 100 sec bins |
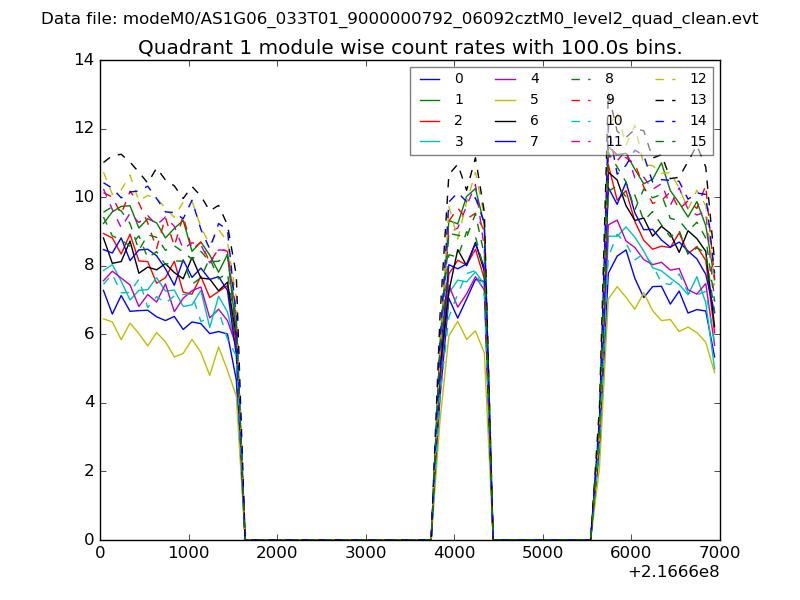 |
 |
| Module-wise count rates for Quadrant C Data is divided into 100 sec bins |
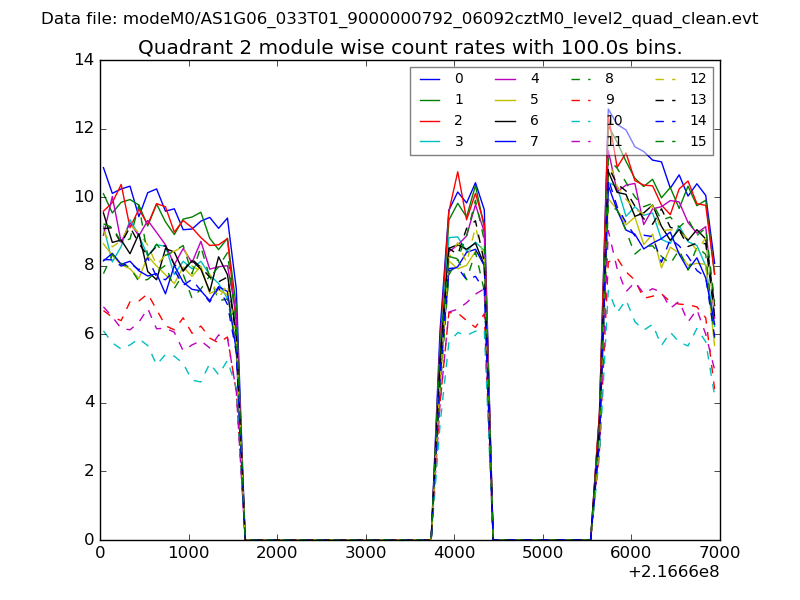 |
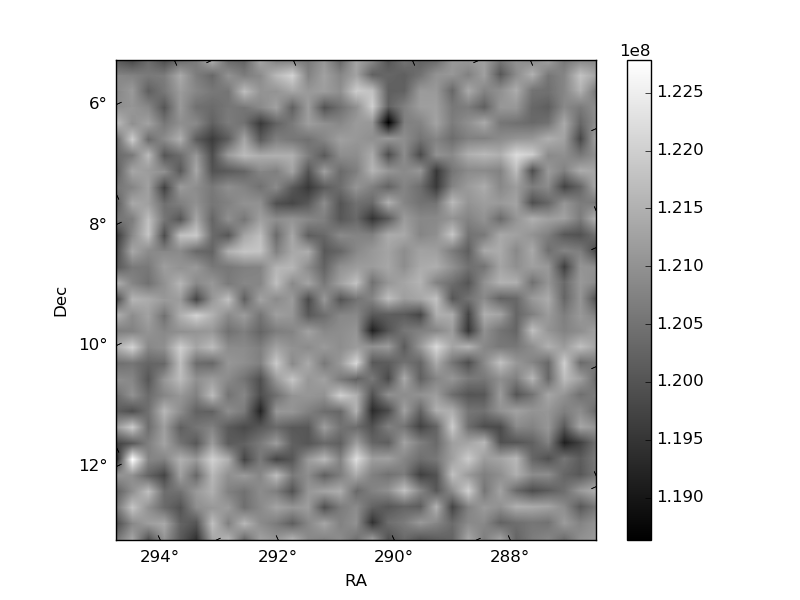 |
| Module-wise count rates for Quadrant D Data is divided into 100 sec bins |
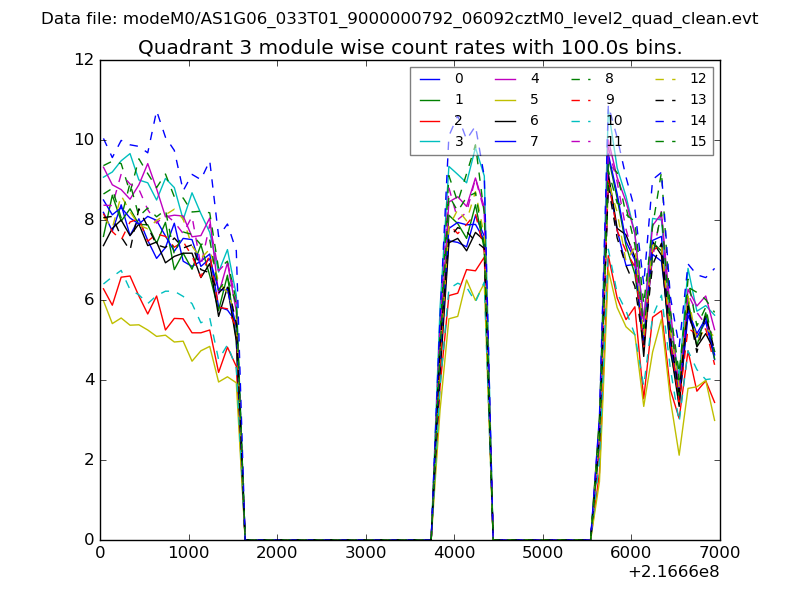 |
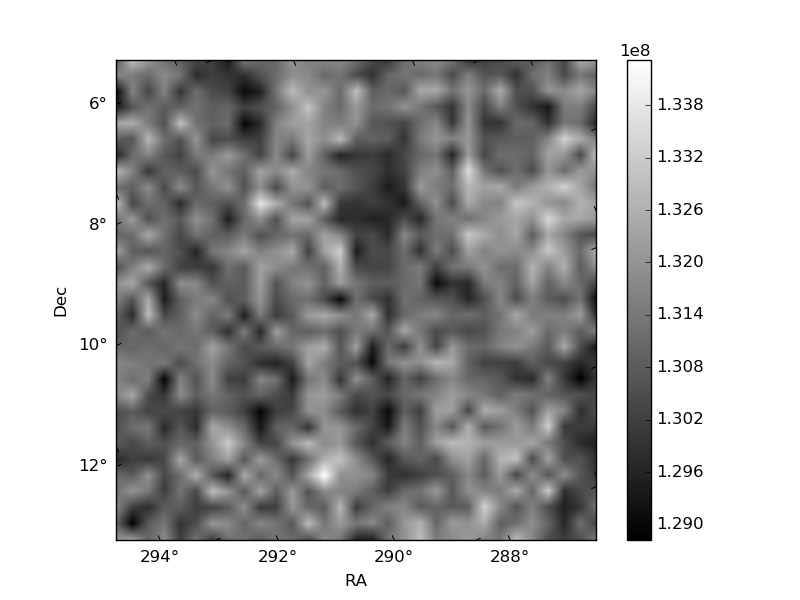 |
| Parameter | Plot |
|---|---|
| CZT HV Monitor | 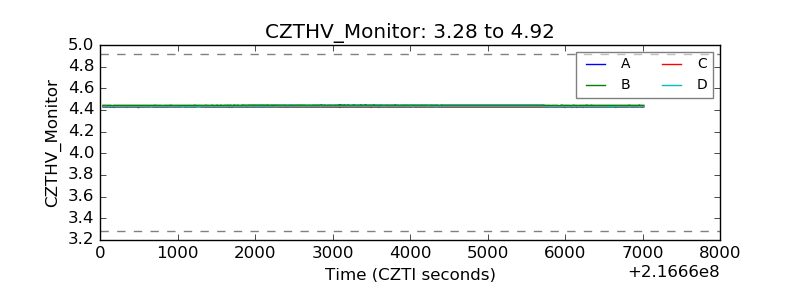 |
| D_VDD | 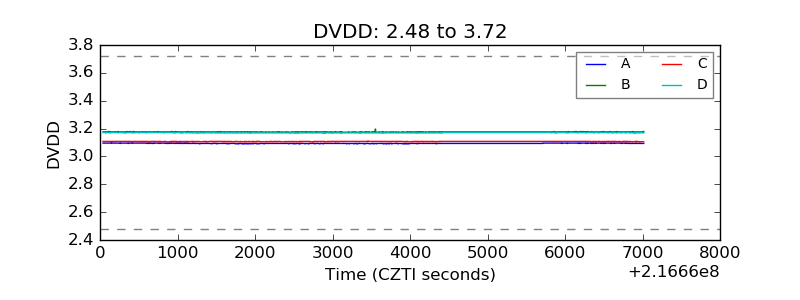 |
| Temperature 1 | 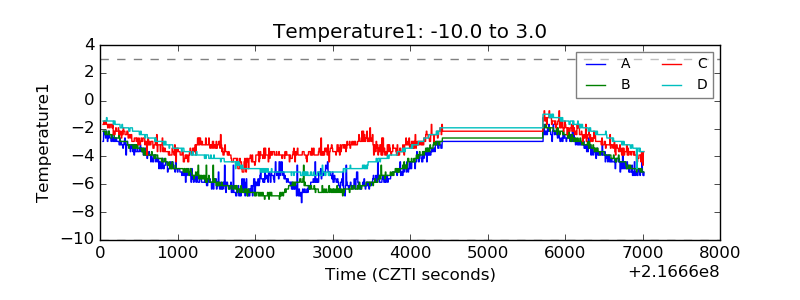 |
| Veto HV Monitor | 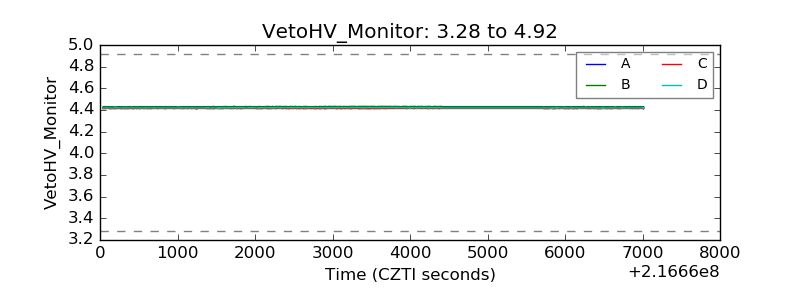 |
| Veto LLD | 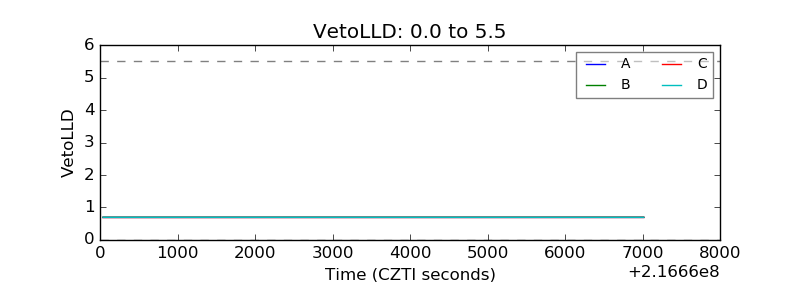 |
| Alpha Counter | 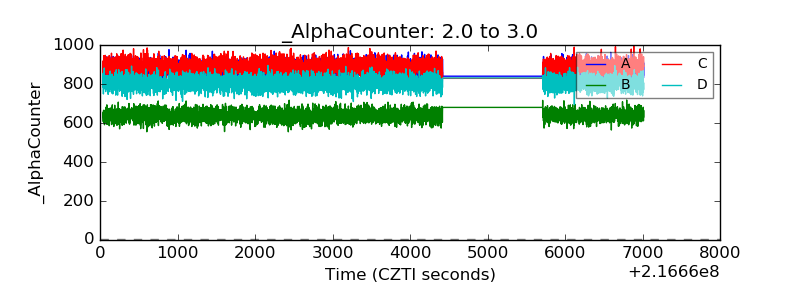 |
| _CPM_Rate | 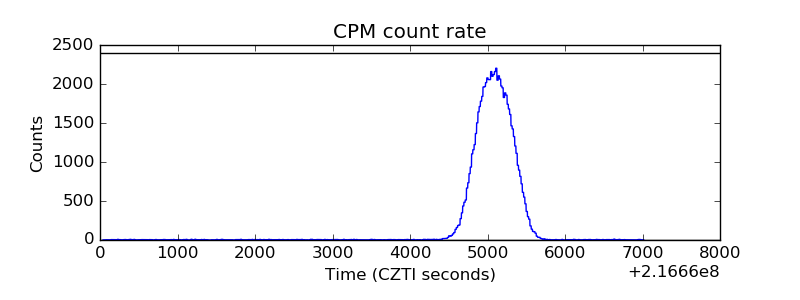 |
| CZT Counter | 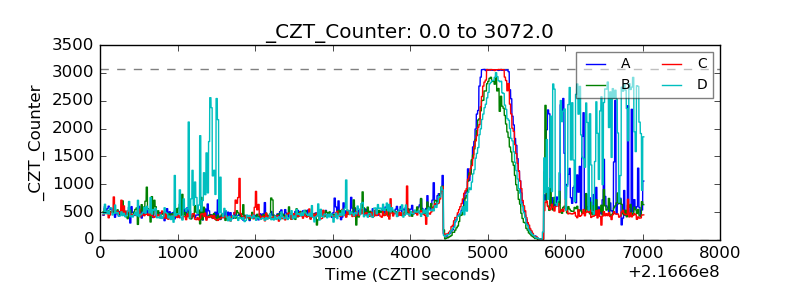 |
| +2.5 Volts monitor |  |
| +5 Volts monitor | 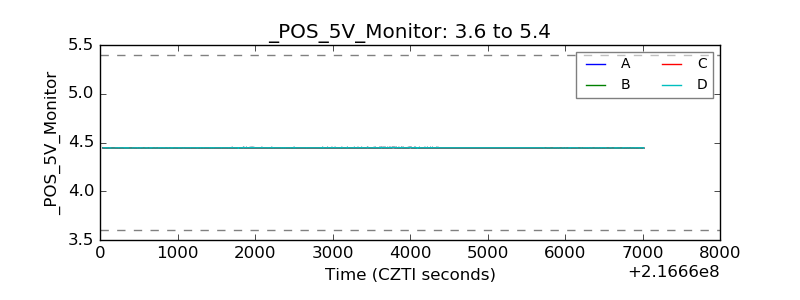 |
| _ROLL_ROT | 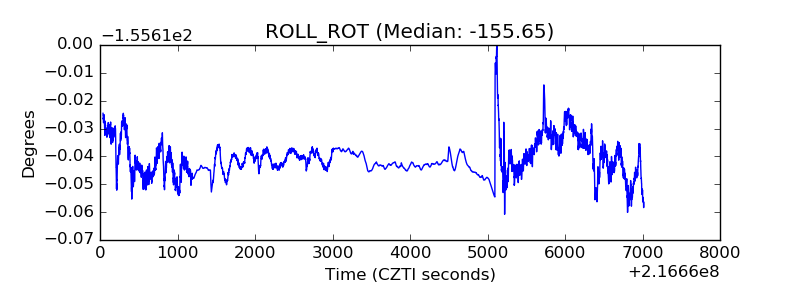 |
| _Roll_DEC | 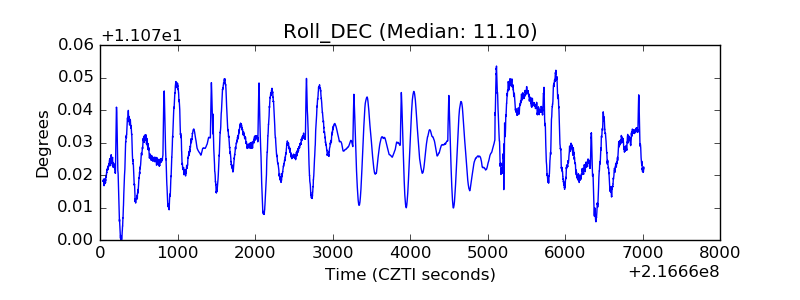 |
| _Roll_RA | 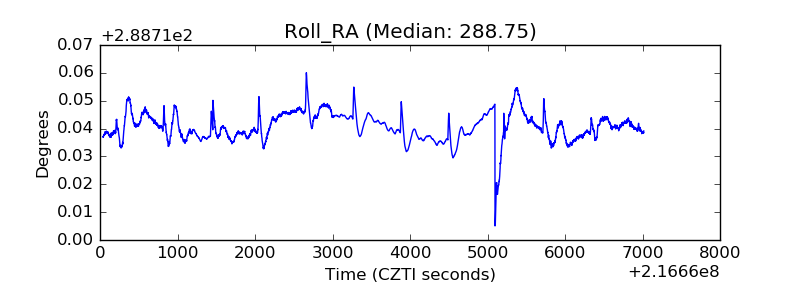 |
| Veto Counter | 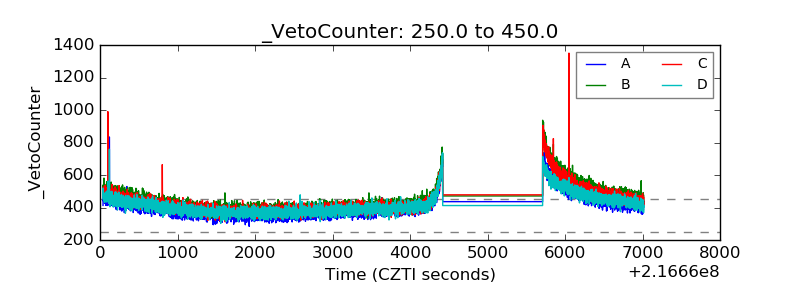 |