| Param | Original file | Final file |
|---|---|---|
| Filename | modeM0/AS1G06_033T01_9000000792_06095cztM0_level2.evt | modeM0/AS1G06_033T01_9000000792_06095cztM0_level2_quad_clean.evt |
| Size (bytes) | 515,954,880 | 72,728,640 |
| Size | 492.1 MB | 69.4 MB |
| Events in quadrant A | 5,442,667 | 426,345 |
| Events in quadrant B | 3,585,832 | 447,846 |
| Events in quadrant C | 3,044,766 | 443,127 |
| Events in quadrant D | 3,101,733 | 421,265 |
| Mode M0 | |||
|---|---|---|---|
| Quadrant | BADHDUFLAG | Total packets | Discarded packets |
| A | 0 | 20675 | 2 |
| B | 0 | 15012 | 1 |
| C | 0 | 13637 | 1 |
| D | 0 | 13957 | 1 |
| Mode SS | |||
|---|---|---|---|
| Quadrant | BADHDUFLAG | Total packets | Discarded packets |
| A | 0 | 134 | 0 |
| B | 0 | 134 | 0 |
| C | 0 | 134 | 0 |
| D | 0 | 134 | 0 |
| Mode M9 | |||
|---|---|---|---|
| Quadrant | BADHDUFLAG | Total packets | Discarded packets |
| A | 0 | 11 | 0 |
| B | 0 | 11 | 0 |
| C | 0 | 11 | 0 |
| D | 0 | 11 | 0 |
| Quadrant | Total seconds | Saturated seconds | Saturation percentage |
|---|---|---|---|
| A | 6651 | 257 | 3.864081% |
| B | 6651 | 111 | 1.668922% |
| C | 6651 | 24 | 0.360848% |
| D | 6651 | 35 | 0.526237% |
Noise dominated data is calculated using 1-second bins in cleaned event files. If a bin has >2000 counts, and if more than 50% of those come from <1% of pixels, then it is considered to be noise-dominated and hence unusable.
| Quadrant | # 1 sec bins | Bins with >0 counts | Bins with >2000 counts | High rate bins dominated by noise | Noise dominated (total time) | Noise dominated (detector-on time) | Marked lightcurve |
|---|---|---|---|---|---|---|---|
| A | 7776 | 6652 | 86 | 86 | 1.11% | 1.29% | 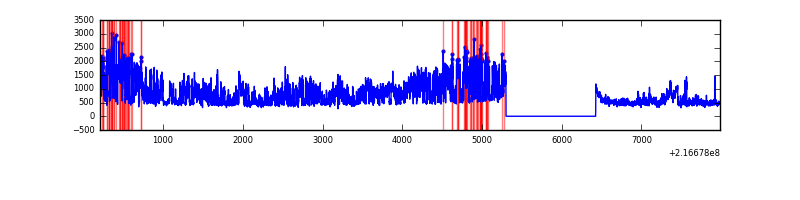 |
| B | 7776 | 6652 | 68 | 68 | 0.87% | 1.02% | 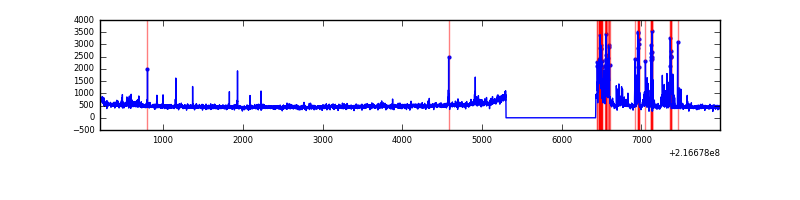 |
| C | 7776 | 6652 | 1 | 1 | 0.01% | 0.02% | 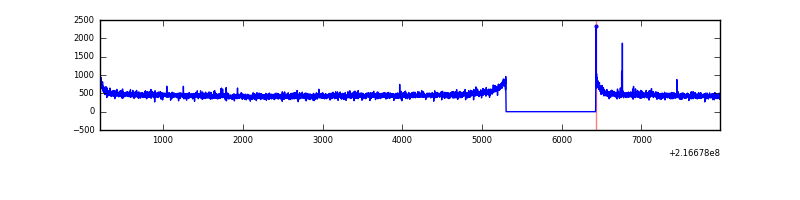 |
| D | 7776 | 6652 | 12 | 12 | 0.15% | 0.18% | 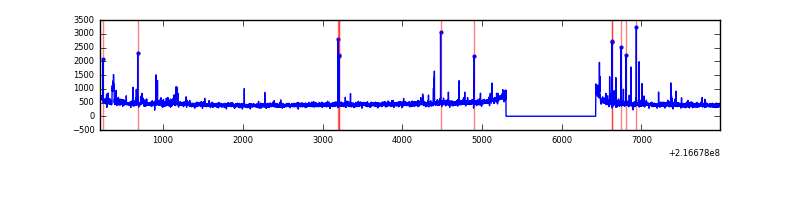 |
Top three noisy pixels from each quadrant. If the there are fewer than three noisy pixels in the level2.evt file, extra rows are filled as -1
| Pixel properties | Quadrant properties | ||||||
|---|---|---|---|---|---|---|---|
| Quadrant | DetID | PixID | Counts | Sigma | Mean | Median | Sigma |
| A | 8 | 15 | 2380001 | 14968.26 | 776 | 759 | 159.0 |
| A | 0 | 50 | 66948 | 416.41 | 776 | 759 | 159.0 |
| A | 12 | 194 | 7621 | 43.17 | 776 | 759 | 159.0 |
| B | 3 | 64 | 379922 | 2504.6 | 794 | 777 | 151.4 |
| B | 15 | 204 | 36402 | 235.34 | 794 | 777 | 151.4 |
| B | 0 | 219 | 31070 | 200.11 | 794 | 777 | 151.4 |
| C | 1 | 16 | 31659 | 171.62 | 771 | 774 | 180.0 |
| C | 13 | 61 | 6227 | 30.3 | 771 | 774 | 180.0 |
| C | 9 | 16 | 6135 | 29.79 | 771 | 774 | 180.0 |
| D | 2 | 33 | 48701 | 251.69 | 766 | 741 | 190.6 |
| D | 8 | 195 | 43716 | 225.53 | 766 | 741 | 190.6 |
| D | 5 | 97 | 30082 | 153.98 | 766 | 741 | 190.6 |
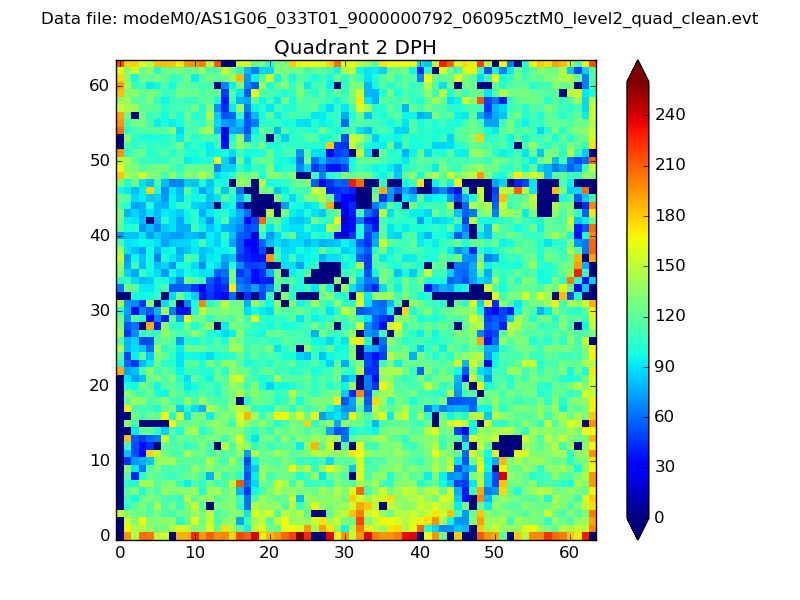
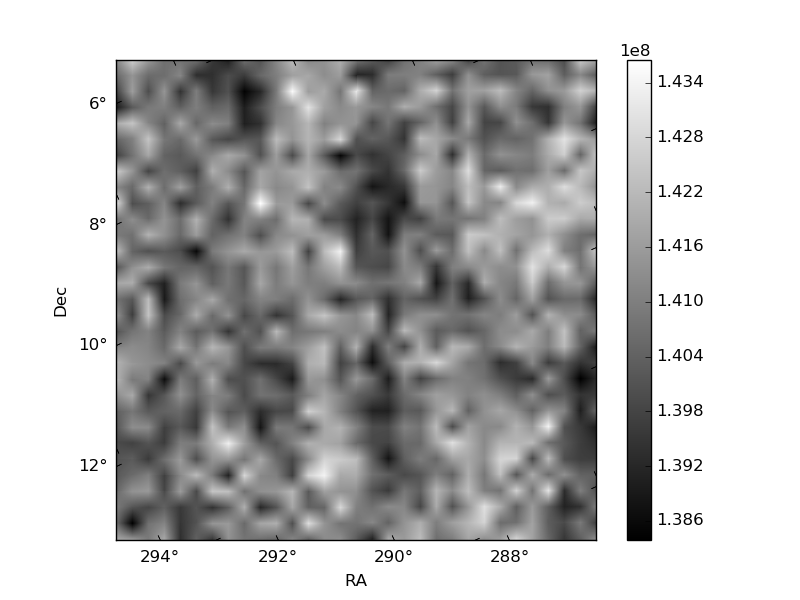
Histogram calculated using DETX and DETY for each event in the final _common_clean file
| Quadrant A | 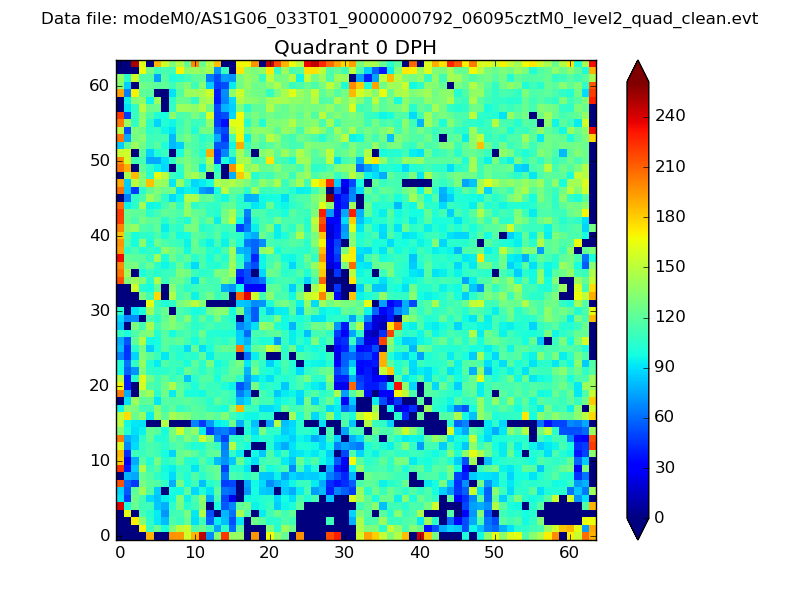 |
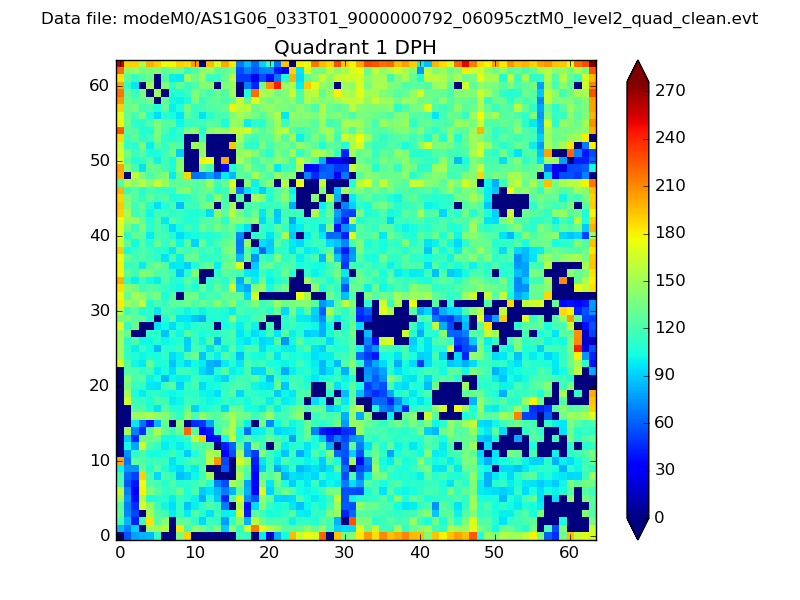 |
Quadrant B |
|---|---|---|---|
| Quadrant D | 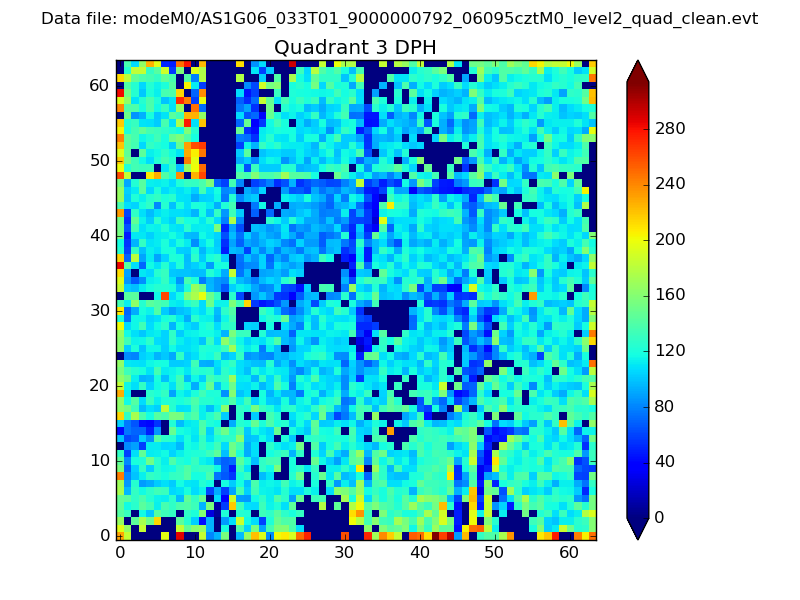 |
 |
Quadrant C |
| Plot type | Count rate plots | Images |
|---|---|---|
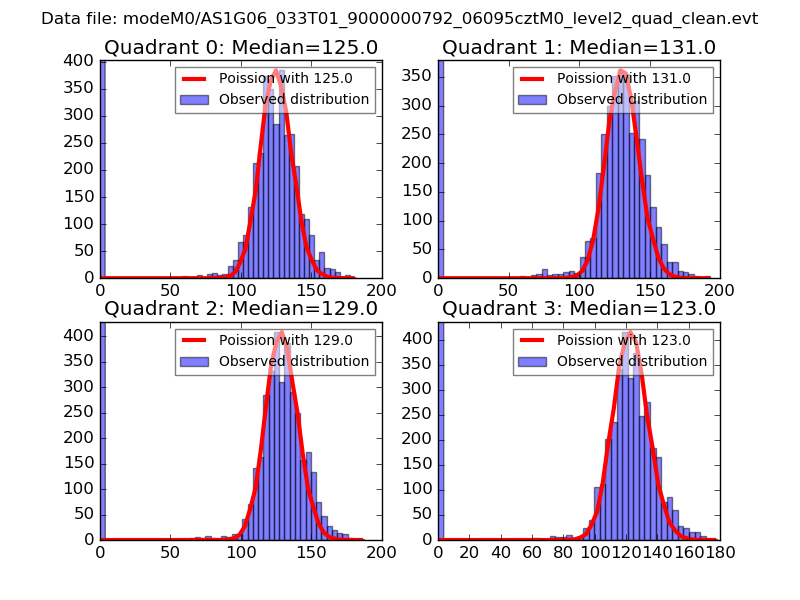
| Comparison with Poisson distribution Blue bars denote a histogram of data divided into 1 sec bins. Red curve is a Poisson curve with rate = median count rate of data. |
 |
 |
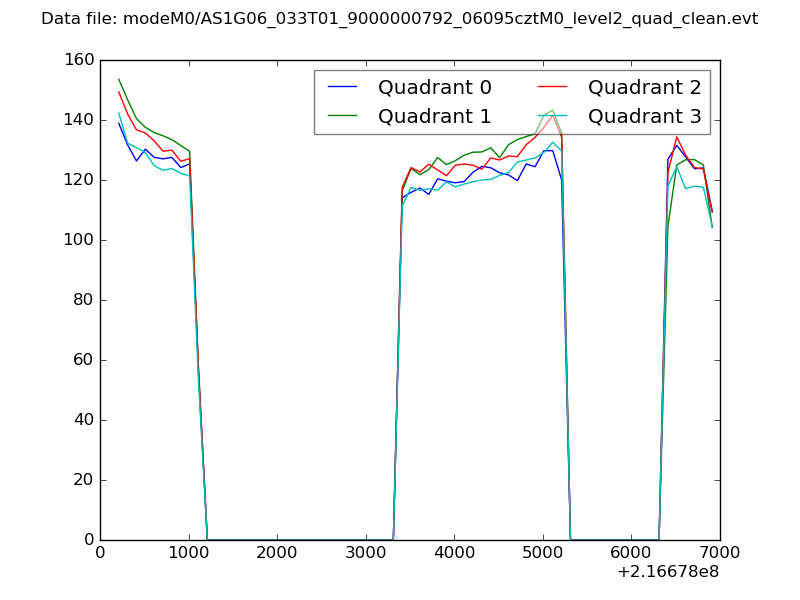
| Quadrant-wise count rates Data is divided into 100 sec bins |
 |
|
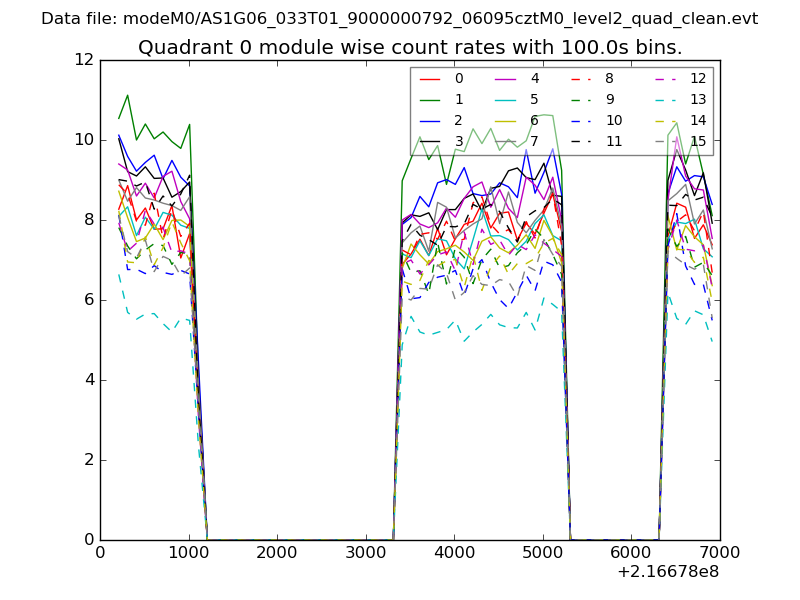
| Module-wise count rates for Quadrant A Data is divided into 100 sec bins |
 |
 |
| Module-wise count rates for Quadrant B Data is divided into 100 sec bins |
 |
 |
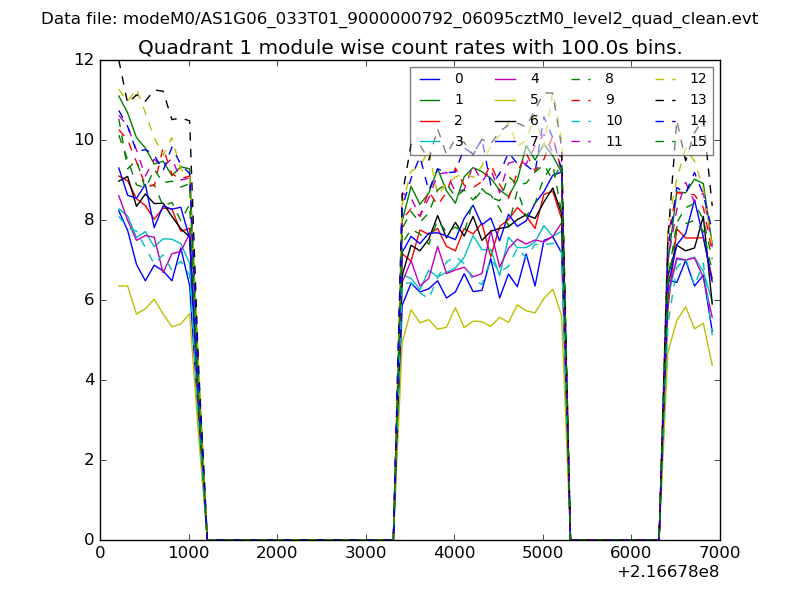
| Module-wise count rates for Quadrant C Data is divided into 100 sec bins |
 |
 |
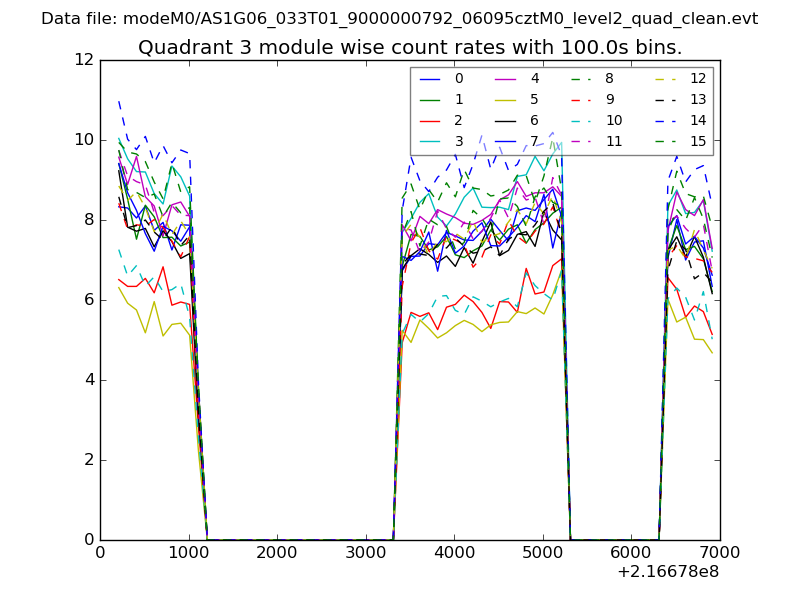
| Module-wise count rates for Quadrant D Data is divided into 100 sec bins |
 |
 |
| Parameter | Plot |
|---|---|
| CZT HV Monitor | 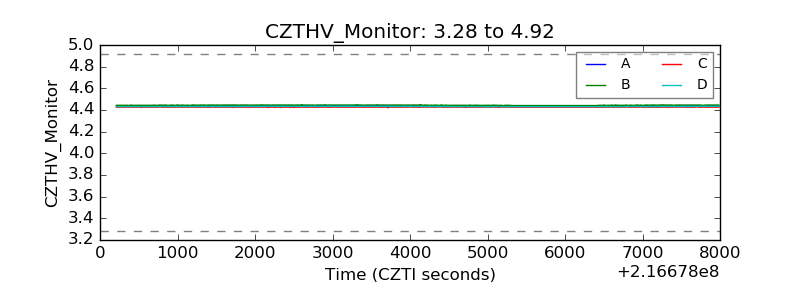 |
| D_VDD | 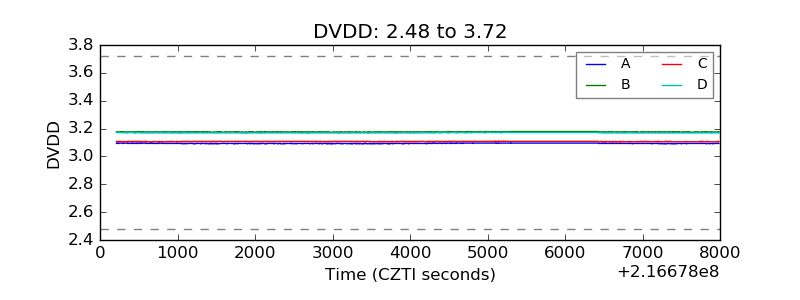 |
| Temperature 1 | 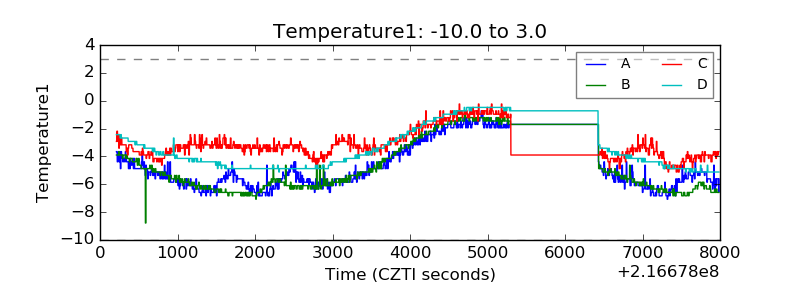 |
| Veto HV Monitor | 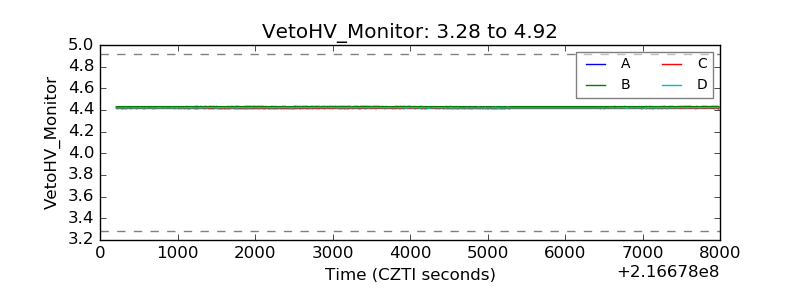 |
| Veto LLD | 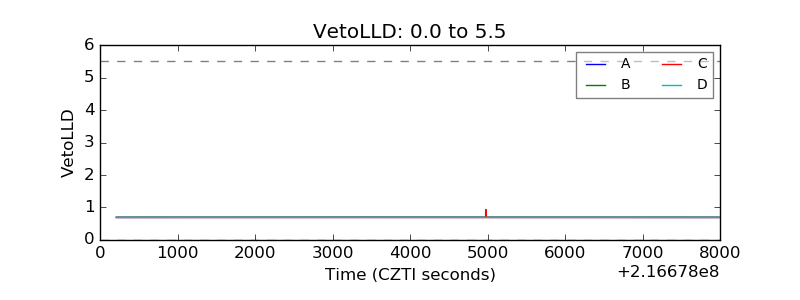 |
| Alpha Counter | 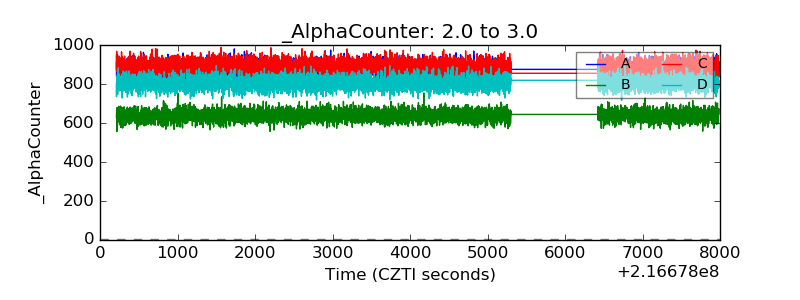 |
| _CPM_Rate | 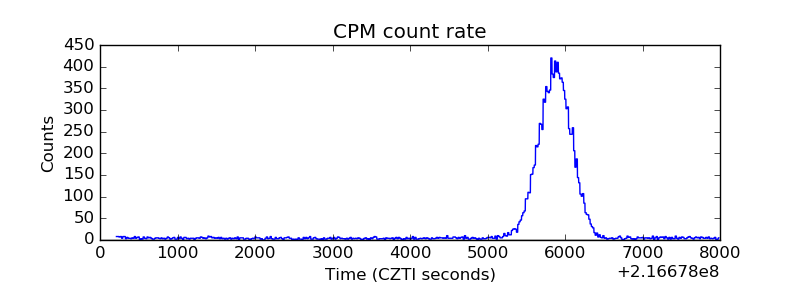 |
| CZT Counter | 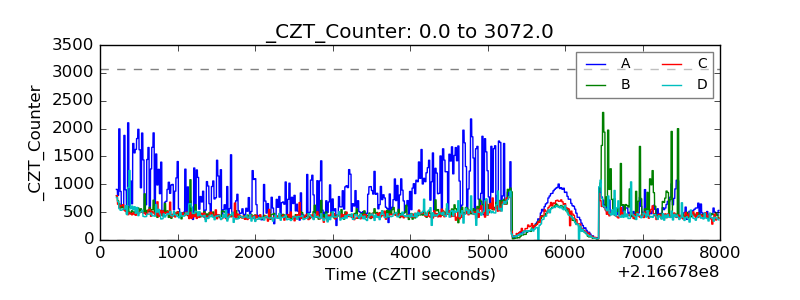 |
| +2.5 Volts monitor |  |
| +5 Volts monitor | 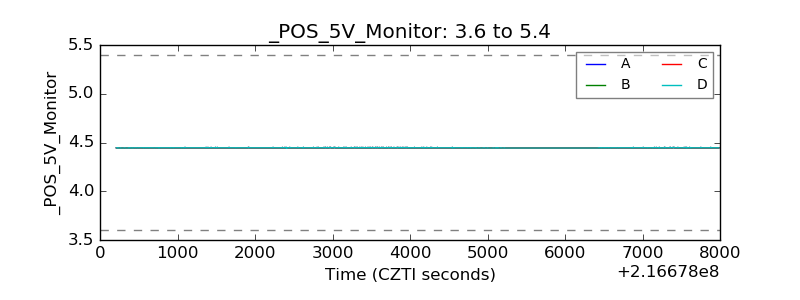 |
| _ROLL_ROT | 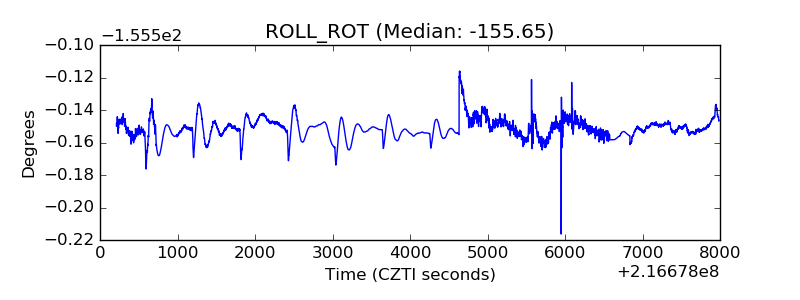 |
| _Roll_DEC | 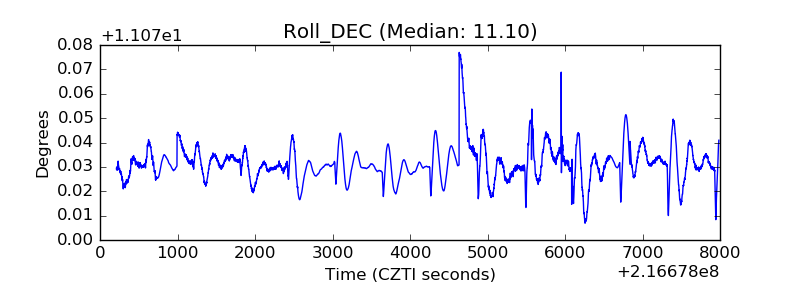 |
| _Roll_RA | 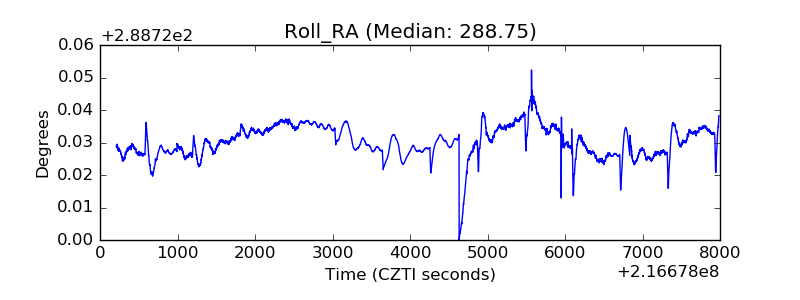 |
| Veto Counter | 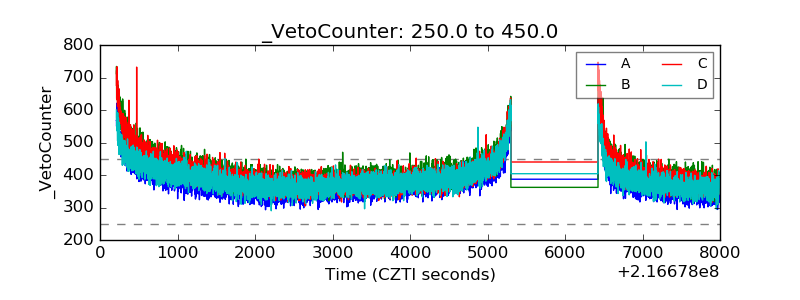 |