| Param | Original file | Final file |
|---|---|---|
| Filename | modeM0/AS1G06_033T01_9000000792_06096cztM0_level2.evt | modeM0/AS1G06_033T01_9000000792_06096cztM0_level2_quad_clean.evt |
| Size (bytes) | 451,823,040 | 63,020,160 |
| Size | 430.9 MB | 60.1 MB |
| Events in quadrant A | 3,474,381 | 365,153 |
| Events in quadrant B | 3,630,701 | 365,811 |
| Events in quadrant C | 2,968,250 | 365,359 |
| Events in quadrant D | 3,161,746 | 351,471 |
| Mode M0 | |||
|---|---|---|---|
| Quadrant | BADHDUFLAG | Total packets | Discarded packets |
| A | 0 | 14599 | 2 |
| B | 0 | 15186 | 1 |
| C | 0 | 13517 | 1 |
| D | 0 | 14347 | 1 |
| Mode SS | |||
|---|---|---|---|
| Quadrant | BADHDUFLAG | Total packets | Discarded packets |
| A | 0 | 134 | 0 |
| B | 0 | 134 | 0 |
| C | 0 | 134 | 0 |
| D | 0 | 134 | 0 |
| Mode M9 | |||
|---|---|---|---|
| Quadrant | BADHDUFLAG | Total packets | Discarded packets |
| A | 0 | 7 | 0 |
| B | 0 | 7 | 0 |
| C | 0 | 7 | 0 |
| D | 0 | 7 | 0 |
| Quadrant | Total seconds | Saturated seconds | Saturation percentage |
|---|---|---|---|
| A | 6597 | 98 | 1.485524% |
| B | 6597 | 186 | 2.819463% |
| C | 6597 | 52 | 0.788237% |
| D | 6597 | 66 | 1.000455% |
Noise dominated data is calculated using 1-second bins in cleaned event files. If a bin has >2000 counts, and if more than 50% of those come from <1% of pixels, then it is considered to be noise-dominated and hence unusable.
| Quadrant | # 1 sec bins | Bins with >0 counts | Bins with >2000 counts | High rate bins dominated by noise | Noise dominated (total time) | Noise dominated (detector-on time) | Marked lightcurve |
|---|---|---|---|---|---|---|---|
| A | 7362 | 6598 | 26 | 26 | 0.35% | 0.39% | 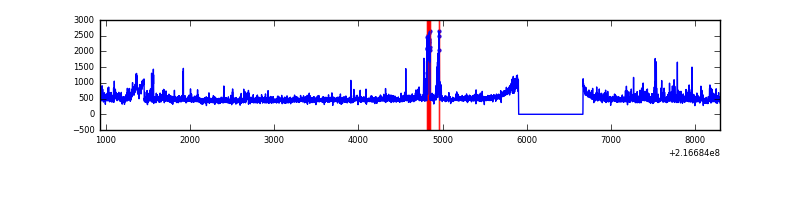 |
| B | 7362 | 6598 | 79 | 79 | 1.07% | 1.20% | 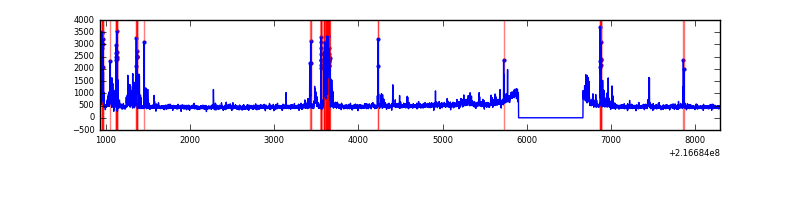 |
| C | 7362 | 6598 | 0 | 0 | 0.00% | 0.00% | 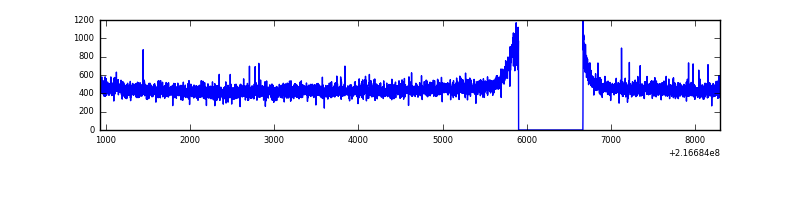 |
| D | 7362 | 6598 | 18 | 18 | 0.24% | 0.27% |  |
Top three noisy pixels from each quadrant. If the there are fewer than three noisy pixels in the level2.evt file, extra rows are filled as -1
| Pixel properties | Quadrant properties | ||||||
|---|---|---|---|---|---|---|---|
| Quadrant | DetID | PixID | Counts | Sigma | Mean | Median | Sigma |
| A | 8 | 15 | 448309 | 2791.57 | 767 | 749 | 160.3 |
| A | 0 | 50 | 66835 | 412.2 | 767 | 749 | 160.3 |
| A | 12 | 194 | 7371 | 41.3 | 767 | 749 | 160.3 |
| B | 3 | 64 | 469926 | 3148.81 | 773 | 754 | 149.0 |
| B | 15 | 204 | 54397 | 360.02 | 773 | 754 | 149.0 |
| B | 4 | 81 | 26049 | 169.77 | 773 | 754 | 149.0 |
| C | 1 | 16 | 32627 | 180.5 | 751 | 756 | 176.6 |
| C | 9 | 16 | 6306 | 31.43 | 751 | 756 | 176.6 |
| C | 13 | 61 | 6014 | 29.78 | 751 | 756 | 176.6 |
| D | 13 | 169 | 189294 | 1014.16 | 747 | 720 | 185.9 |
| D | 2 | 33 | 89895 | 479.59 | 747 | 720 | 185.9 |
| D | 8 | 195 | 28436 | 149.06 | 747 | 720 | 185.9 |
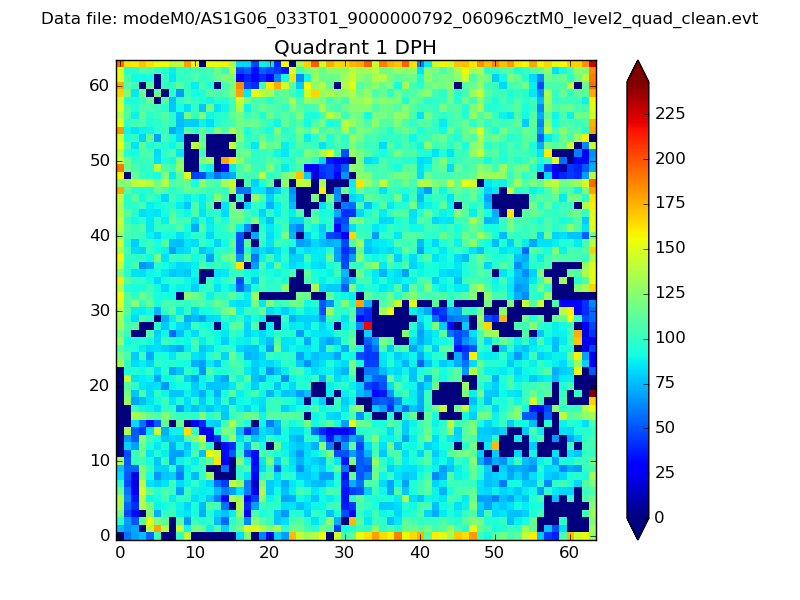
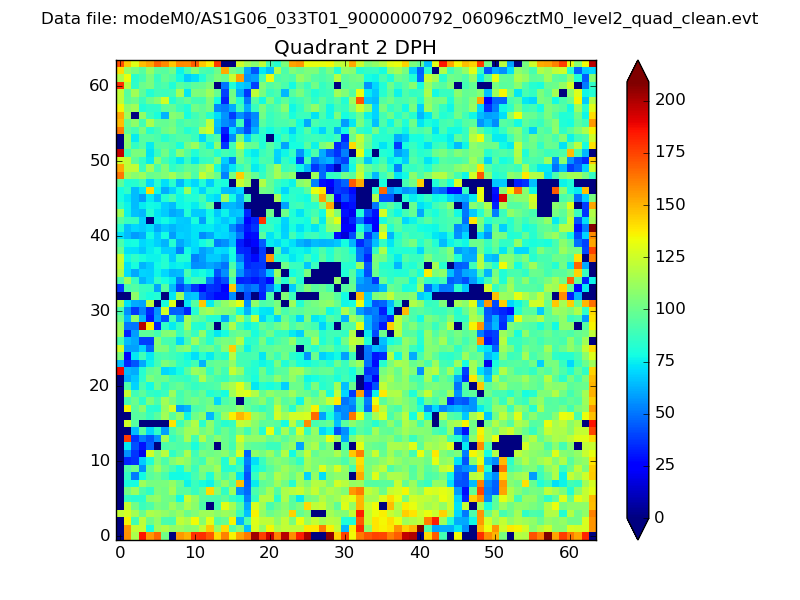
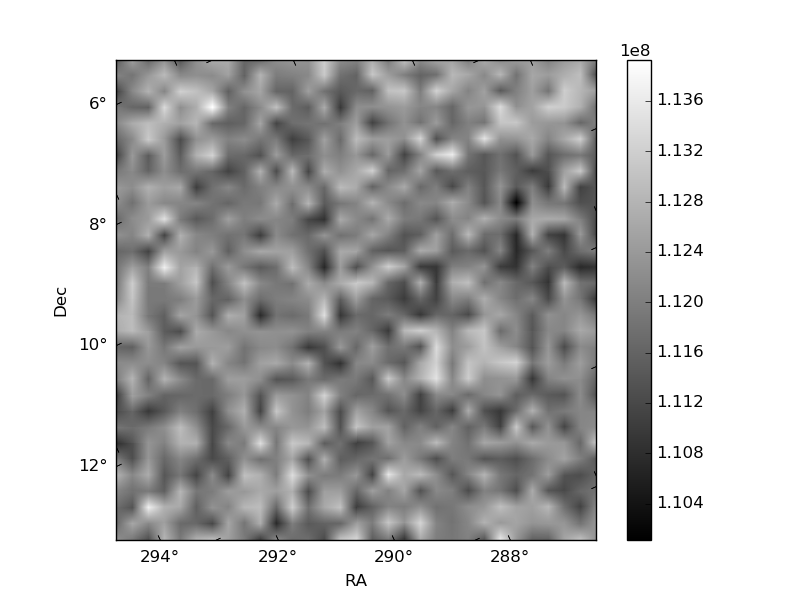
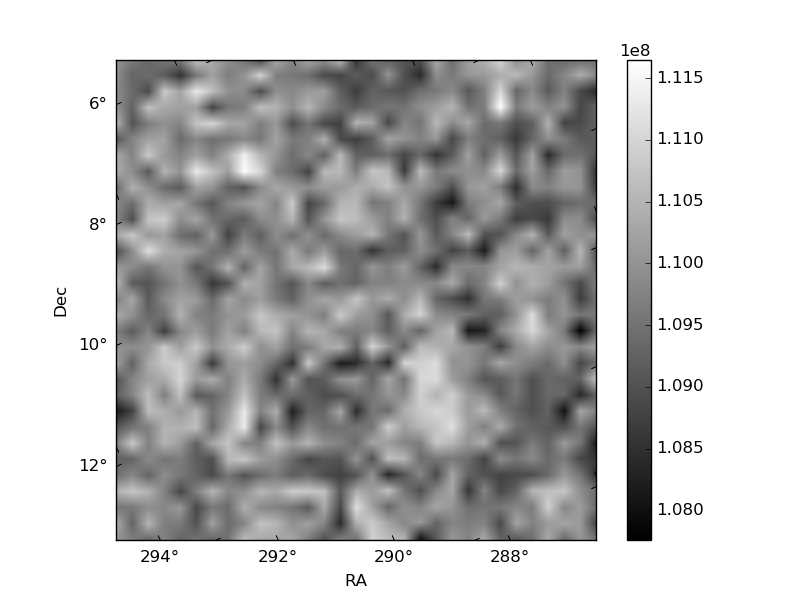
Histogram calculated using DETX and DETY for each event in the final _common_clean file
| Quadrant A | 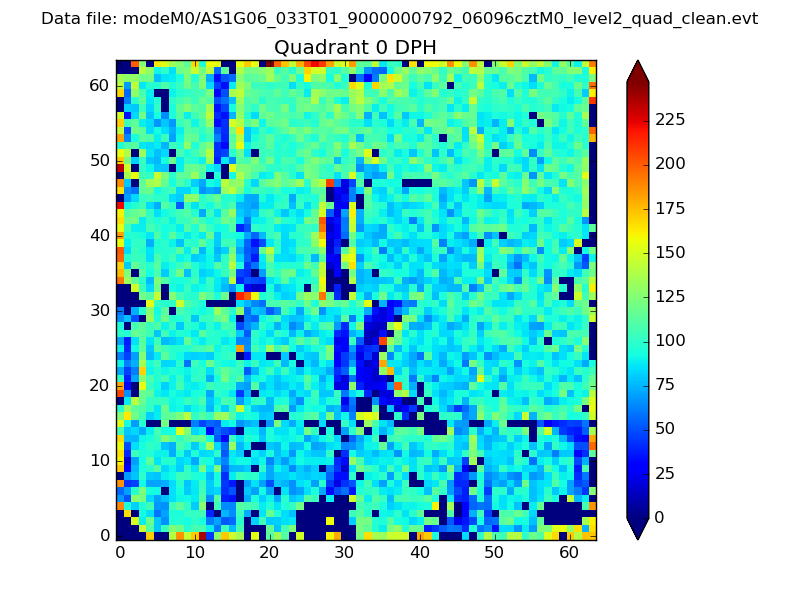 |
 |
Quadrant B |
|---|---|---|---|
| Quadrant D | 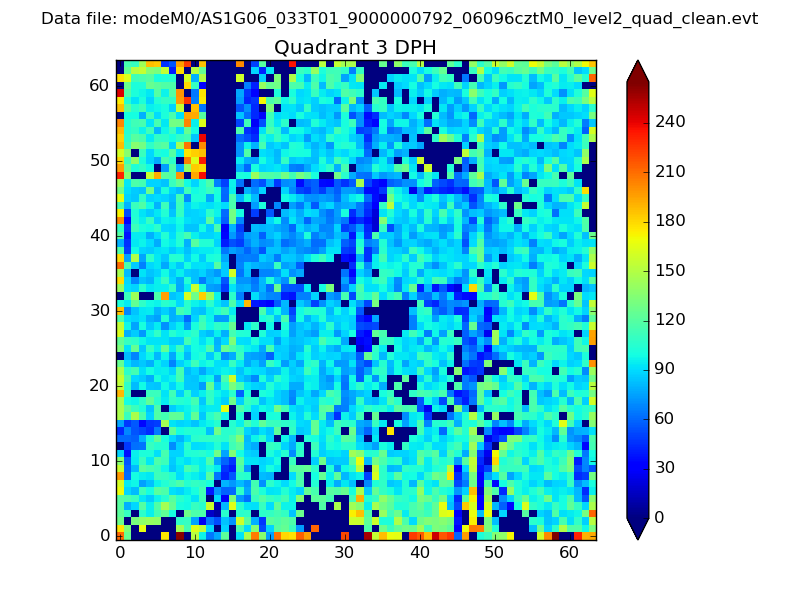 |
 |
Quadrant C |
| Plot type | Count rate plots | Images |
|---|---|---|
| Comparison with Poisson distribution Blue bars denote a histogram of data divided into 1 sec bins. Red curve is a Poisson curve with rate = median count rate of data. |
 |
 |
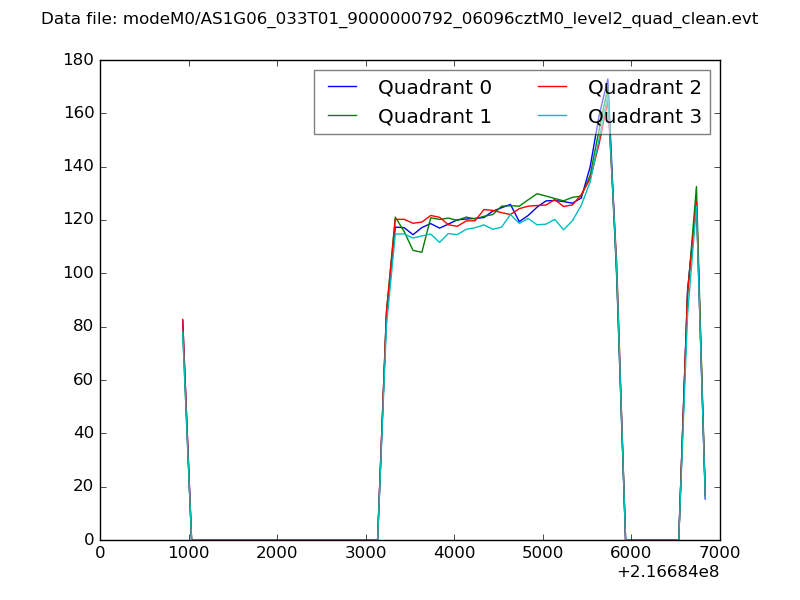
| Quadrant-wise count rates Data is divided into 100 sec bins |
 |
|
| Module-wise count rates for Quadrant A Data is divided into 100 sec bins |
 |
 |
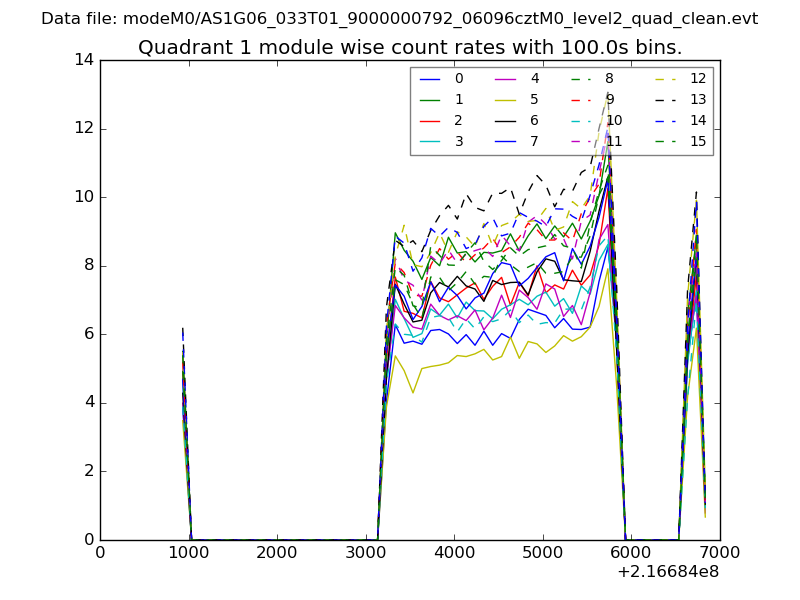
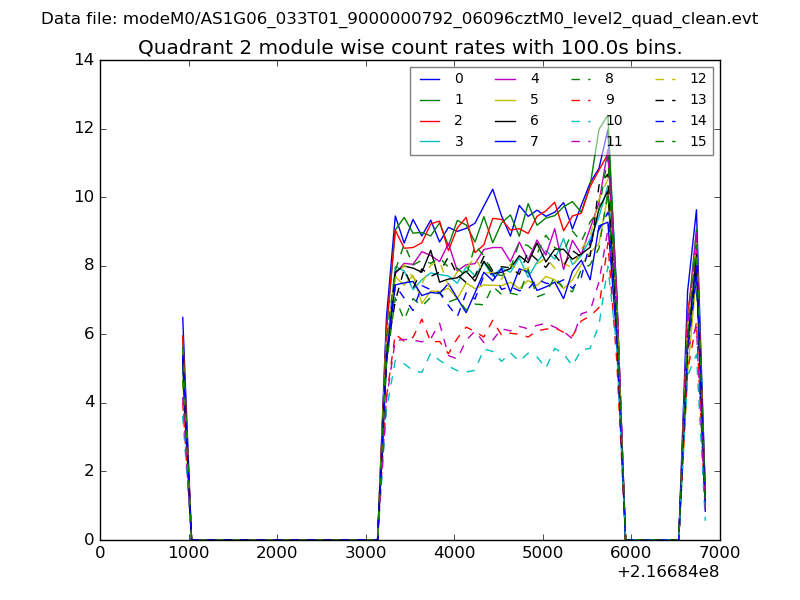
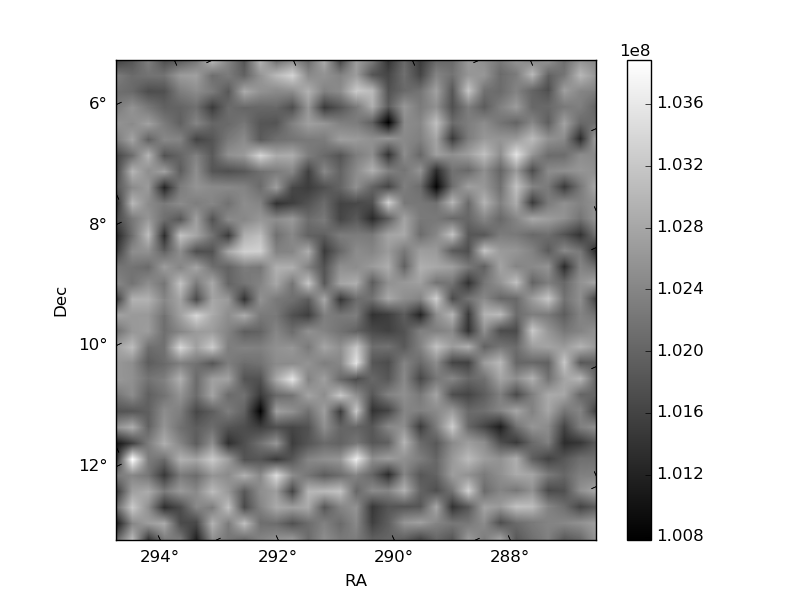
| Module-wise count rates for Quadrant B Data is divided into 100 sec bins |
 |
 |
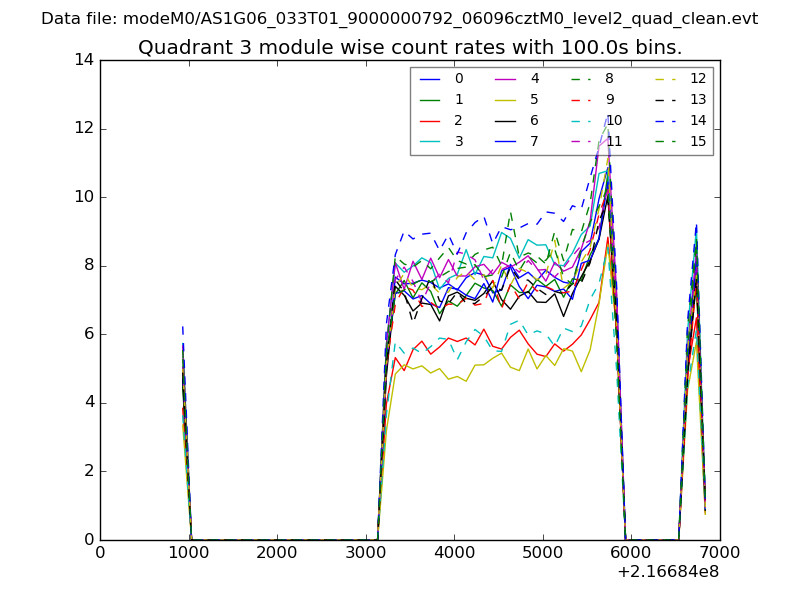
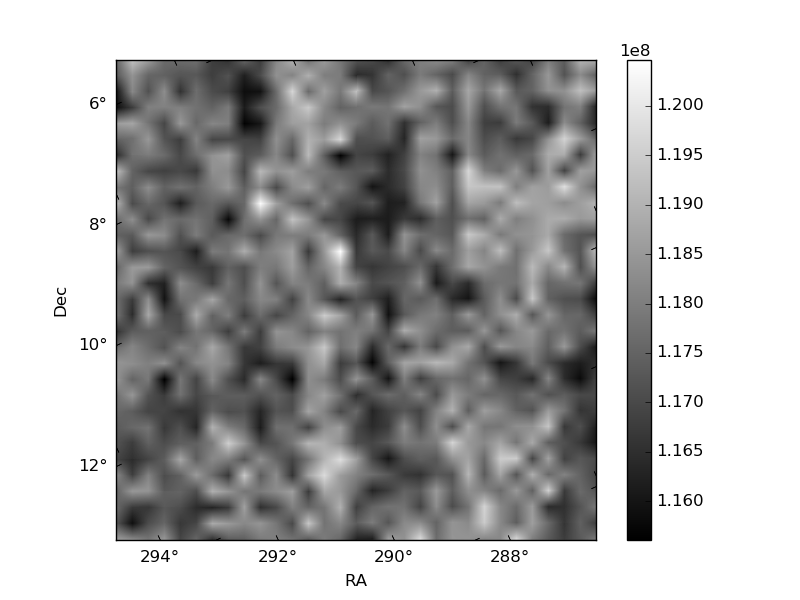
| Module-wise count rates for Quadrant C Data is divided into 100 sec bins |
 |
 |
| Module-wise count rates for Quadrant D Data is divided into 100 sec bins |
 |
 |
| Parameter | Plot |
|---|---|
| CZT HV Monitor | 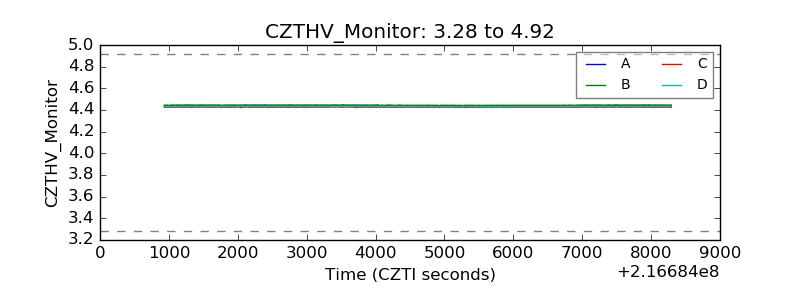 |
| D_VDD | 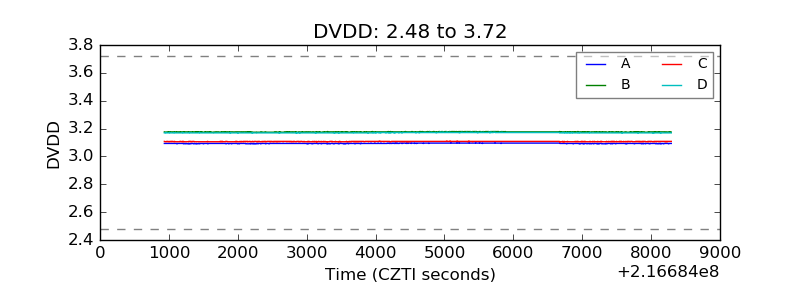 |
| Temperature 1 | 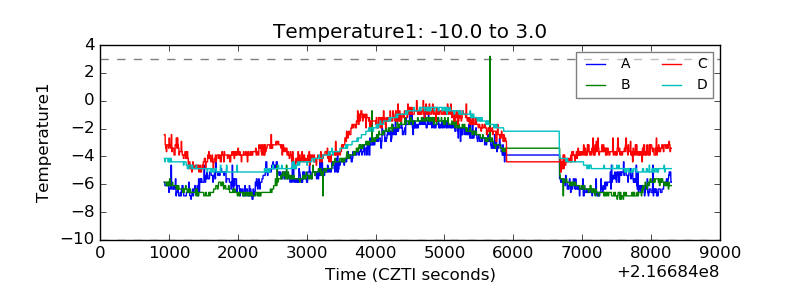 |
| Veto HV Monitor | 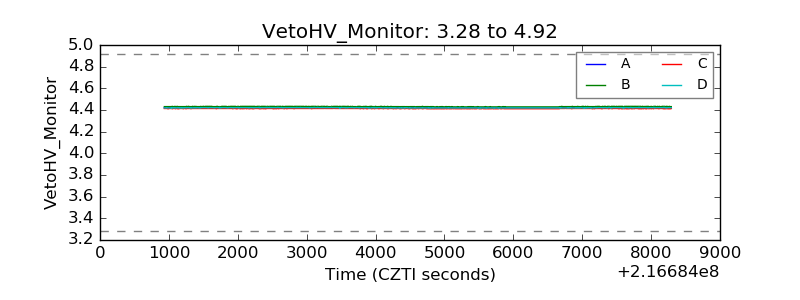 |
| Veto LLD | 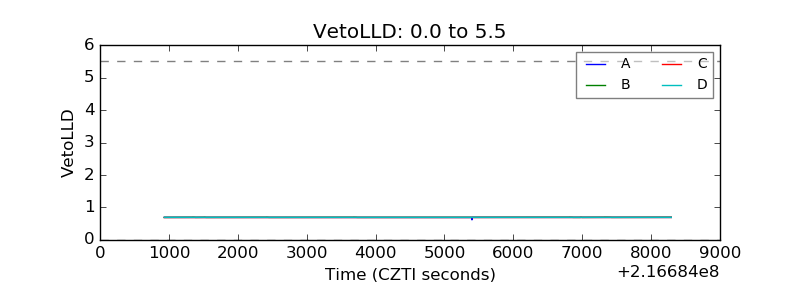 |
| Alpha Counter | 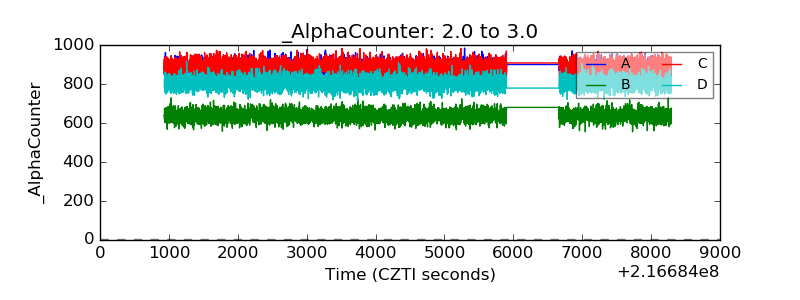 |
| _CPM_Rate | 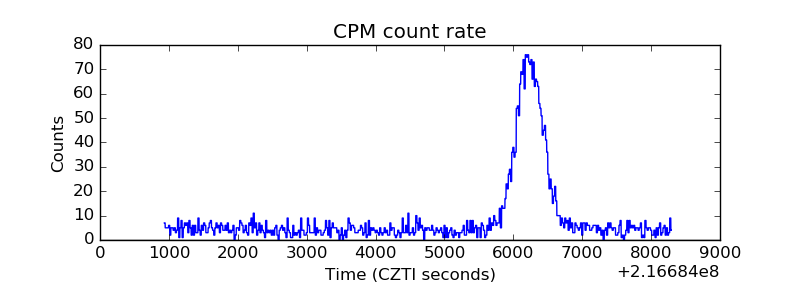 |
| CZT Counter | 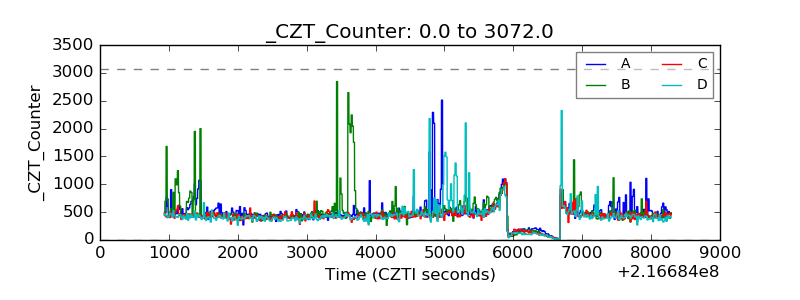 |
| +2.5 Volts monitor |  |
| +5 Volts monitor | 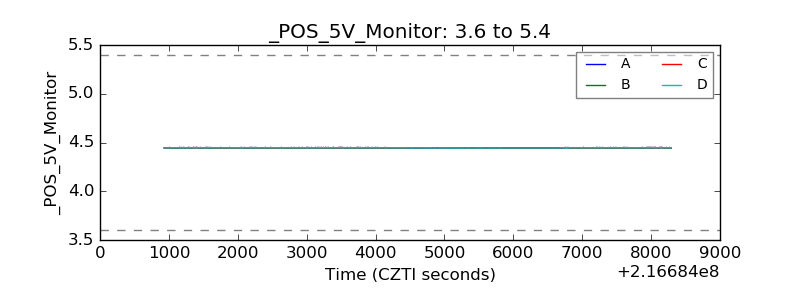 |
| _ROLL_ROT | 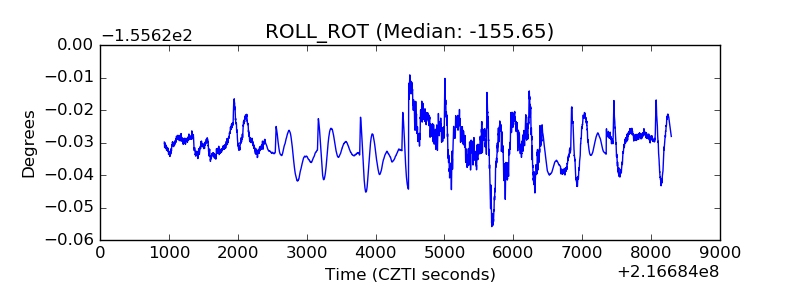 |
| _Roll_DEC |  |
| _Roll_RA | 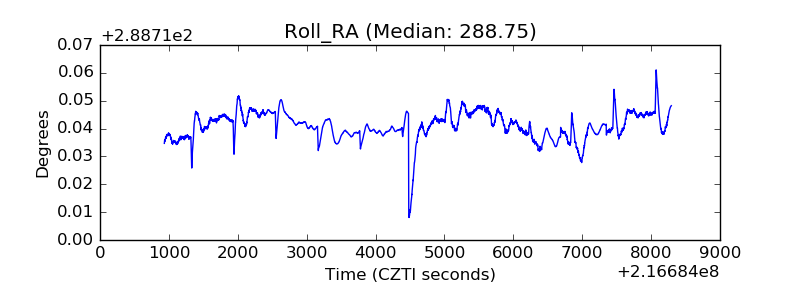 |
| Veto Counter | 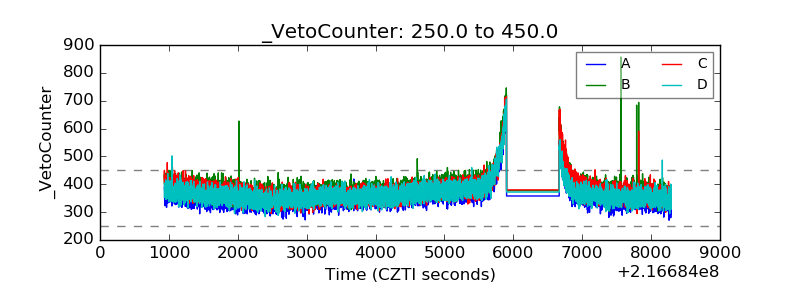 |