| Param | Original file | Final file |
|---|---|---|
| Filename | modeM0/AS1G06_033T01_9000000792_06098cztM0_level2.evt | modeM0/AS1G06_033T01_9000000792_06098cztM0_level2_quad_clean.evt |
| Size (bytes) | 522,550,080 | 72,714,240 |
| Size | 498.3 MB | 69.3 MB |
| Events in quadrant A | 4,377,540 | 418,817 |
| Events in quadrant B | 3,861,860 | 426,596 |
| Events in quadrant C | 3,436,876 | 423,576 |
| Events in quadrant D | 3,637,929 | 408,742 |
| Mode M0 | |||
|---|---|---|---|
| Quadrant | BADHDUFLAG | Total packets | Discarded packets |
| A | 0 | 17885 | 10 |
| B | 0 | 16378 | 11 |
| C | 0 | 15558 | 2 |
| D | 0 | 16057 | 10 |
| Mode SS | |||
|---|---|---|---|
| Quadrant | BADHDUFLAG | Total packets | Discarded packets |
| A | 0 | 150 | 0 |
| B | 0 | 150 | 0 |
| C | 0 | 150 | 0 |
| D | 0 | 150 | 0 |
| Quadrant | Total seconds | Saturated seconds | Saturation percentage |
|---|---|---|---|
| A | 7531 | 217 | 2.881423% |
| B | 7530 | 231 | 3.067729% |
| C | 7534 | 76 | 1.008760% |
| D | 7530 | 90 | 1.195219% |
Noise dominated data is calculated using 1-second bins in cleaned event files. If a bin has >2000 counts, and if more than 50% of those come from <1% of pixels, then it is considered to be noise-dominated and hence unusable.
| Quadrant | # 1 sec bins | Bins with >0 counts | Bins with >2000 counts | High rate bins dominated by noise | Noise dominated (total time) | Noise dominated (detector-on time) | Marked lightcurve |
|---|---|---|---|---|---|---|---|
| A | 7535 | 7535 | 5 | 5 | 0.07% | 0.07% | 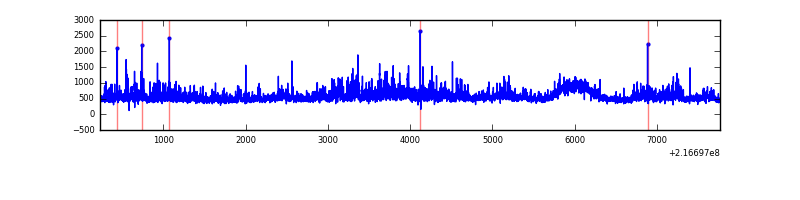 |
| B | 7535 | 7535 | 16 | 16 | 0.21% | 0.21% | 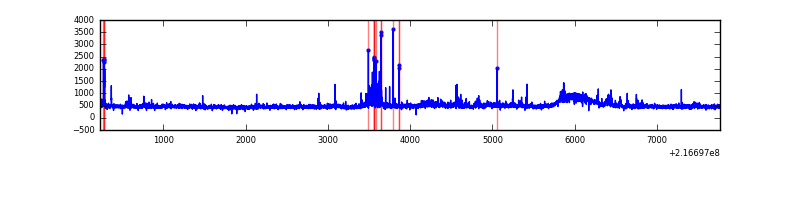 |
| C | 7535 | 7535 | 0 | 0 | 0.00% | 0.00% | 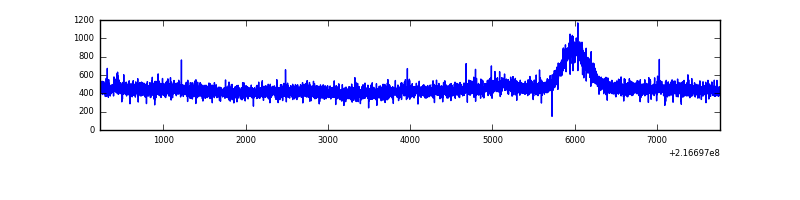 |
| D | 7535 | 7535 | 11 | 11 | 0.15% | 0.15% | 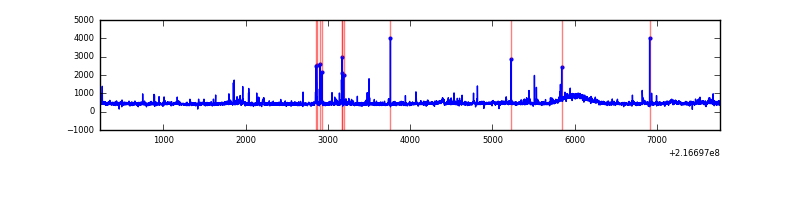 |
Top three noisy pixels from each quadrant. If the there are fewer than three noisy pixels in the level2.evt file, extra rows are filled as -1
| Pixel properties | Quadrant properties | ||||||
|---|---|---|---|---|---|---|---|
| Quadrant | DetID | PixID | Counts | Sigma | Mean | Median | Sigma |
| A | 8 | 15 | 960485 | 5192.9 | 887 | 867 | 184.8 |
| A | 0 | 226 | 8585 | 41.77 | 887 | 867 | 184.8 |
| A | 12 | 194 | 8537 | 41.51 | 887 | 867 | 184.8 |
| B | 10 | 245 | 96515 | 548.48 | 902 | 878 | 174.4 |
| B | 4 | 81 | 74043 | 419.6 | 902 | 878 | 174.4 |
| B | 15 | 204 | 48356 | 272.29 | 902 | 878 | 174.4 |
| C | 8 | 128 | 16021 | 74.18 | 870 | 874 | 204.2 |
| C | 8 | 112 | 8775 | 38.69 | 870 | 874 | 204.2 |
| C | 1 | 16 | 7757 | 33.71 | 870 | 874 | 204.2 |
| D | 1 | 239 | 67192 | 306.27 | 868 | 840 | 216.6 |
| D | 2 | 206 | 57018 | 259.31 | 868 | 840 | 216.6 |
| D | 14 | 173 | 52486 | 238.39 | 868 | 840 | 216.6 |
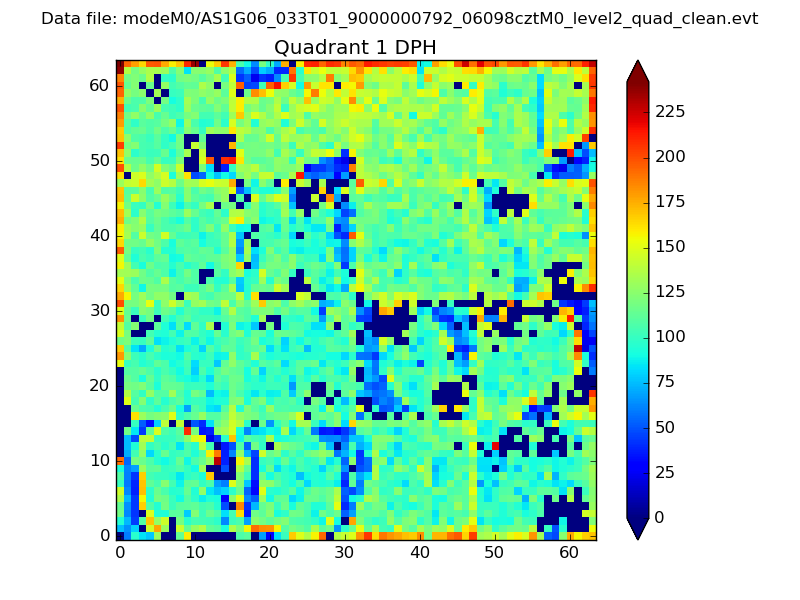
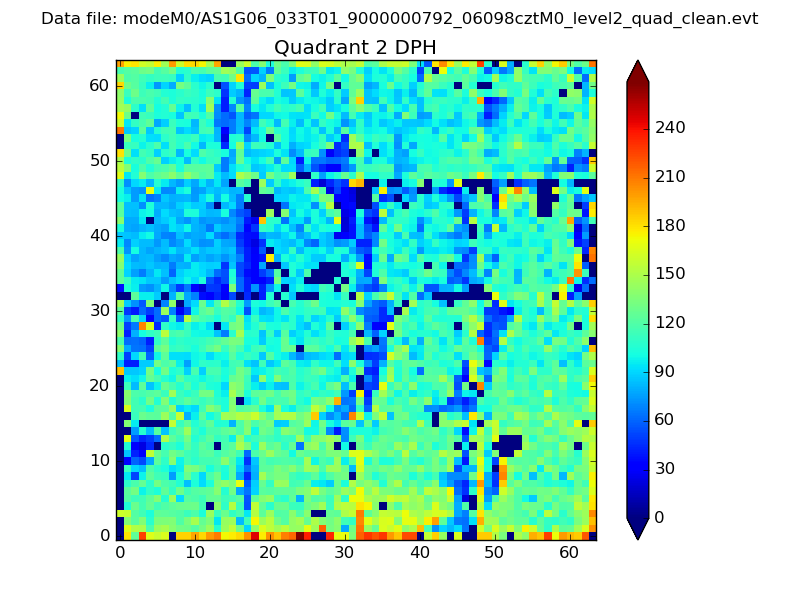
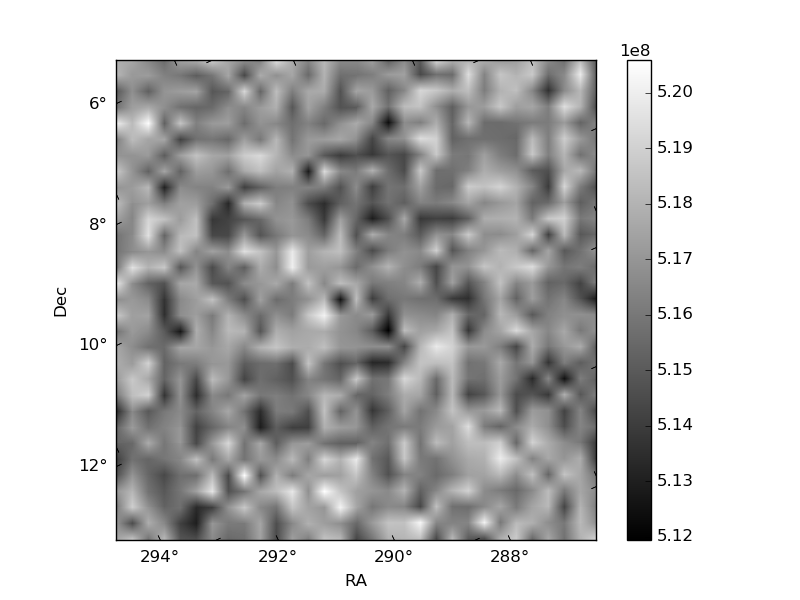
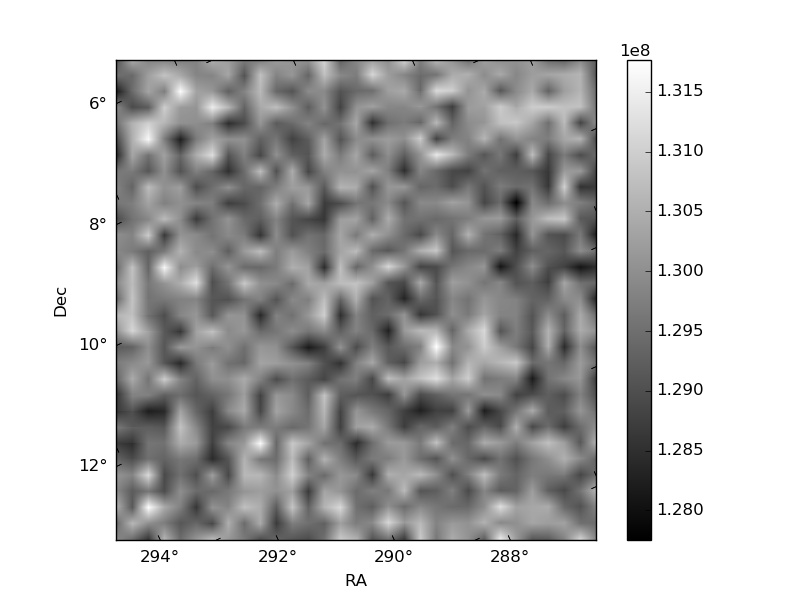
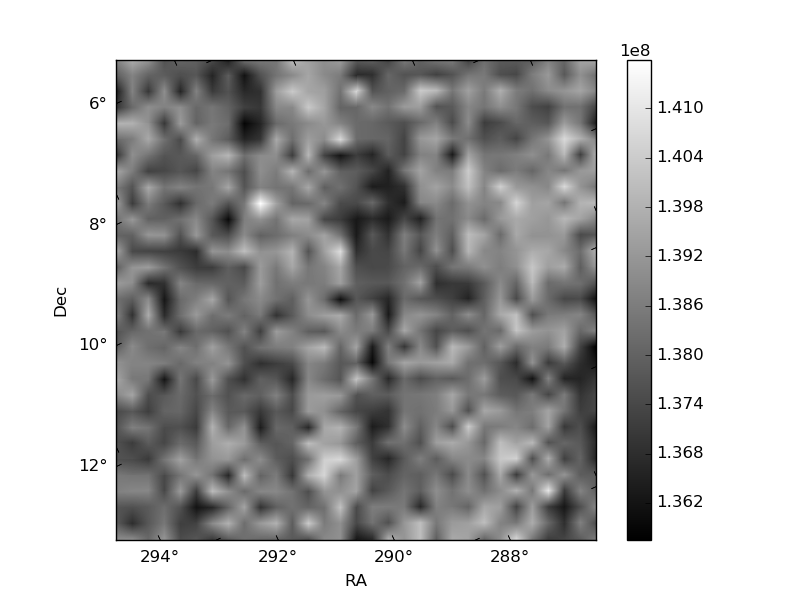
Histogram calculated using DETX and DETY for each event in the final _common_clean file
| Quadrant A |  |
 |
Quadrant B |
|---|---|---|---|
| Quadrant D | 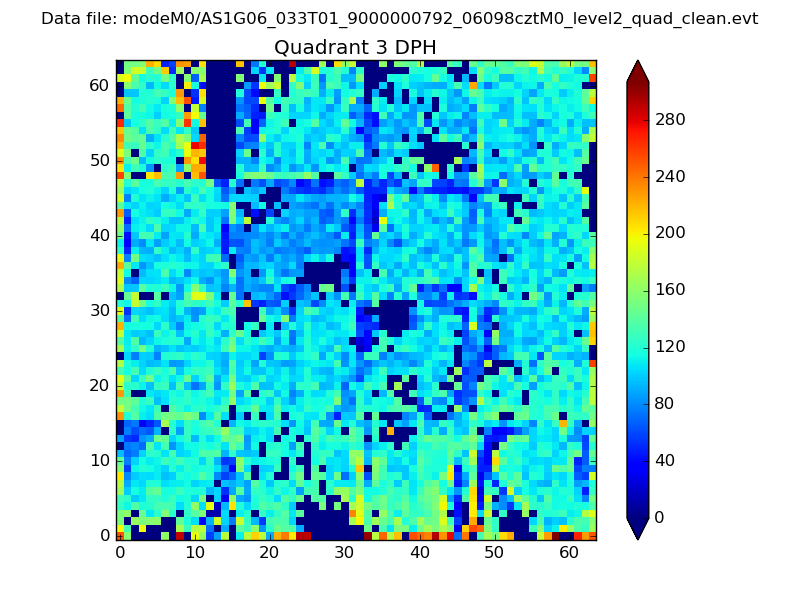 |
 |
Quadrant C |
| Plot type | Count rate plots | Images |
|---|---|---|
| Comparison with Poisson distribution Blue bars denote a histogram of data divided into 1 sec bins. Red curve is a Poisson curve with rate = median count rate of data. |
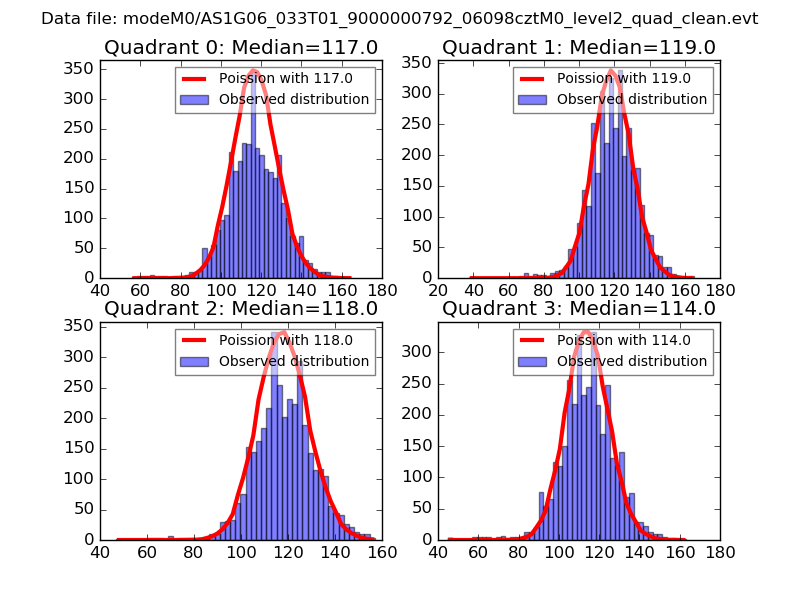 |
 |
| Quadrant-wise count rates Data is divided into 100 sec bins |
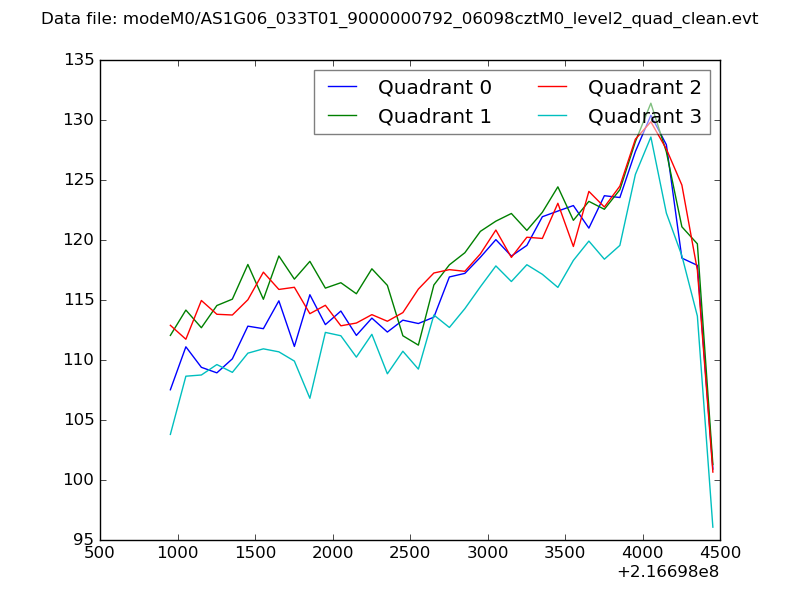 |
|
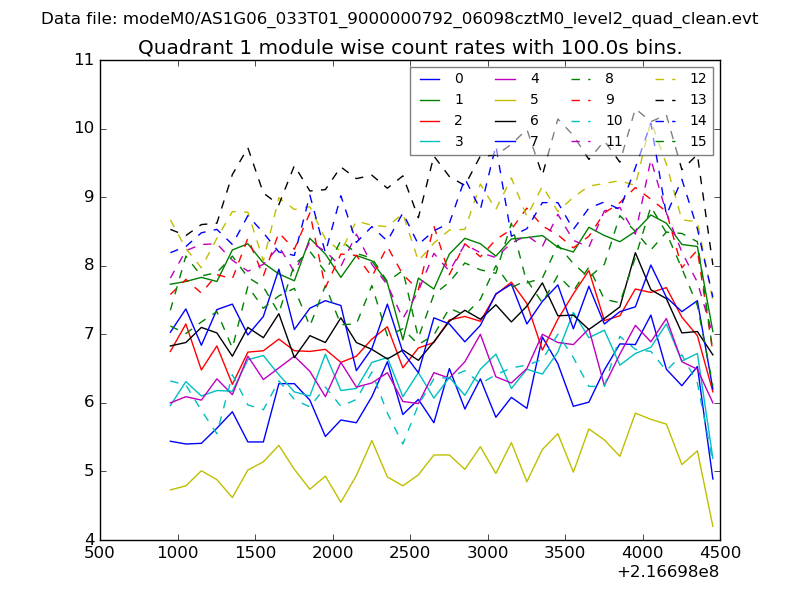
| Module-wise count rates for Quadrant A Data is divided into 100 sec bins |
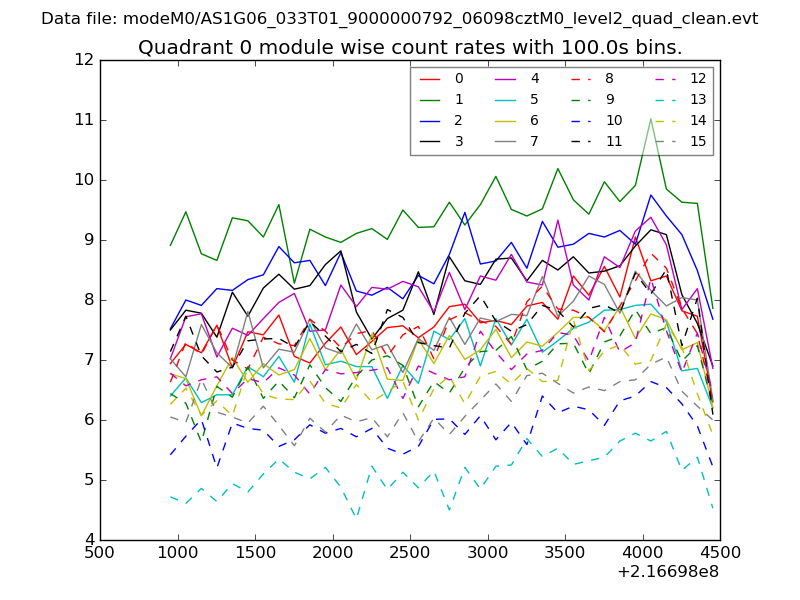 |
 |
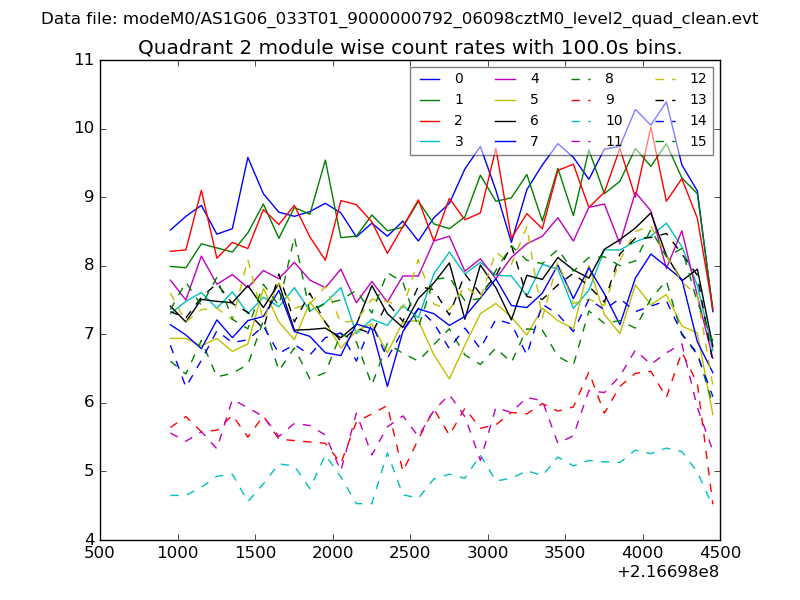
| Module-wise count rates for Quadrant B Data is divided into 100 sec bins |
 |
 |
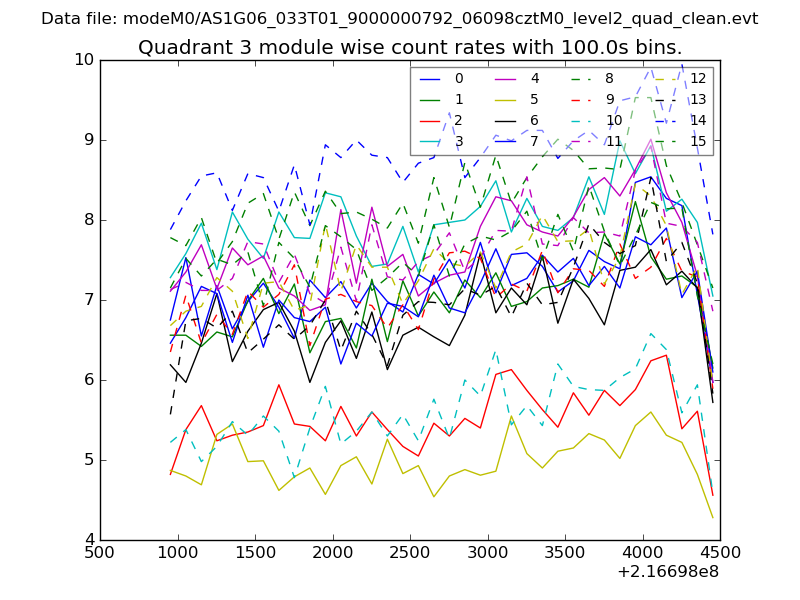
| Module-wise count rates for Quadrant C Data is divided into 100 sec bins |
 |
 |
| Module-wise count rates for Quadrant D Data is divided into 100 sec bins |
 |
 |
| Parameter | Plot |
|---|---|
| CZT HV Monitor | 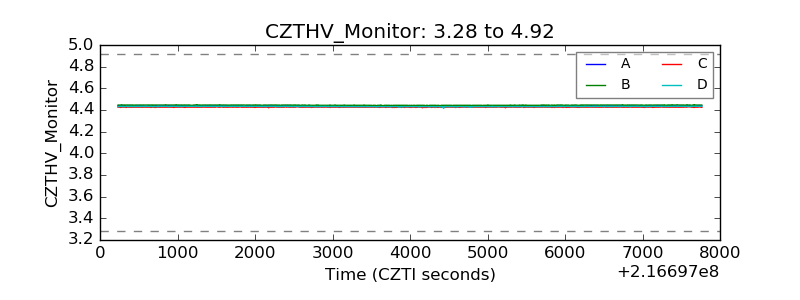 |
| D_VDD | 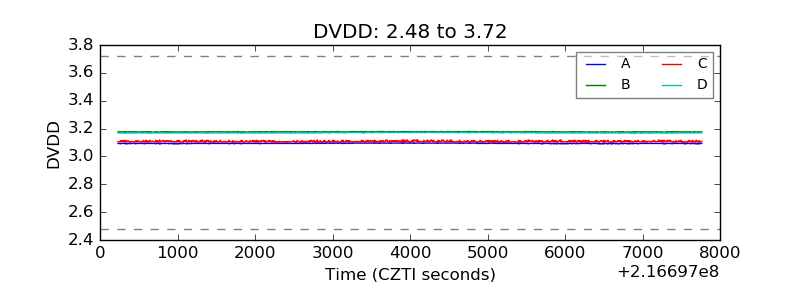 |
| Temperature 1 | 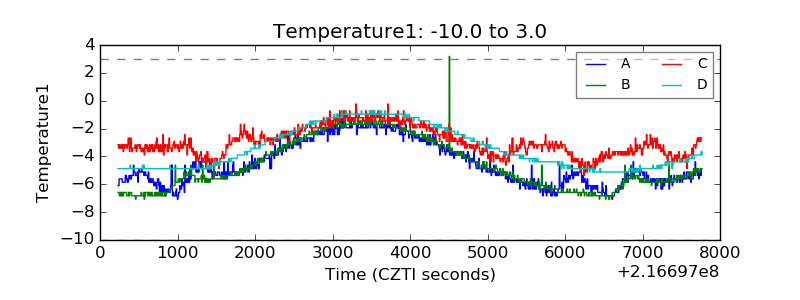 |
| Veto HV Monitor | 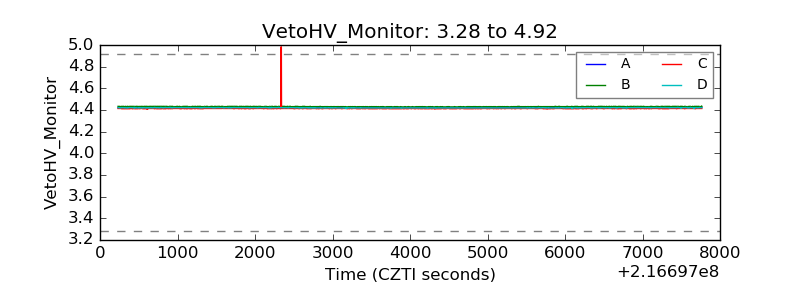 |
| Veto LLD | 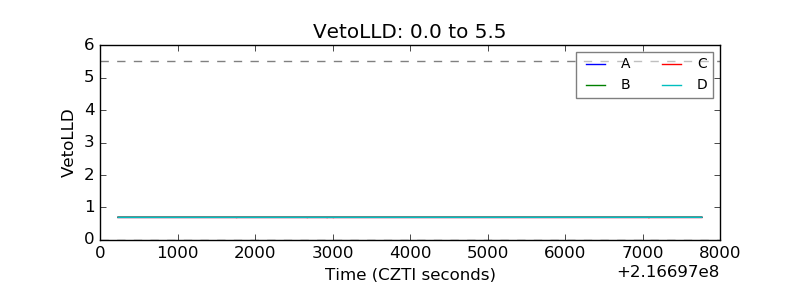 |
| Alpha Counter | 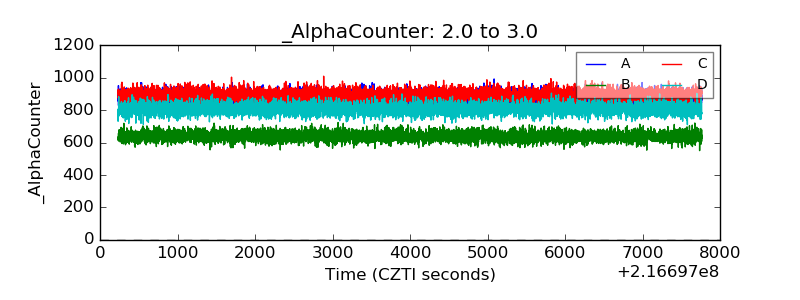 |
| _CPM_Rate | 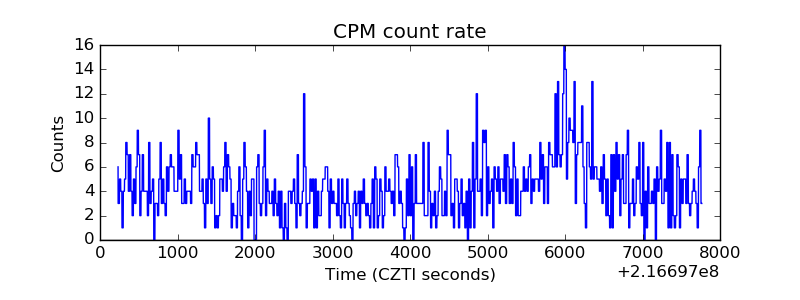 |
| CZT Counter | 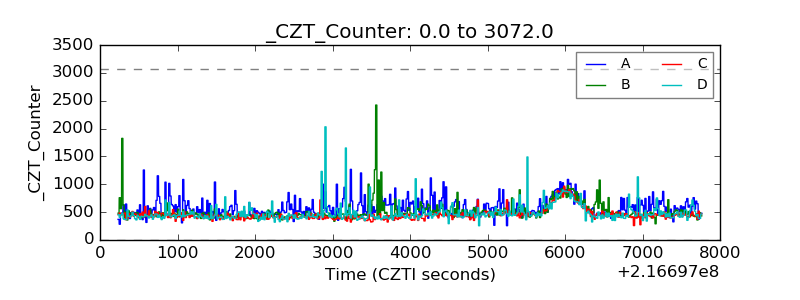 |
| +2.5 Volts monitor |  |
| +5 Volts monitor | 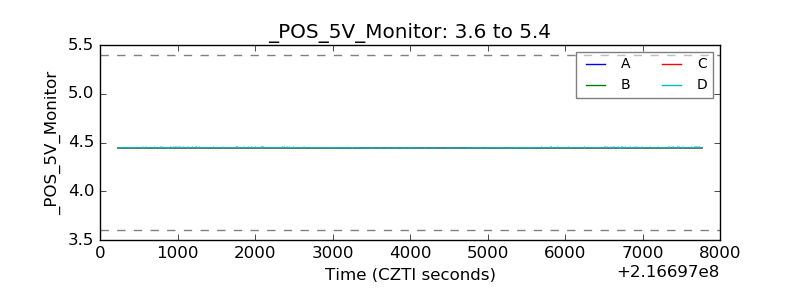 |
| _ROLL_ROT | 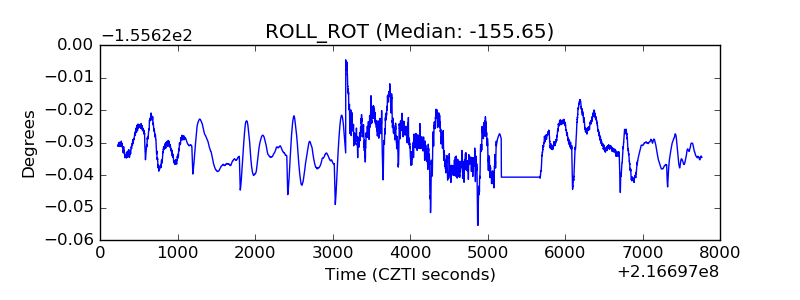 |
| _Roll_DEC | 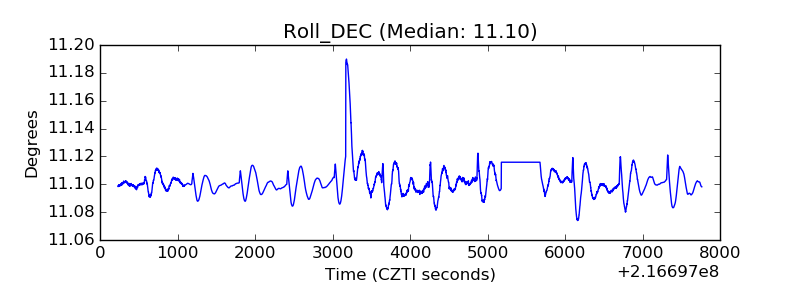 |
| _Roll_RA | 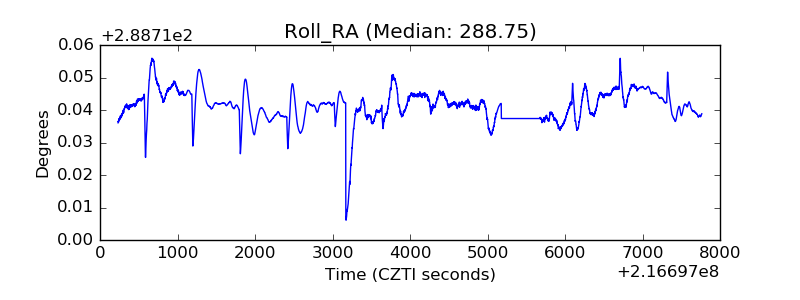 |
| Veto Counter | 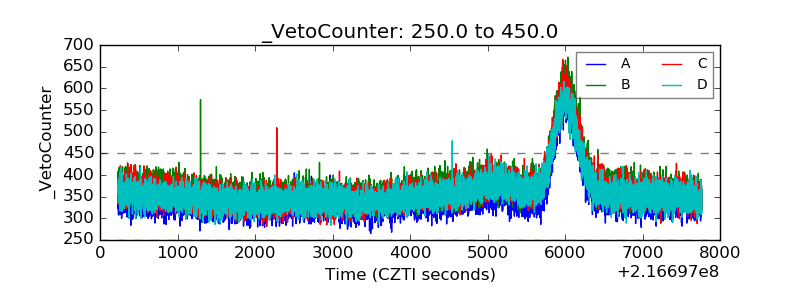 |