| Param | Original file | Final file |
|---|---|---|
| Filename | modeM0/AS1G06_033T01_9000000792_06102cztM0_level2.evt | modeM0/AS1G06_033T01_9000000792_06102cztM0_level2_quad_clean.evt |
| Size (bytes) | 1,195,649,280 | 220,374,720 |
| Size | 1.1 GB | 210.2 MB |
| Events in quadrant A | 10,361,567 | 1,357,116 |
| Events in quadrant B | 8,787,235 | 1,406,125 |
| Events in quadrant C | 7,602,051 | 1,393,251 |
| Events in quadrant D | 8,306,275 | 1,342,616 |
| Mode M0 | |||
|---|---|---|---|
| Quadrant | BADHDUFLAG | Total packets | Discarded packets |
| A | 0 | 42128 | 396 |
| B | 0 | 37309 | 234 |
| C | 0 | 34897 | 241 |
| D | 0 | 36903 | 198 |
| Mode SS | |||
|---|---|---|---|
| Quadrant | BADHDUFLAG | Total packets | Discarded packets |
| A | 0 | 348 | 2 |
| B | 0 | 348 | 2 |
| C | 0 | 348 | 0 |
| D | 0 | 348 | 6 |
| Mode M9 | |||
|---|---|---|---|
| Quadrant | BADHDUFLAG | Total packets | Discarded packets |
| A | 0 | 20 | 1 |
| B | 0 | 20 | 1 |
| C | 0 | 20 | 0 |
| D | 0 | 20 | 0 |
| Quadrant | Total seconds | Saturated seconds | Saturation percentage |
|---|---|---|---|
| A | 17018 | 813 | 4.777295% |
| B | 17061 | 246 | 1.441885% |
| C | 17045 | 88 | 0.516280% |
| D | 17074 | 205 | 1.200656% |
Noise dominated data is calculated using 1-second bins in cleaned event files. If a bin has >2000 counts, and if more than 50% of those come from <1% of pixels, then it is considered to be noise-dominated and hence unusable.
| Quadrant | # 1 sec bins | Bins with >0 counts | Bins with >2000 counts | High rate bins dominated by noise | Noise dominated (total time) | Noise dominated (detector-on time) | Marked lightcurve |
|---|---|---|---|---|---|---|---|
| A | 19141 | 17153 | 518 | 518 | 2.71% | 3.02% | 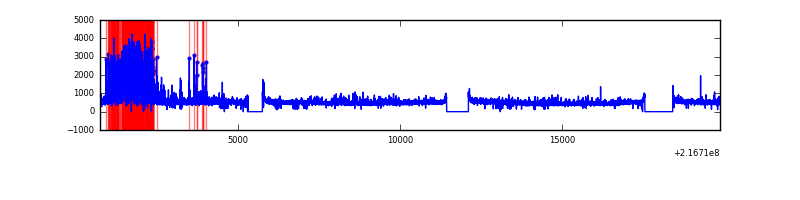 |
| B | 19141 | 17154 | 49 | 49 | 0.26% | 0.29% | 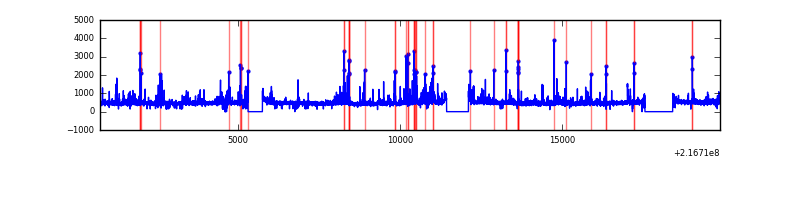 |
| C | 19141 | 17161 | 0 | 0 | 0.00% | 0.00% |  |
| D | 19141 | 17160 | 98 | 98 | 0.51% | 0.57% | 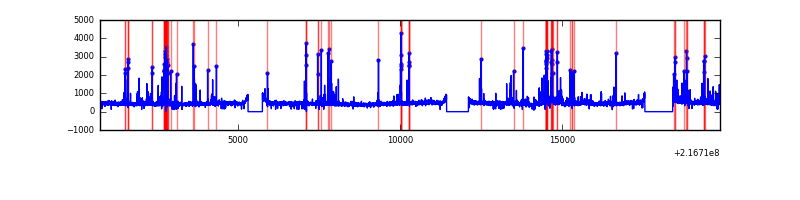 |
Top three noisy pixels from each quadrant. If the there are fewer than three noisy pixels in the level2.evt file, extra rows are filled as -1
| Pixel properties | Quadrant properties | ||||||
|---|---|---|---|---|---|---|---|
| Quadrant | DetID | PixID | Counts | Sigma | Mean | Median | Sigma |
| A | 13 | 170 | 1992991 | 5041.09 | 1938 | 1894 | 395.0 |
| A | 8 | 15 | 906599 | 2290.55 | 1938 | 1894 | 395.0 |
| A | 12 | 194 | 19070 | 43.49 | 1938 | 1894 | 395.0 |
| B | 4 | 81 | 291266 | 758.22 | 1976 | 1924 | 381.6 |
| B | 3 | 64 | 229520 | 596.42 | 1976 | 1924 | 381.6 |
| B | 10 | 245 | 193638 | 502.39 | 1976 | 1924 | 381.6 |
| C | 1 | 16 | 124913 | 277.09 | 1908 | 1918 | 443.9 |
| C | 8 | 128 | 18564 | 37.5 | 1908 | 1918 | 443.9 |
| C | 13 | 61 | 15251 | 30.04 | 1908 | 1918 | 443.9 |
| D | 13 | 169 | 249653 | 522.18 | 1918 | 1858 | 474.5 |
| D | 2 | 63 | 189383 | 395.17 | 1918 | 1858 | 474.5 |
| D | 2 | 33 | 160286 | 333.86 | 1918 | 1858 | 474.5 |
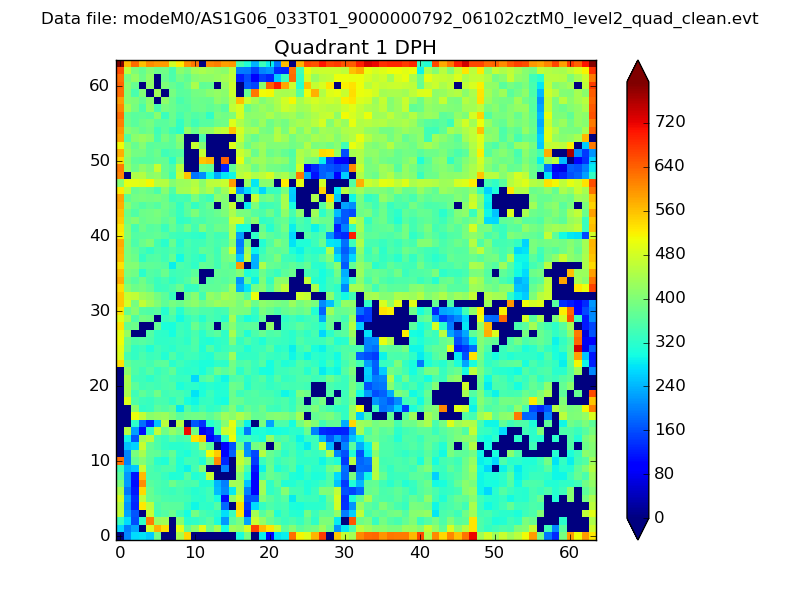
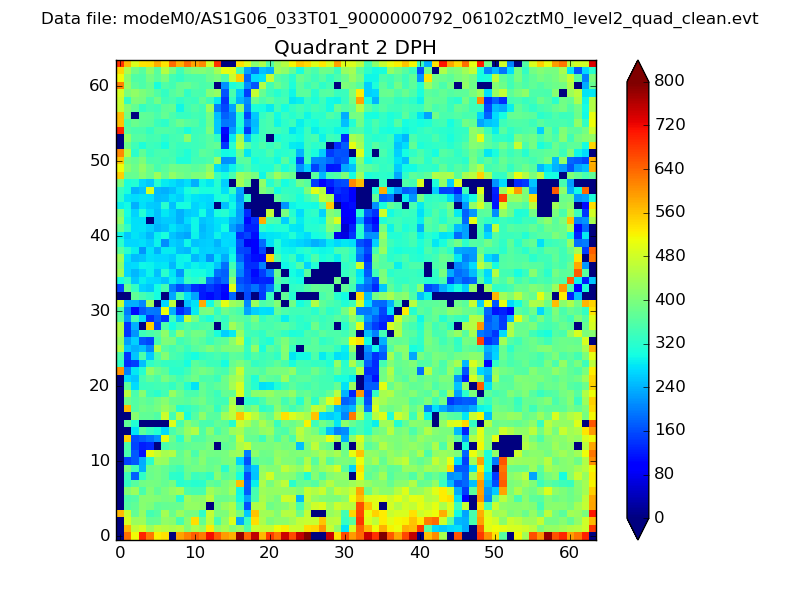
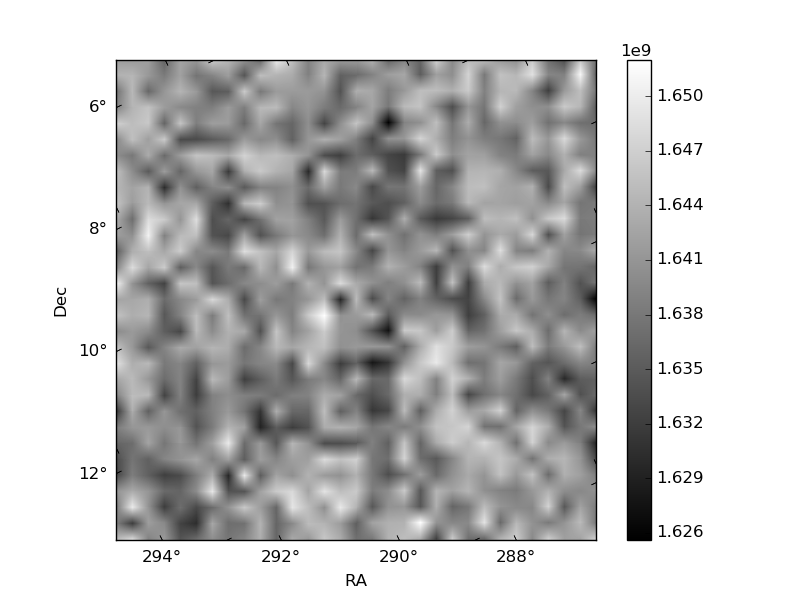
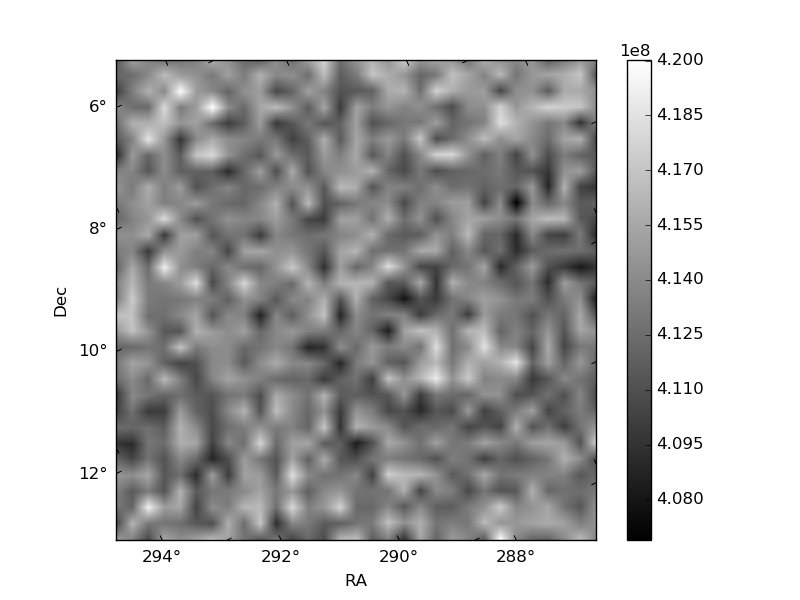
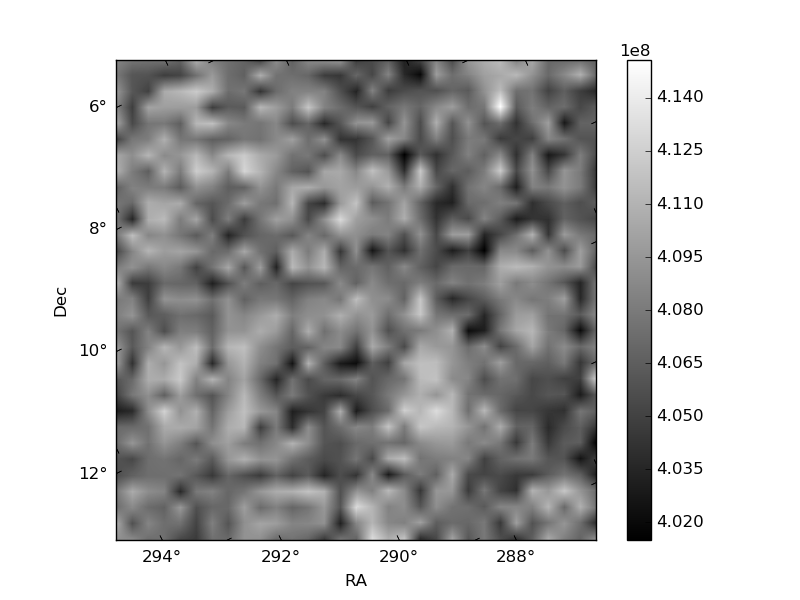
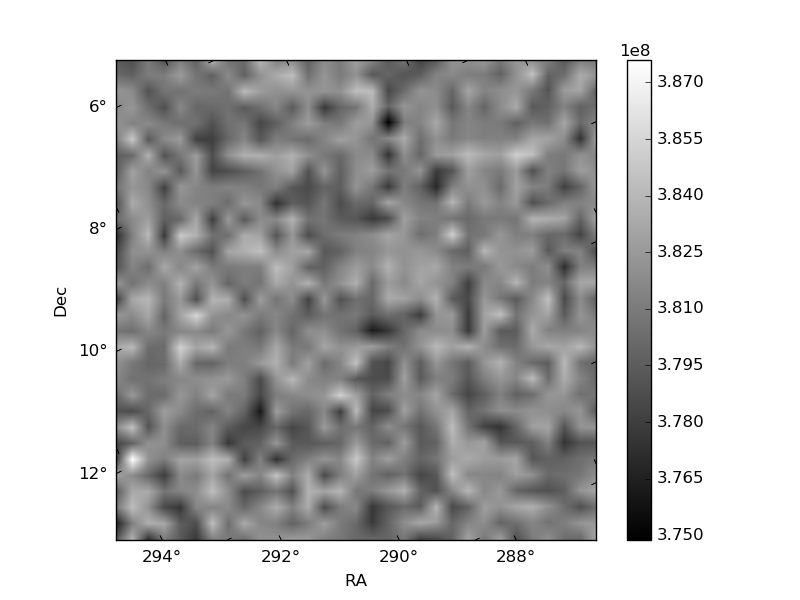
Histogram calculated using DETX and DETY for each event in the final _common_clean file
| Quadrant A | 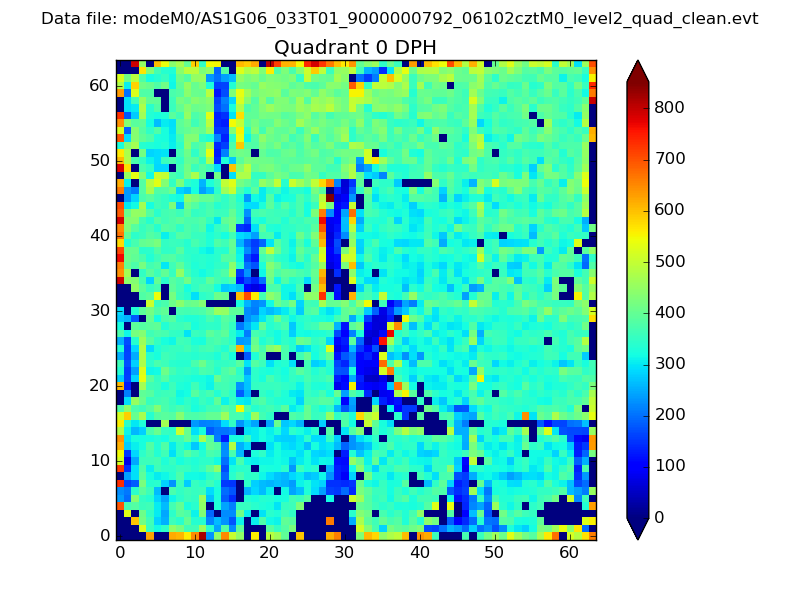 |
 |
Quadrant B |
|---|---|---|---|
| Quadrant D | 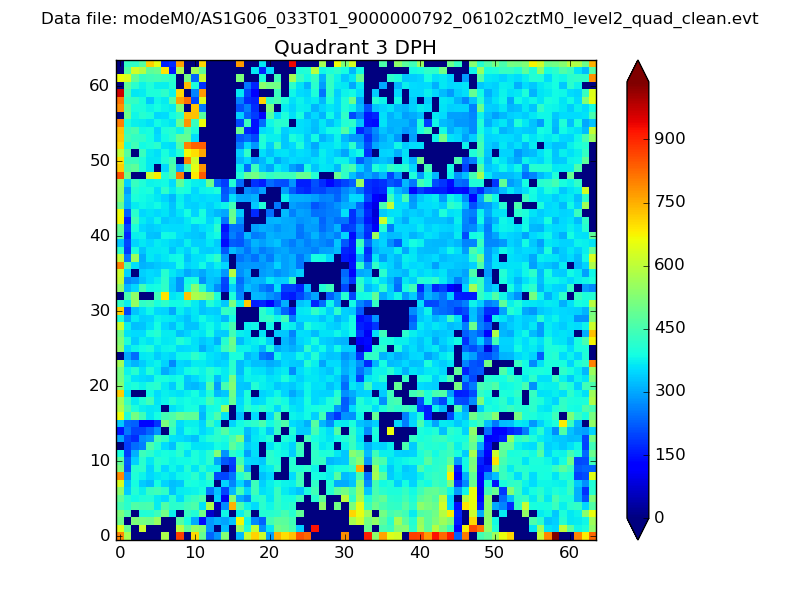 |
 |
Quadrant C |
| Plot type | Count rate plots | Images |
|---|---|---|
| Comparison with Poisson distribution Blue bars denote a histogram of data divided into 1 sec bins. Red curve is a Poisson curve with rate = median count rate of data. |
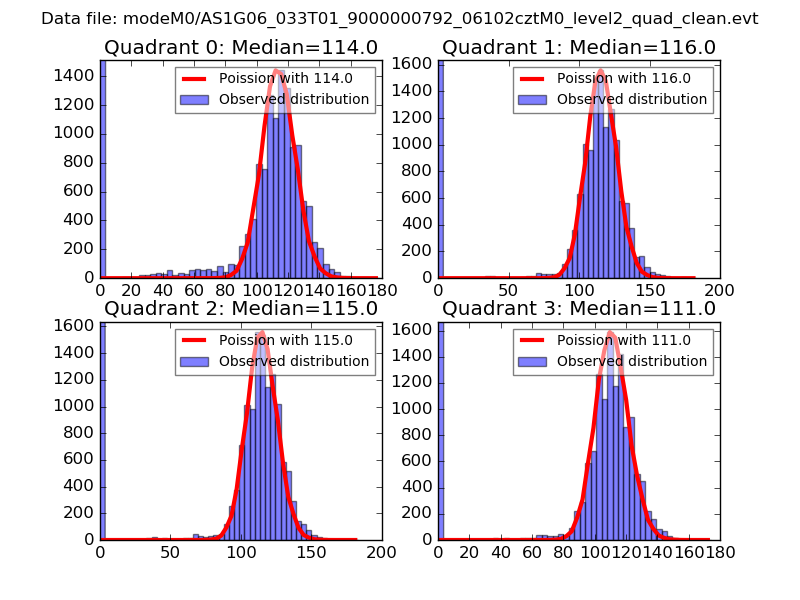 |
 |
| Quadrant-wise count rates Data is divided into 100 sec bins |
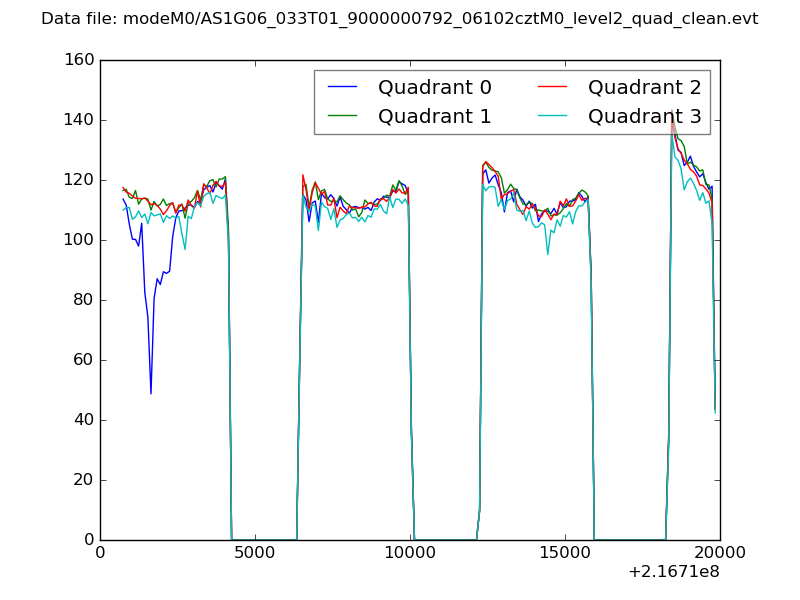 |
|
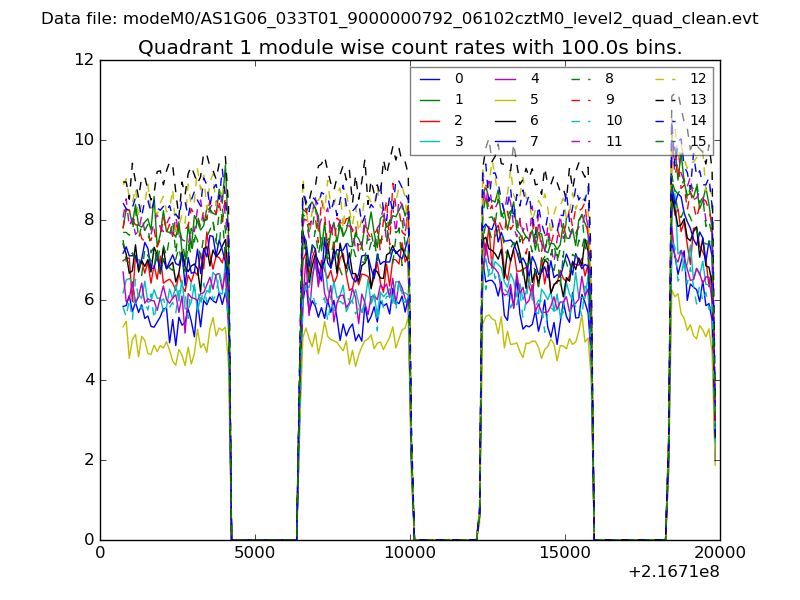
| Module-wise count rates for Quadrant A Data is divided into 100 sec bins |
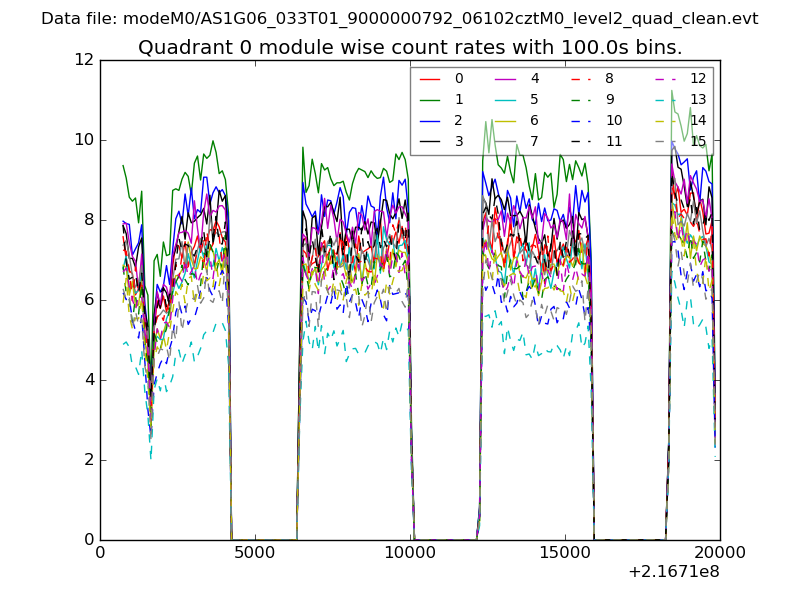 |
 |
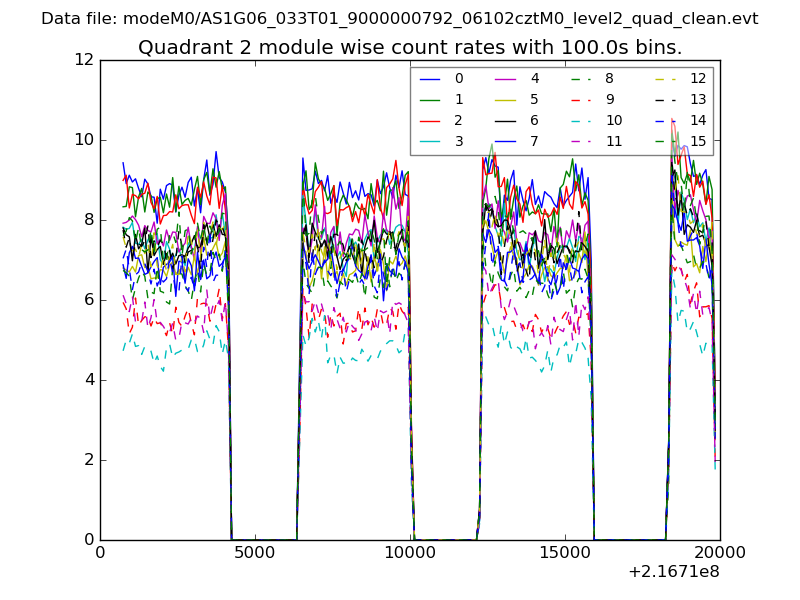
| Module-wise count rates for Quadrant B Data is divided into 100 sec bins |
 |
 |
| Module-wise count rates for Quadrant C Data is divided into 100 sec bins |
 |
 |
| Module-wise count rates for Quadrant D Data is divided into 100 sec bins |
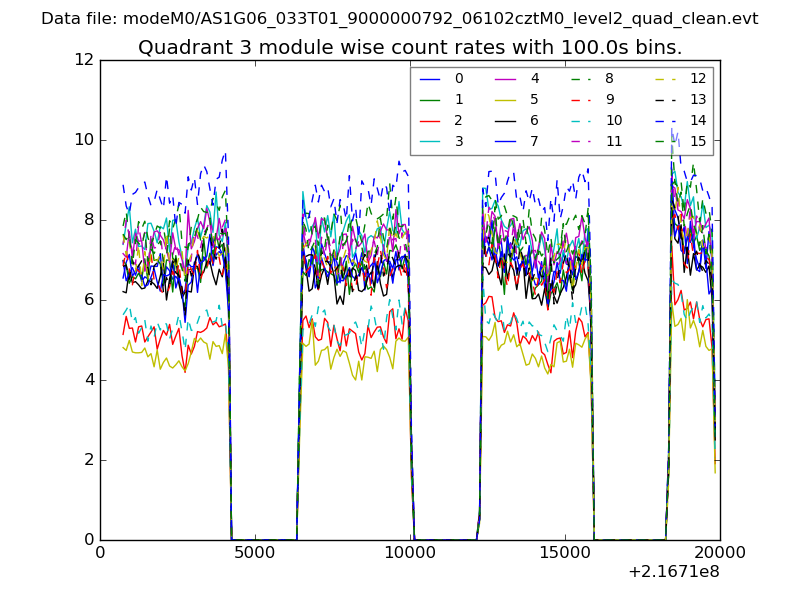 |
 |
| Parameter | Plot |
|---|---|
| CZT HV Monitor | 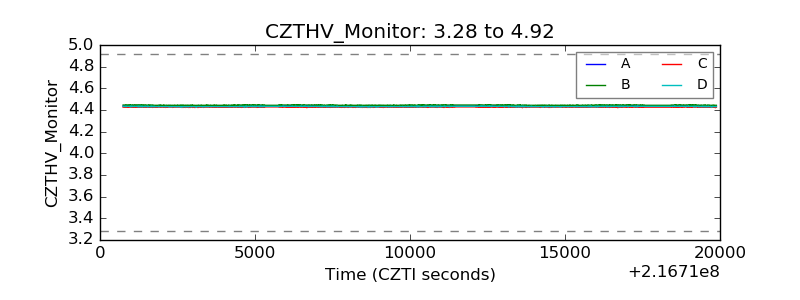 |
| D_VDD | 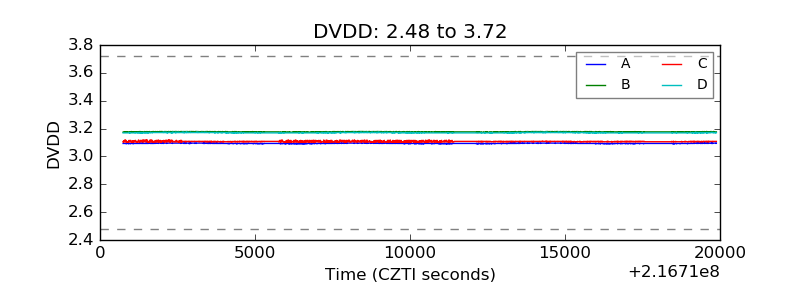 |
| Temperature 1 | 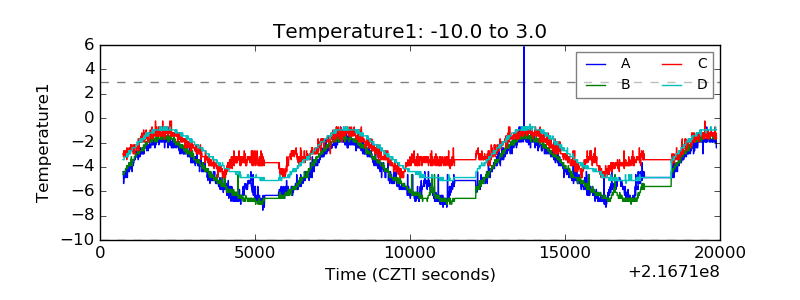 |
| Veto HV Monitor |  |
| Veto LLD | 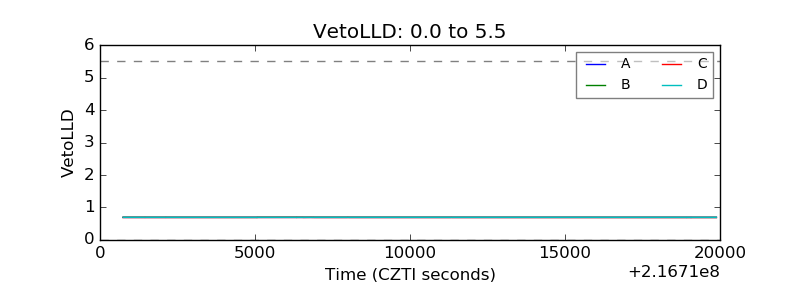 |
| Alpha Counter |  |
| _CPM_Rate | 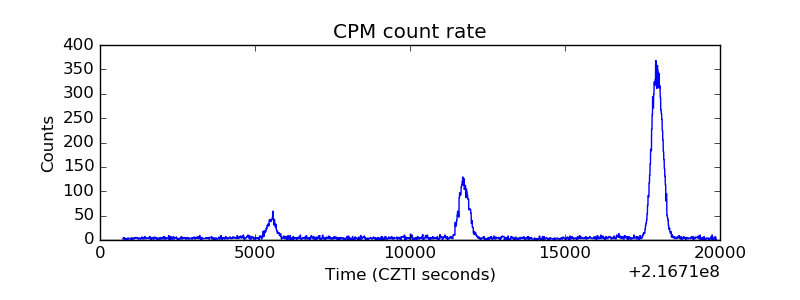 |
| CZT Counter | 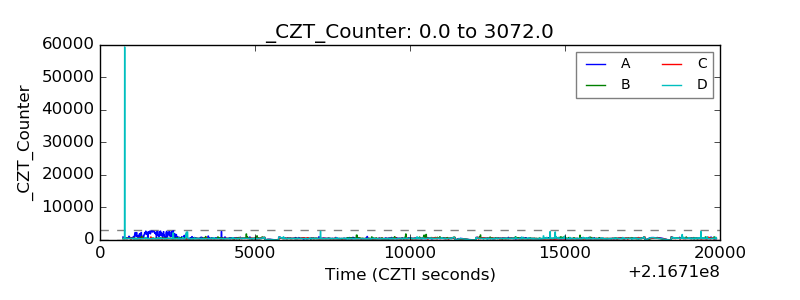 |
| +2.5 Volts monitor |  |
| +5 Volts monitor |  |
| _ROLL_ROT | 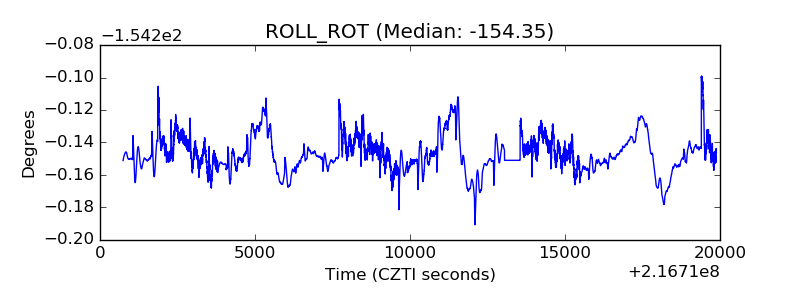 |
| _Roll_DEC | 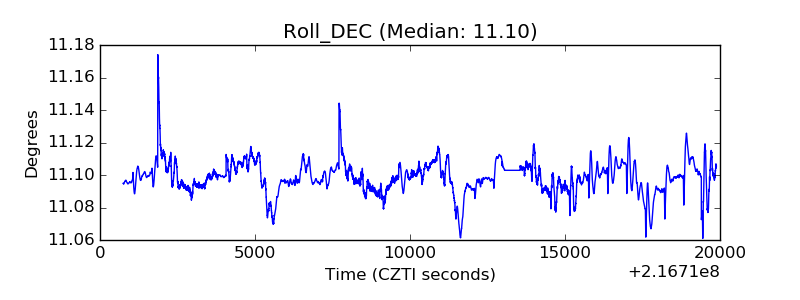 |
| _Roll_RA | 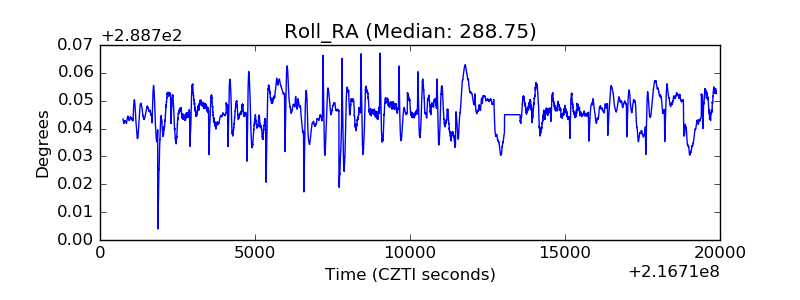 |
| Veto Counter | 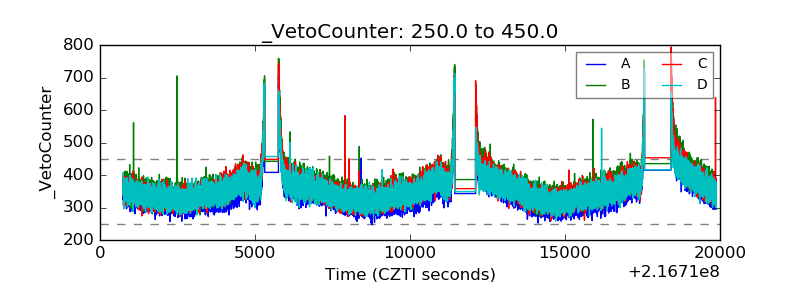 |