| Param | Original file | Final file |
|---|---|---|
| Filename | modeM0/AS1G06_033T01_9000000792_06103cztM0_level2.evt | modeM0/AS1G06_033T01_9000000792_06103cztM0_level2_quad_clean.evt |
| Size (bytes) | 438,402,240 | 81,083,520 |
| Size | 418.1 MB | 77.3 MB |
| Events in quadrant A | 3,097,076 | 514,432 |
| Events in quadrant B | 3,120,774 | 516,968 |
| Events in quadrant C | 3,667,867 | 503,911 |
| Events in quadrant D | 2,971,010 | 488,207 |
| Mode M0 | |||
|---|---|---|---|
| Quadrant | BADHDUFLAG | Total packets | Discarded packets |
| A | 0 | 13206 | 10 |
| B | 0 | 13305 | 7 |
| C | 0 | 15313 | 9 |
| D | 0 | 13319 | 6 |
| Mode SS | |||
|---|---|---|---|
| Quadrant | BADHDUFLAG | Total packets | Discarded packets |
| A | 0 | 126 | 0 |
| B | 0 | 126 | 0 |
| C | 0 | 126 | 0 |
| D | 0 | 126 | 0 |
| Mode M9 | |||
|---|---|---|---|
| Quadrant | BADHDUFLAG | Total packets | Discarded packets |
| A | 0 | 10 | 0 |
| B | 0 | 10 | 0 |
| C | 0 | 10 | 0 |
| D | 0 | 10 | 0 |
| Quadrant | Total seconds | Saturated seconds | Saturation percentage |
|---|---|---|---|
| A | 6184 | 80 | 1.293661% |
| B | 6185 | 72 | 1.164107% |
| C | 6184 | 41 | 0.663001% |
| D | 6186 | 90 | 1.454898% |
Noise dominated data is calculated using 1-second bins in cleaned event files. If a bin has >2000 counts, and if more than 50% of those come from <1% of pixels, then it is considered to be noise-dominated and hence unusable.
| Quadrant | # 1 sec bins | Bins with >0 counts | Bins with >2000 counts | High rate bins dominated by noise | Noise dominated (total time) | Noise dominated (detector-on time) | Marked lightcurve |
|---|---|---|---|---|---|---|---|
| A | 7168 | 6188 | 2 | 2 | 0.03% | 0.03% | 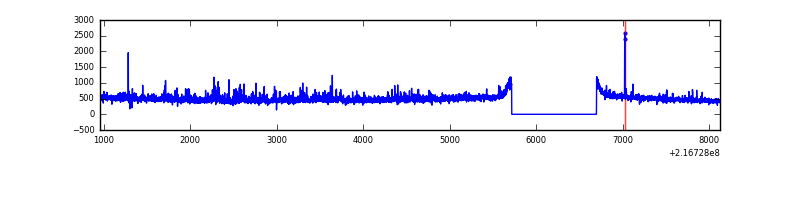 |
| B | 7168 | 6188 | 3 | 3 | 0.04% | 0.05% | 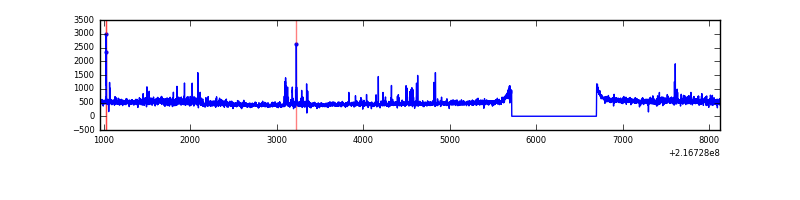 |
| C | 7168 | 6189 | 0 | 0 | 0.00% | 0.00% | 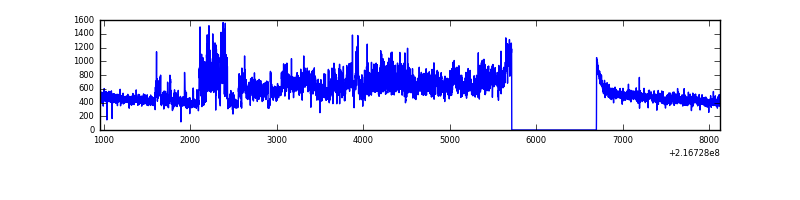 |
| D | 7168 | 6189 | 46 | 46 | 0.64% | 0.74% | 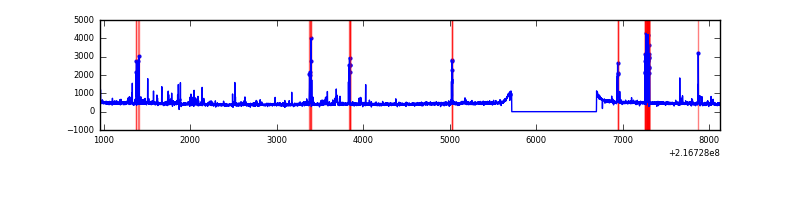 |
Top three noisy pixels from each quadrant. If the there are fewer than three noisy pixels in the level2.evt file, extra rows are filled as -1
| Pixel properties | Quadrant properties | ||||||
|---|---|---|---|---|---|---|---|
| Quadrant | DetID | PixID | Counts | Sigma | Mean | Median | Sigma |
| A | 8 | 15 | 298321 | 1991.18 | 719 | 702 | 149.5 |
| A | 14 | 111 | 13769 | 87.42 | 719 | 702 | 149.5 |
| A | 0 | 254 | 10292 | 64.16 | 719 | 702 | 149.5 |
| B | 0 | 214 | 102718 | 726.4 | 723 | 706 | 140.4 |
| B | 15 | 204 | 66622 | 469.37 | 723 | 706 | 140.4 |
| B | 0 | 219 | 57337 | 403.26 | 723 | 706 | 140.4 |
| C | 1 | 16 | 963306 | 5931.94 | 692 | 694 | 162.3 |
| C | 13 | 61 | 5456 | 29.35 | 692 | 694 | 162.3 |
| C | 9 | 54 | 3876 | 19.61 | 692 | 694 | 162.3 |
| D | 2 | 14 | 113331 | 657.23 | 696 | 676 | 171.4 |
| D | 2 | 63 | 65197 | 376.42 | 696 | 676 | 171.4 |
| D | 2 | 33 | 63769 | 368.09 | 696 | 676 | 171.4 |
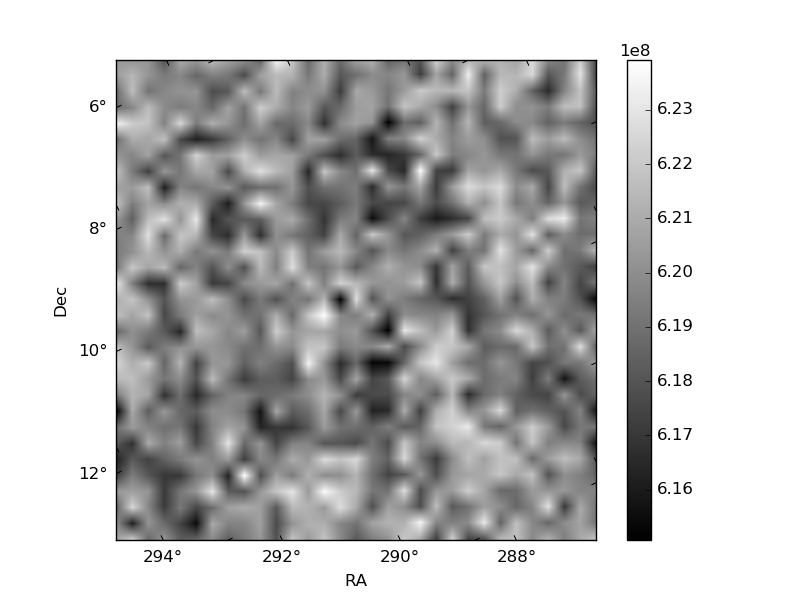
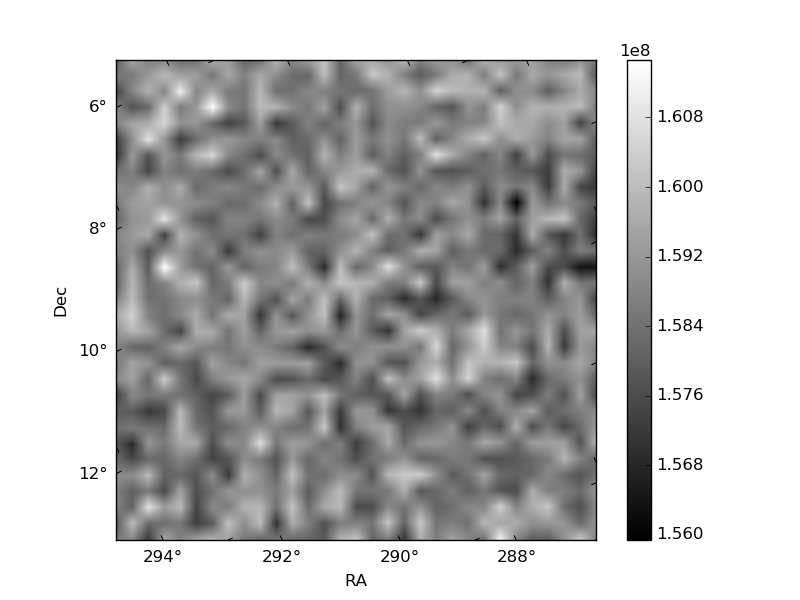
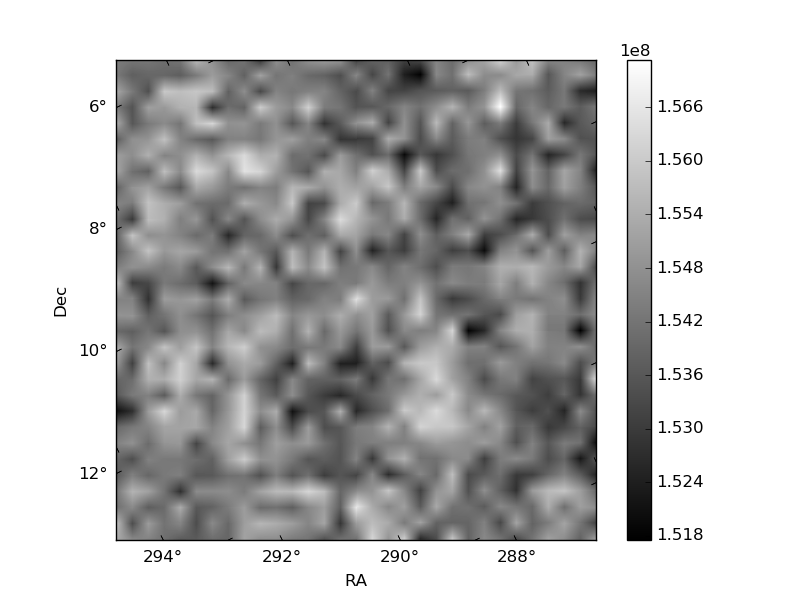
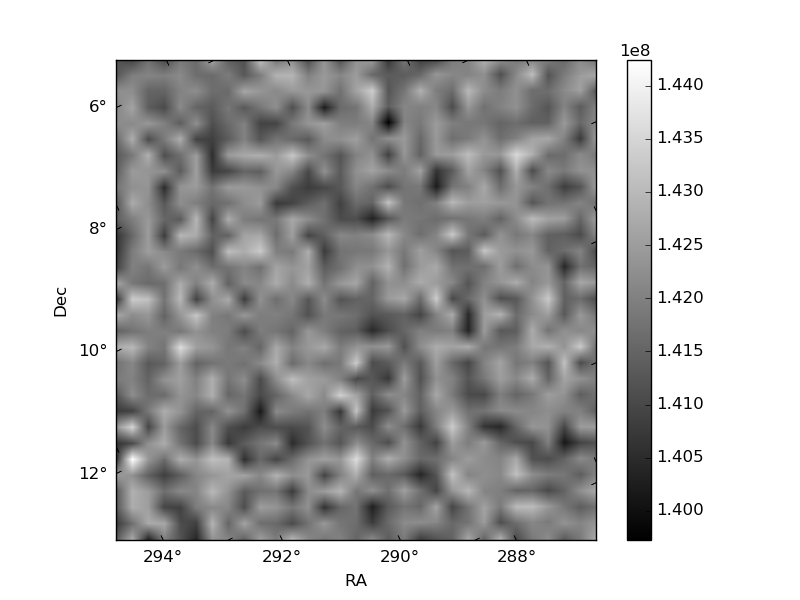
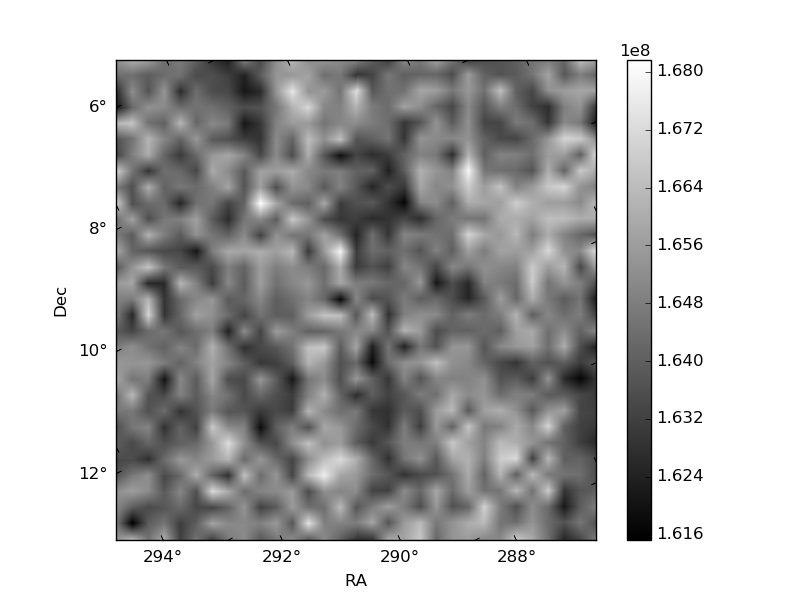
Histogram calculated using DETX and DETY for each event in the final _common_clean file
| Quadrant A | 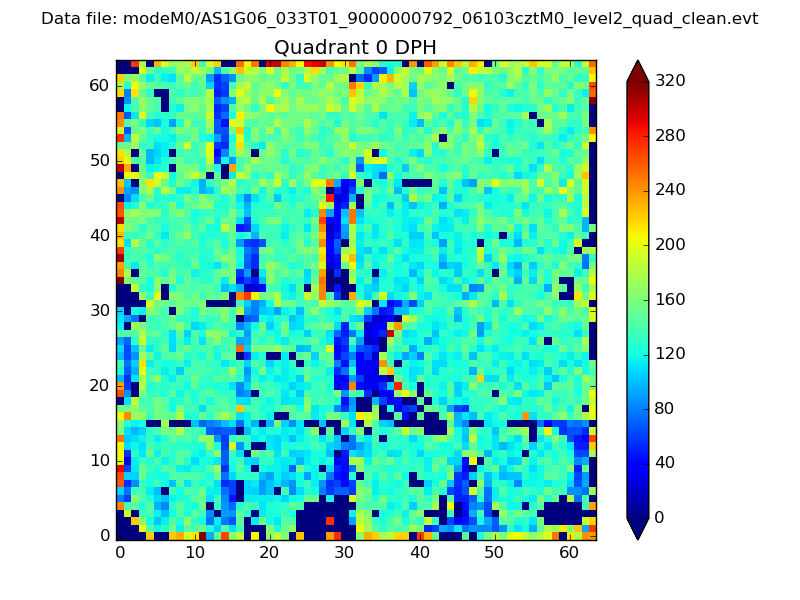 |
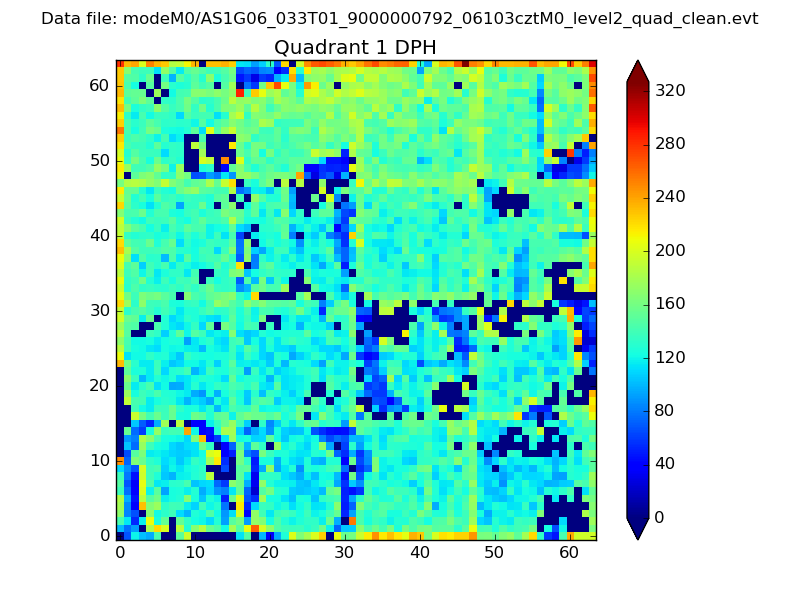 |
Quadrant B |
|---|---|---|---|
| Quadrant D | 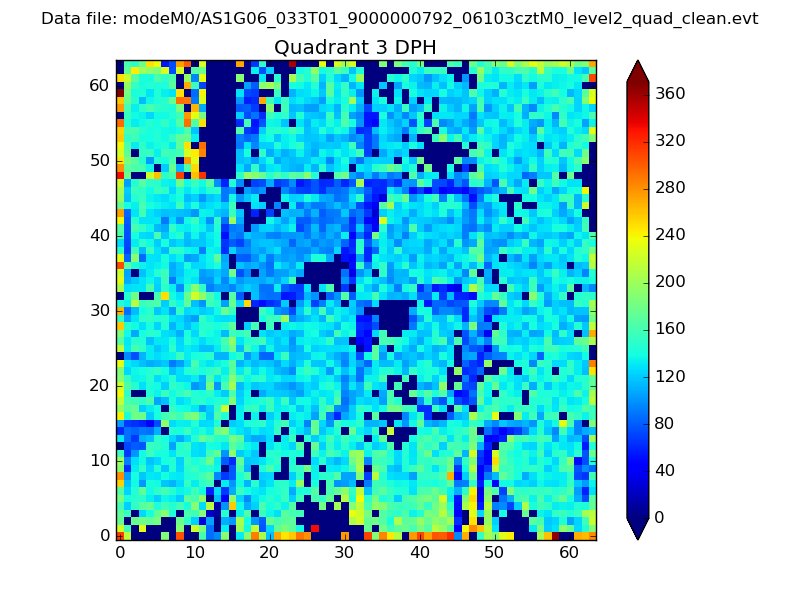 |
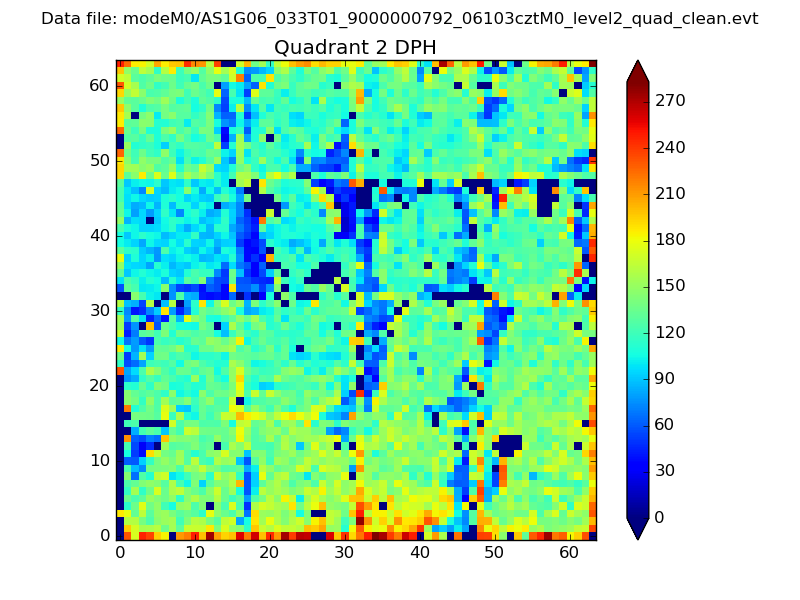 |
Quadrant C |
| Plot type | Count rate plots | Images |
|---|---|---|
| Comparison with Poisson distribution Blue bars denote a histogram of data divided into 1 sec bins. Red curve is a Poisson curve with rate = median count rate of data. |
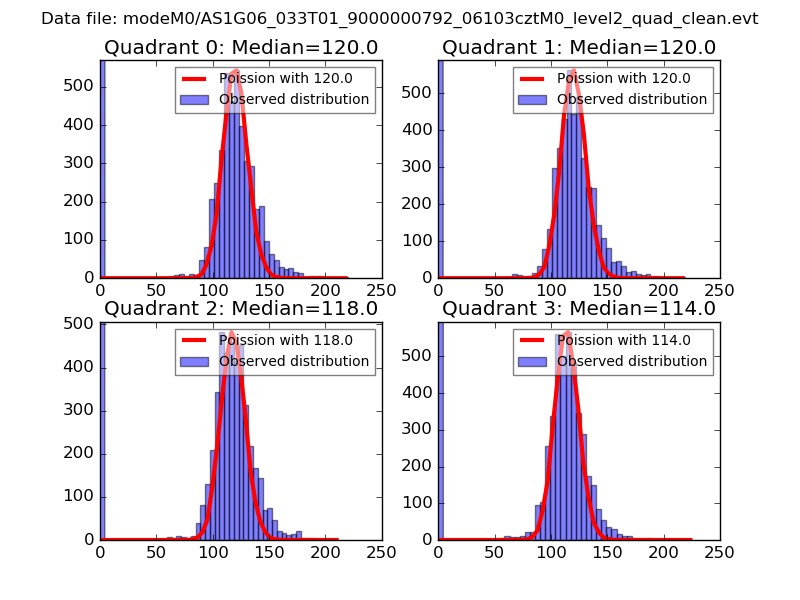 |
 |
| Quadrant-wise count rates Data is divided into 100 sec bins |
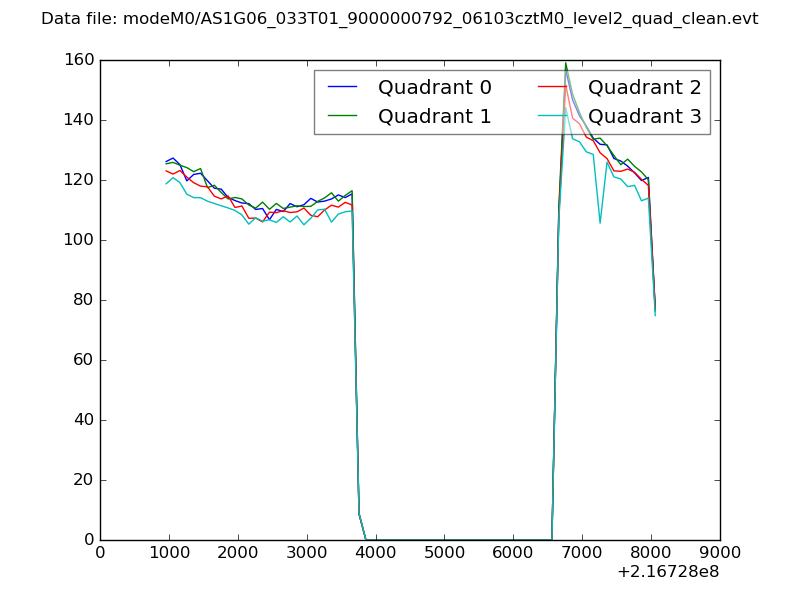 |
|
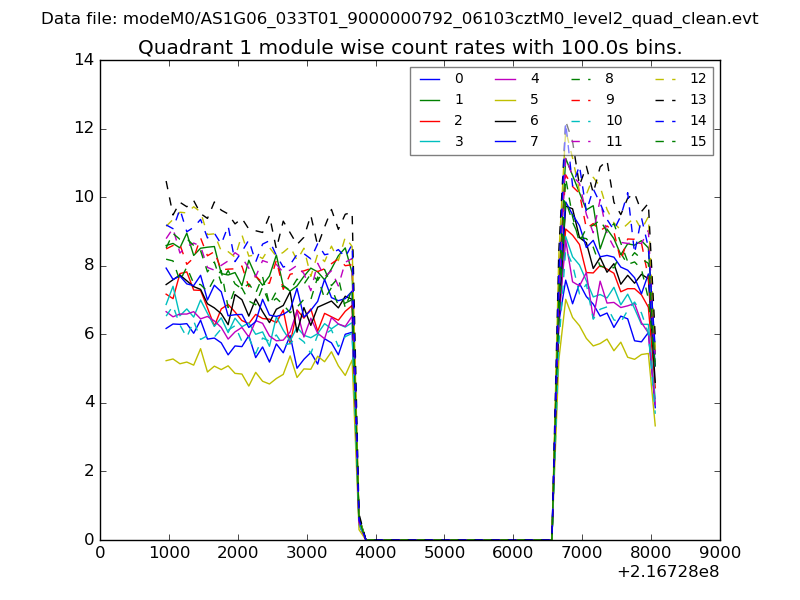
| Module-wise count rates for Quadrant A Data is divided into 100 sec bins |
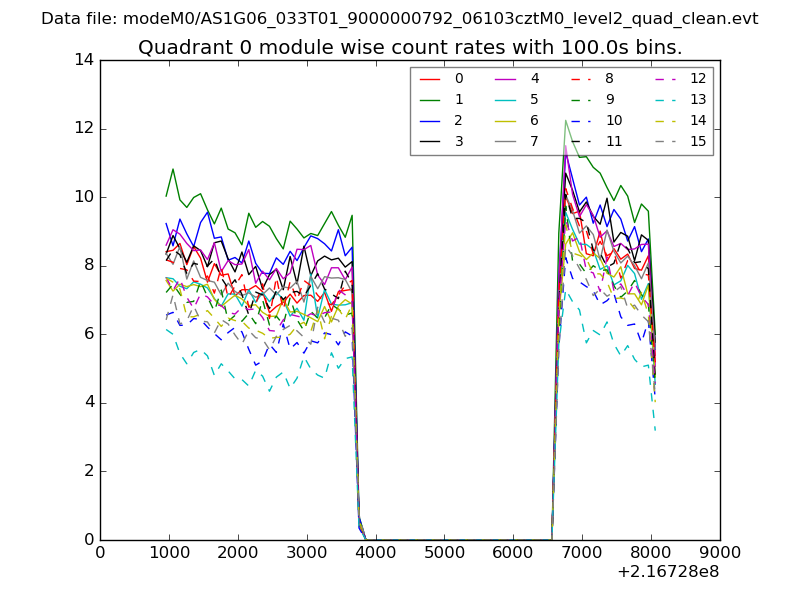 |
 |
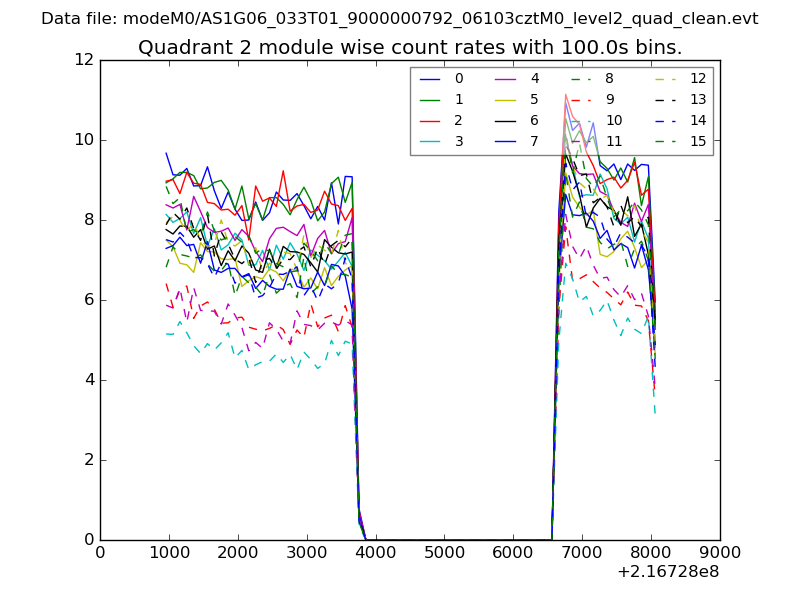
| Module-wise count rates for Quadrant B Data is divided into 100 sec bins |
 |
 |
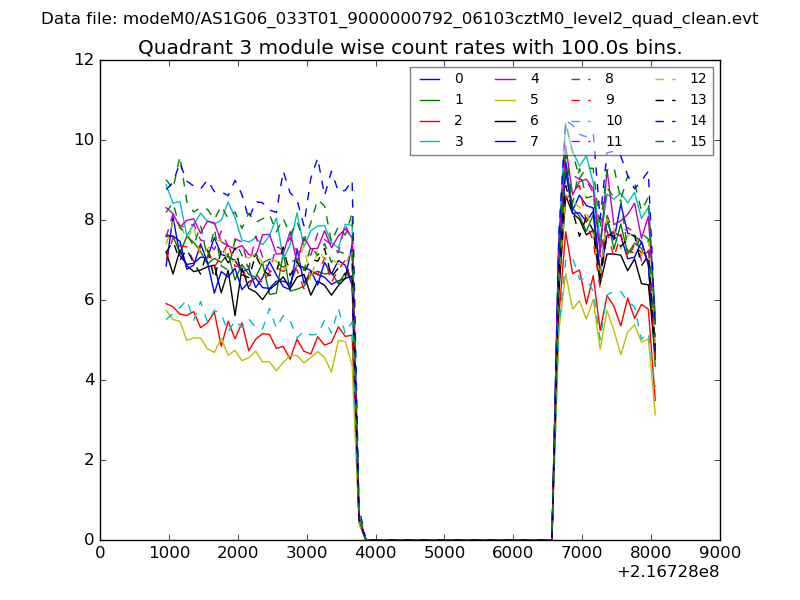
| Module-wise count rates for Quadrant C Data is divided into 100 sec bins |
 |
 |
| Module-wise count rates for Quadrant D Data is divided into 100 sec bins |
 |
 |
| Parameter | Plot |
|---|---|
| CZT HV Monitor | 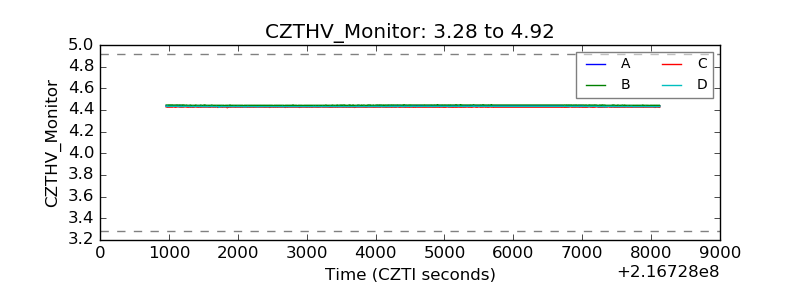 |
| D_VDD | 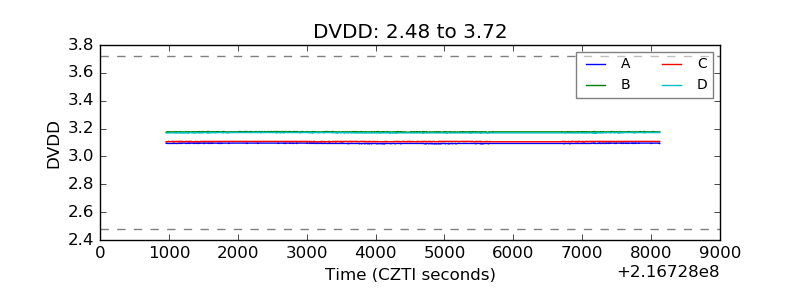 |
| Temperature 1 | 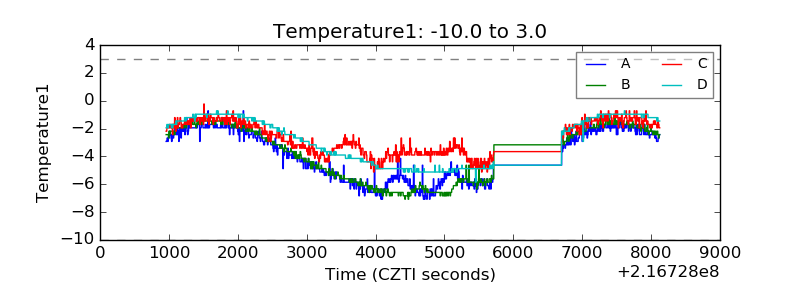 |
| Veto HV Monitor | 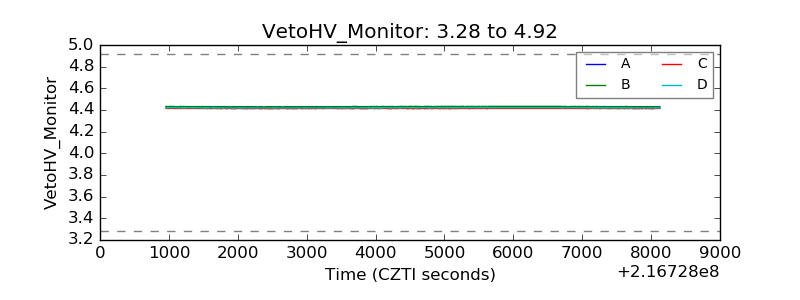 |
| Veto LLD | 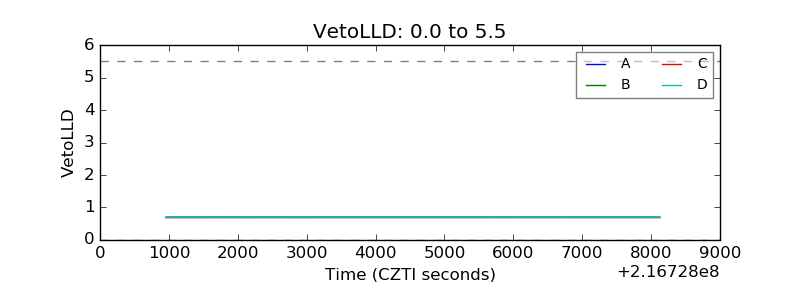 |
| Alpha Counter | 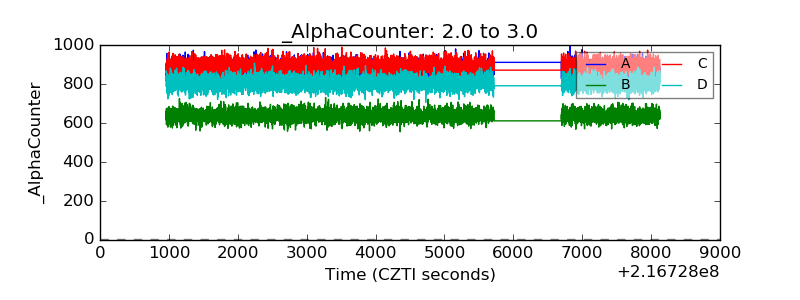 |
| _CPM_Rate |  |
| CZT Counter | 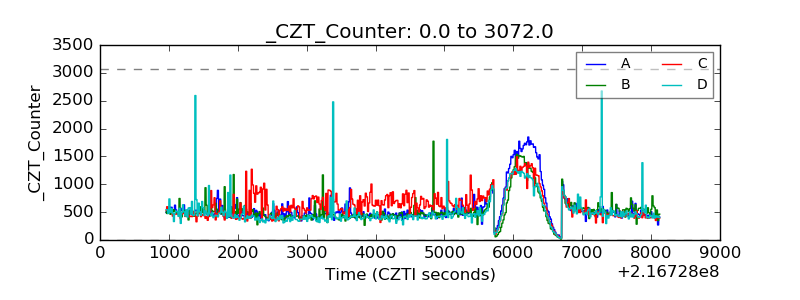 |
| +2.5 Volts monitor |  |
| +5 Volts monitor | 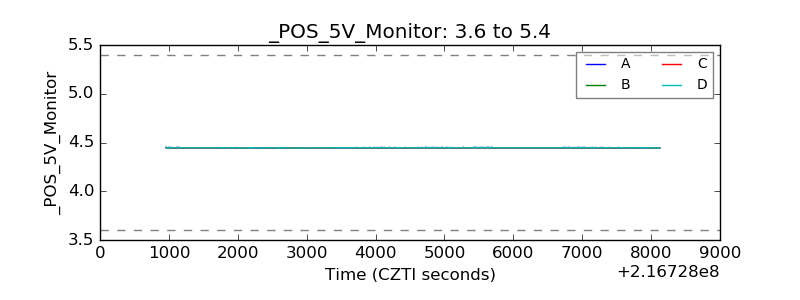 |
| _ROLL_ROT | 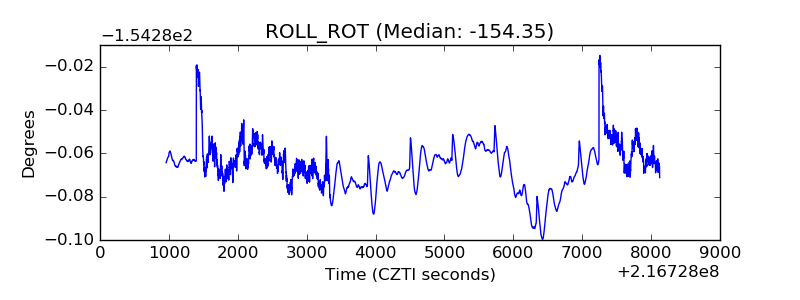 |
| _Roll_DEC | 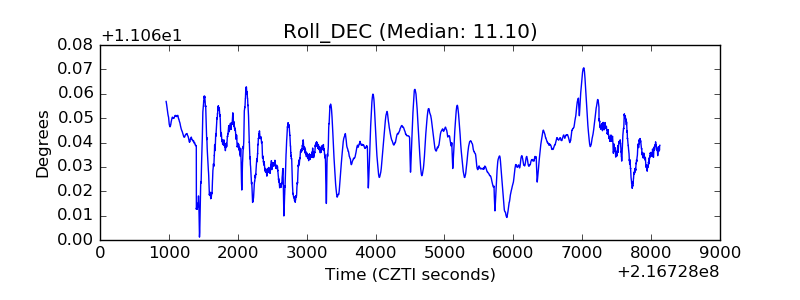 |
| _Roll_RA | 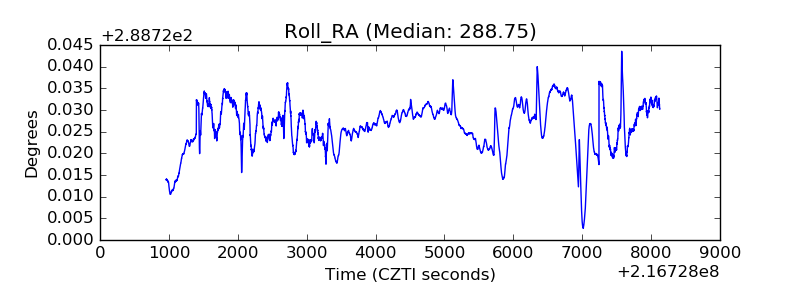 |
| Veto Counter | 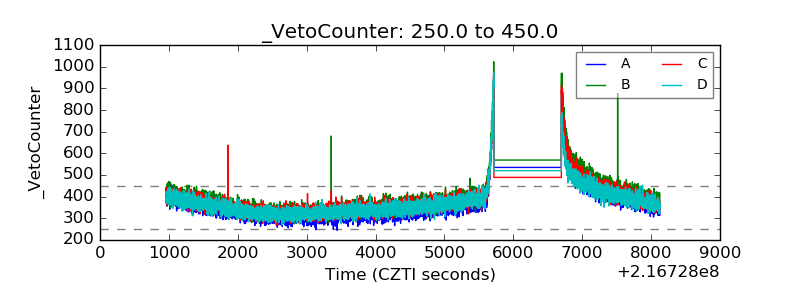 |