| Param | Original file | Final file |
|---|---|---|
| Filename | modeM0/AS1G06_033T01_9000000792_06106cztM0_level2.evt | modeM0/AS1G06_033T01_9000000792_06106cztM0_level2_quad_clean.evt |
| Size (bytes) | 435,467,520 | 74,903,040 |
| Size | 415.3 MB | 71.4 MB |
| Events in quadrant A | 3,012,844 | 474,051 |
| Events in quadrant B | 3,513,260 | 479,039 |
| Events in quadrant C | 2,675,237 | 470,812 |
| Events in quadrant D | 3,589,916 | 436,181 |
| Mode M0 | |||
|---|---|---|---|
| Quadrant | BADHDUFLAG | Total packets | Discarded packets |
| A | 0 | 12592 | 2 |
| B | 0 | 14208 | 1 |
| C | 0 | 11980 | 1 |
| D | 0 | 14769 | 1 |
| Mode SS | |||
|---|---|---|---|
| Quadrant | BADHDUFLAG | Total packets | Discarded packets |
| A | 0 | 120 | 0 |
| B | 0 | 120 | 0 |
| C | 0 | 120 | 0 |
| D | 0 | 120 | 0 |
| Mode M9 | |||
|---|---|---|---|
| Quadrant | BADHDUFLAG | Total packets | Discarded packets |
| A | 0 | 12 | 0 |
| B | 0 | 12 | 0 |
| C | 0 | 12 | 0 |
| D | 0 | 12 | 0 |
| Quadrant | Total seconds | Saturated seconds | Saturation percentage |
|---|---|---|---|
| A | 5834 | 41 | 0.702777% |
| B | 5834 | 137 | 2.348303% |
| C | 5834 | 21 | 0.359959% |
| D | 5834 | 269 | 4.610902% |
Noise dominated data is calculated using 1-second bins in cleaned event files. If a bin has >2000 counts, and if more than 50% of those come from <1% of pixels, then it is considered to be noise-dominated and hence unusable.
| Quadrant | # 1 sec bins | Bins with >0 counts | Bins with >2000 counts | High rate bins dominated by noise | Noise dominated (total time) | Noise dominated (detector-on time) | Marked lightcurve |
|---|---|---|---|---|---|---|---|
| A | 7089 | 5835 | 0 | 0 | 0.00% | 0.00% | 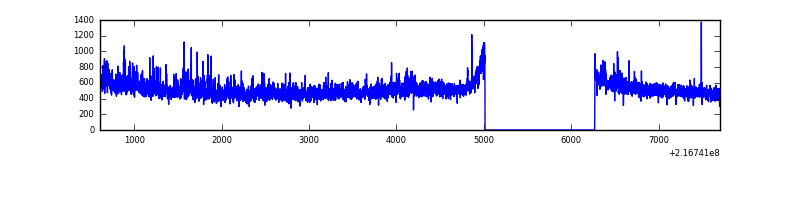 |
| B | 7089 | 5835 | 65 | 65 | 0.92% | 1.11% | 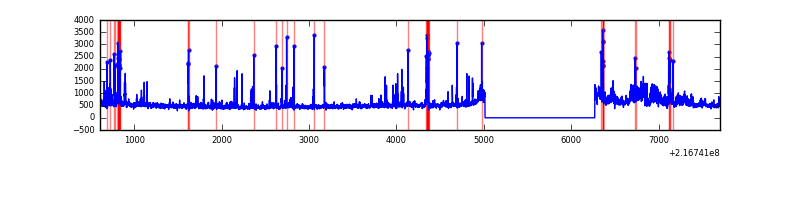 |
| C | 7089 | 5835 | 0 | 0 | 0.00% | 0.00% | 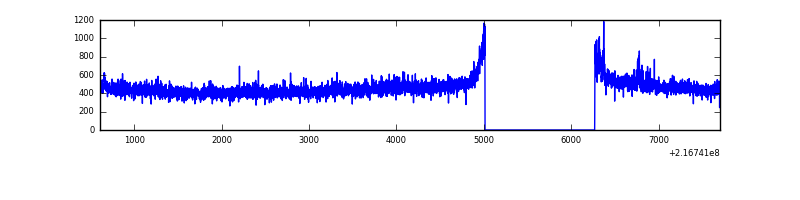 |
| D | 7089 | 5835 | 230 | 230 | 3.24% | 3.94% | 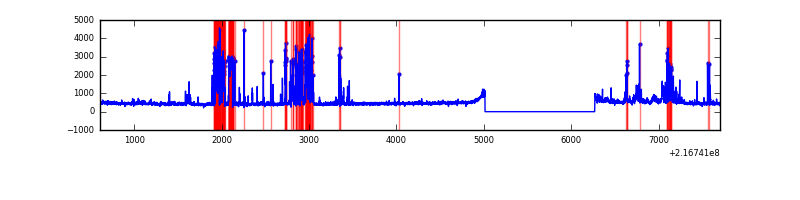 |
Top three noisy pixels from each quadrant. If the there are fewer than three noisy pixels in the level2.evt file, extra rows are filled as -1
| Pixel properties | Quadrant properties | ||||||
|---|---|---|---|---|---|---|---|
| Quadrant | DetID | PixID | Counts | Sigma | Mean | Median | Sigma |
| A | 8 | 15 | 323004 | 2301.06 | 690 | 676 | 140.1 |
| A | 14 | 111 | 29648 | 206.83 | 690 | 676 | 140.1 |
| A | 0 | 226 | 6700 | 43.0 | 690 | 676 | 140.1 |
| B | 15 | 204 | 301083 | 2257.53 | 695 | 681 | 133.1 |
| B | 3 | 64 | 251709 | 1886.48 | 695 | 681 | 133.1 |
| B | 0 | 214 | 134402 | 1004.92 | 695 | 681 | 133.1 |
| C | 1 | 16 | 53489 | 336.5 | 671 | 675 | 157.0 |
| C | 13 | 61 | 5374 | 29.94 | 671 | 675 | 157.0 |
| C | 9 | 54 | 4175 | 22.3 | 671 | 675 | 157.0 |
| D | 11 | 241 | 523525 | 3272.25 | 656 | 635 | 159.8 |
| D | 13 | 169 | 183731 | 1145.82 | 656 | 635 | 159.8 |
| D | 2 | 206 | 172883 | 1077.93 | 656 | 635 | 159.8 |
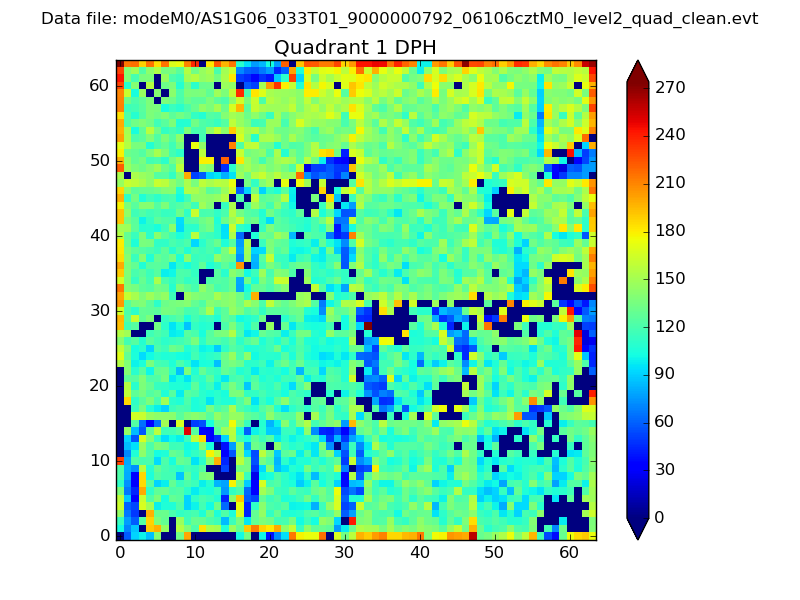
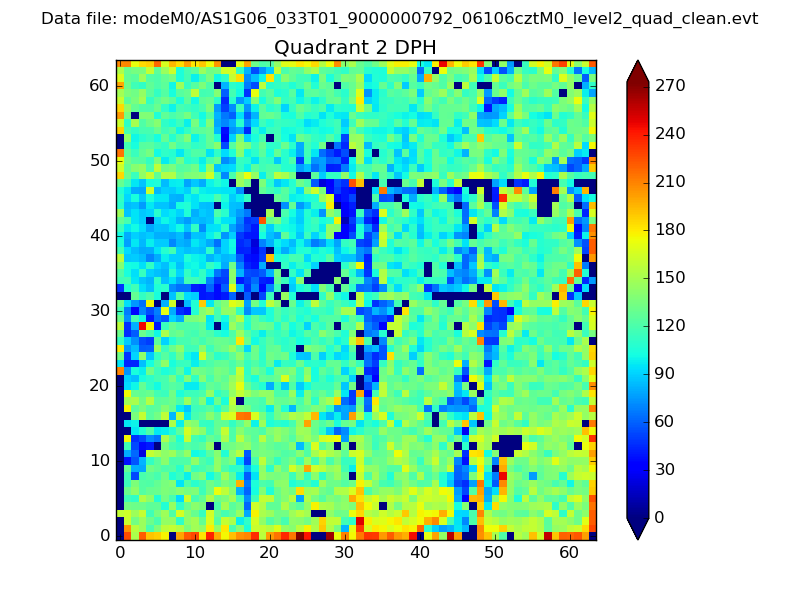
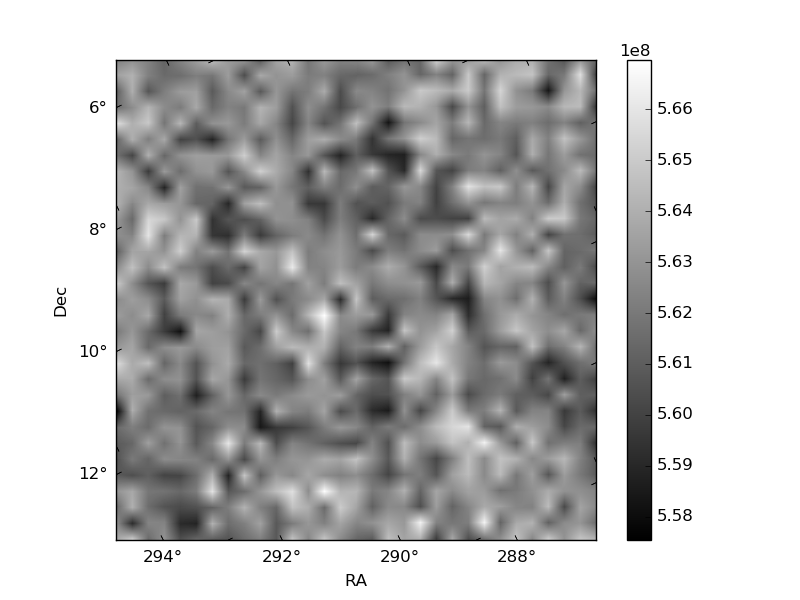
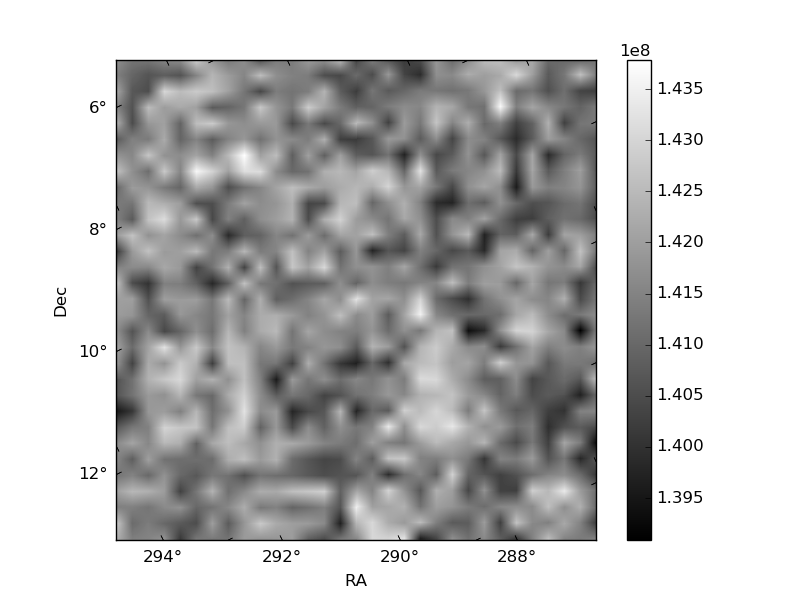
Histogram calculated using DETX and DETY for each event in the final _common_clean file
| Quadrant A |  |
 |
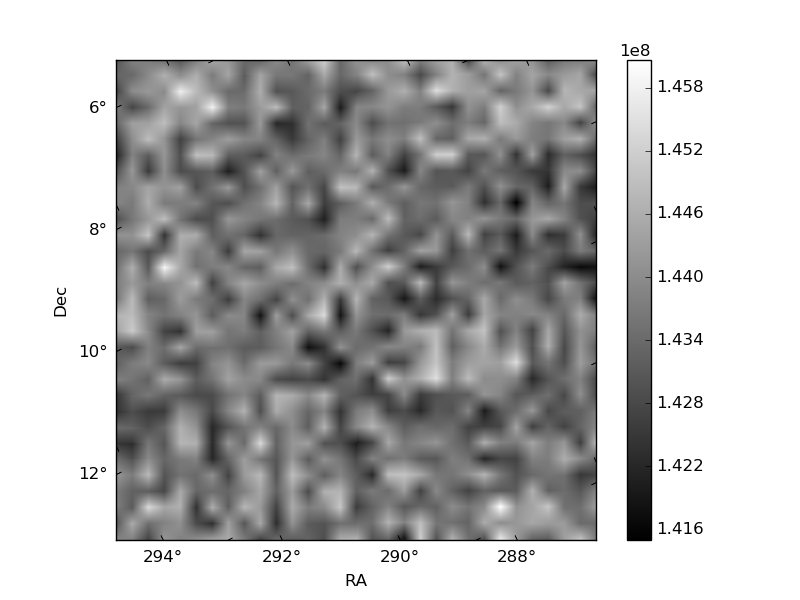
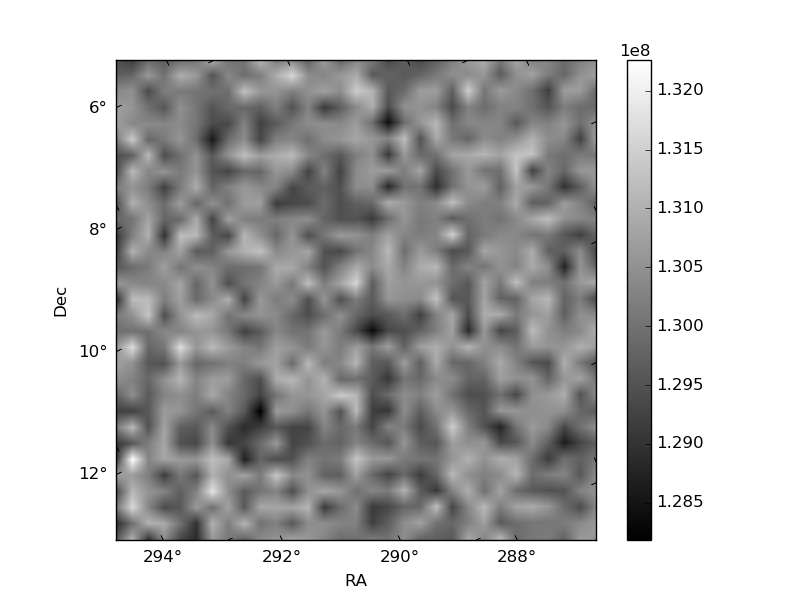
Quadrant B |
|---|---|---|---|
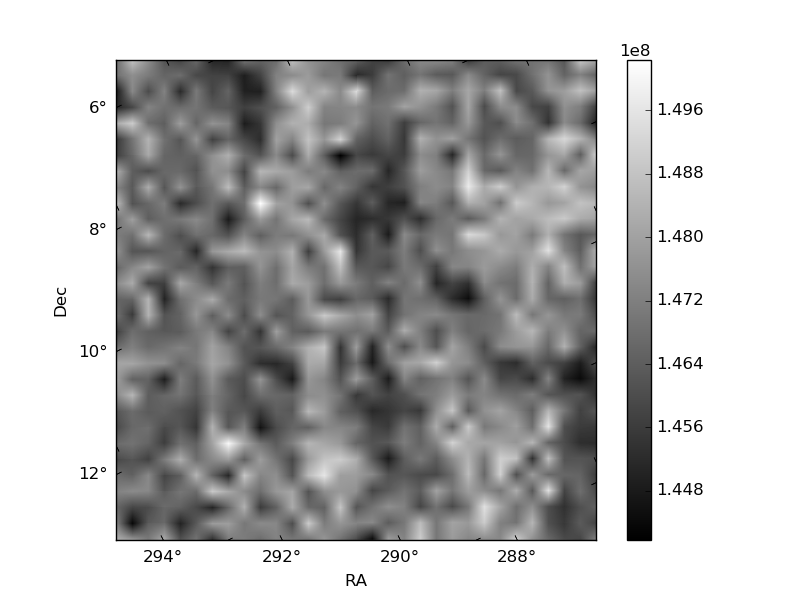
| Quadrant D | 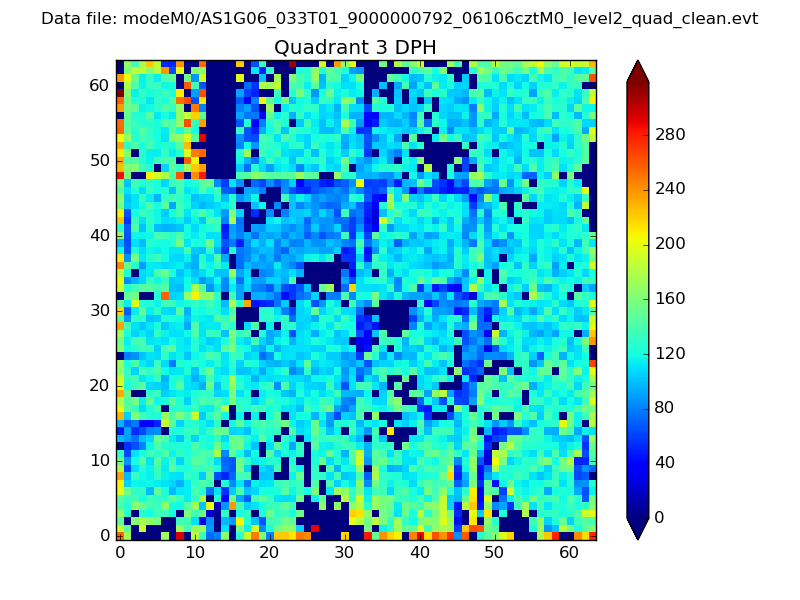 |
 |
Quadrant C |
| Plot type | Count rate plots | Images |
|---|---|---|
| Comparison with Poisson distribution Blue bars denote a histogram of data divided into 1 sec bins. Red curve is a Poisson curve with rate = median count rate of data. |
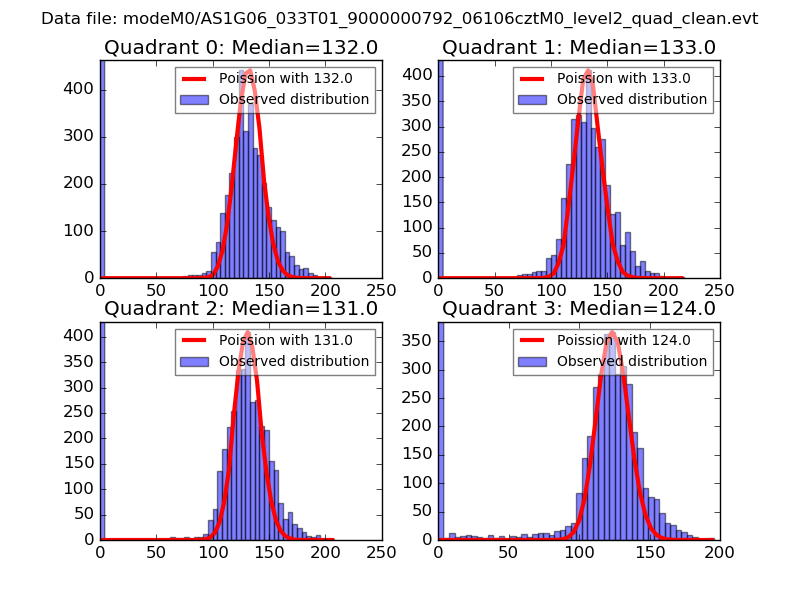 |
 |
| Quadrant-wise count rates Data is divided into 100 sec bins |
 |
|
| Module-wise count rates for Quadrant A Data is divided into 100 sec bins |
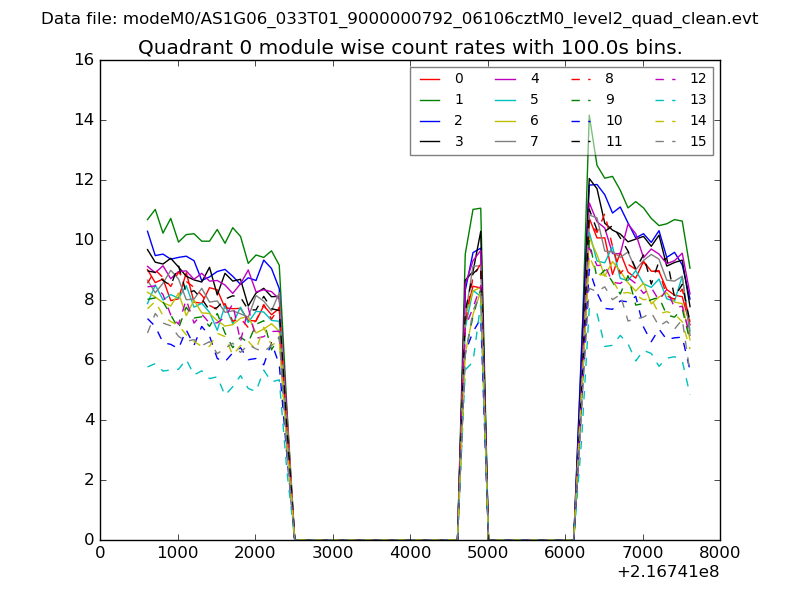 |
 |
| Module-wise count rates for Quadrant B Data is divided into 100 sec bins |
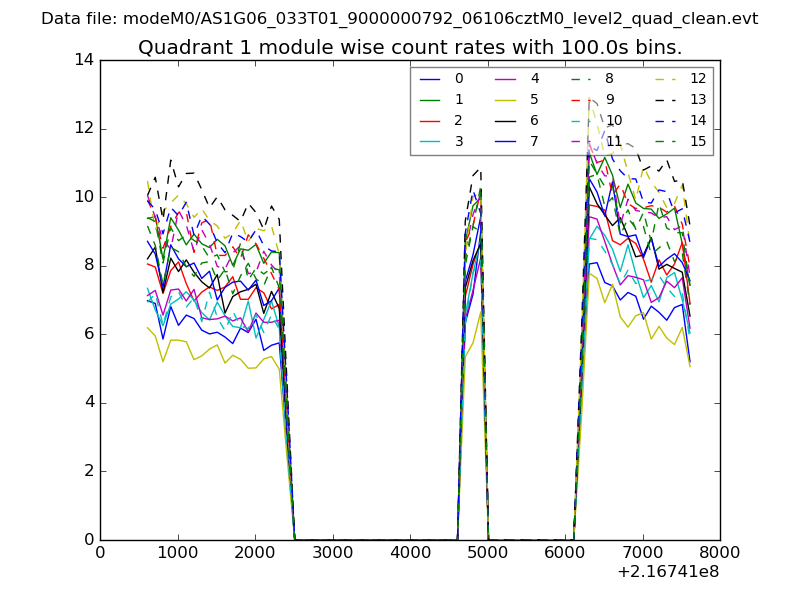 |
 |
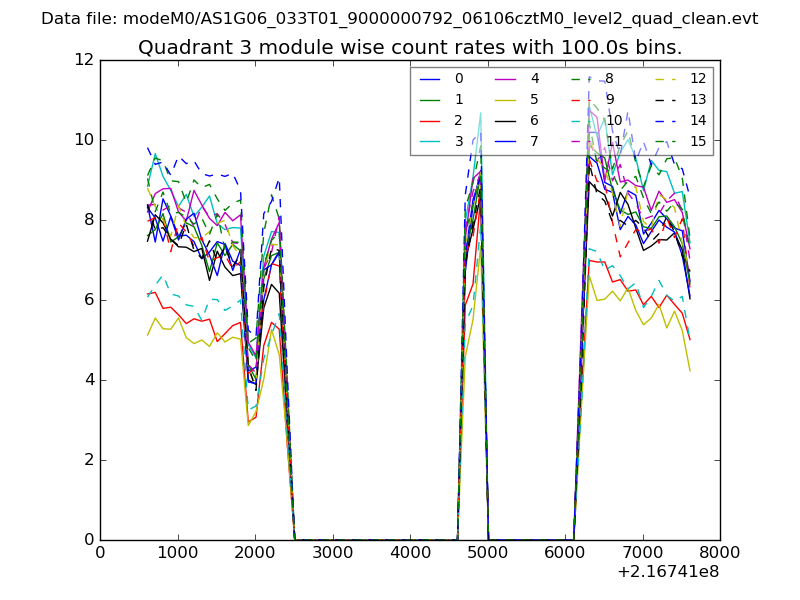
| Module-wise count rates for Quadrant C Data is divided into 100 sec bins |
 |
 |
| Module-wise count rates for Quadrant D Data is divided into 100 sec bins |
 |
 |
| Parameter | Plot |
|---|---|
| CZT HV Monitor | 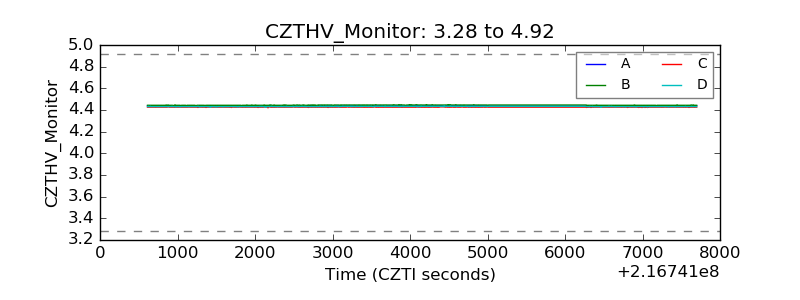 |
| D_VDD | 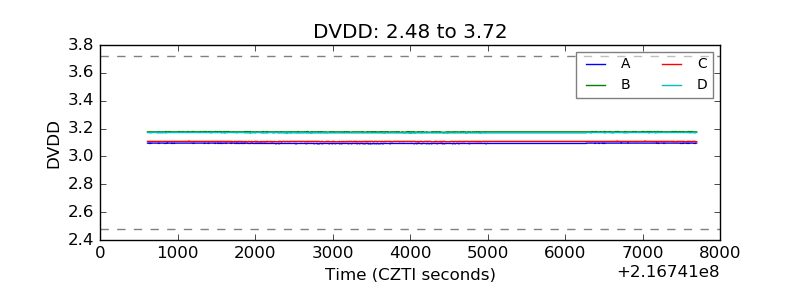 |
| Temperature 1 | 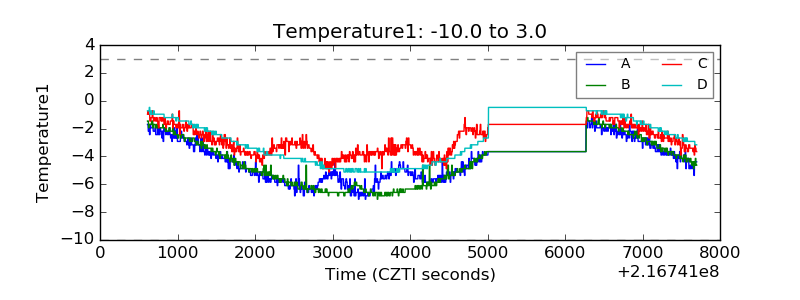 |
| Veto HV Monitor | 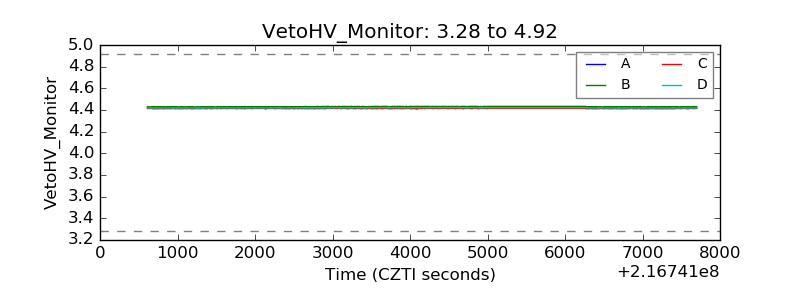 |
| Veto LLD | 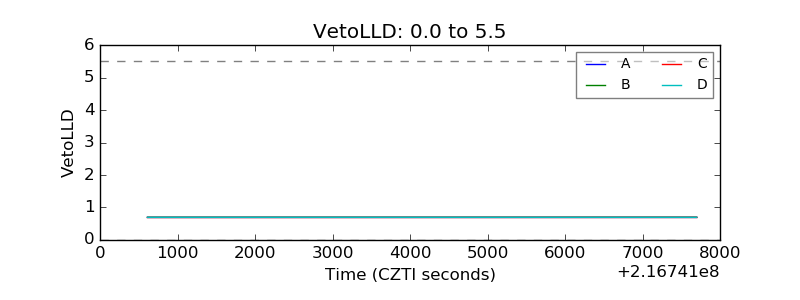 |
| Alpha Counter | 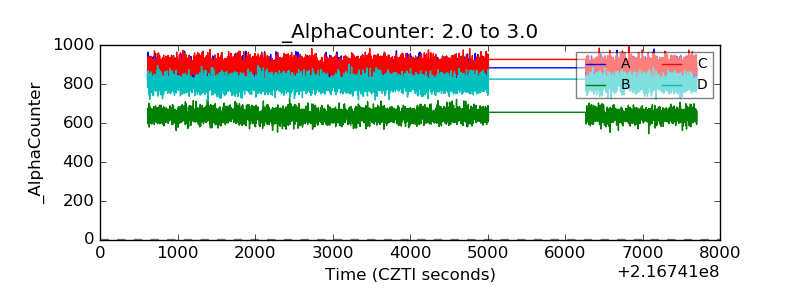 |
| _CPM_Rate | 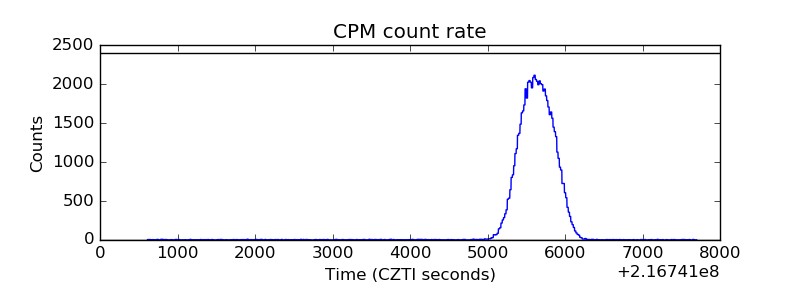 |
| CZT Counter | 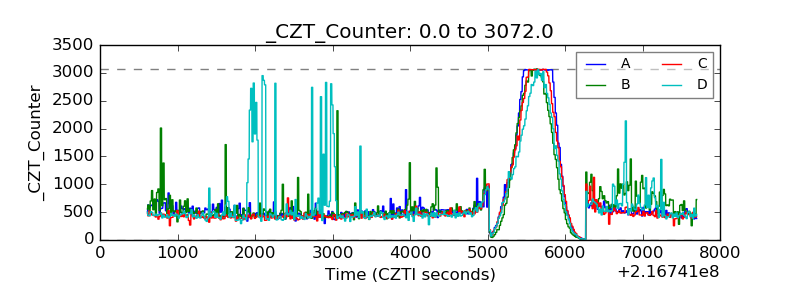 |
| +2.5 Volts monitor |  |
| +5 Volts monitor |  |
| _ROLL_ROT | 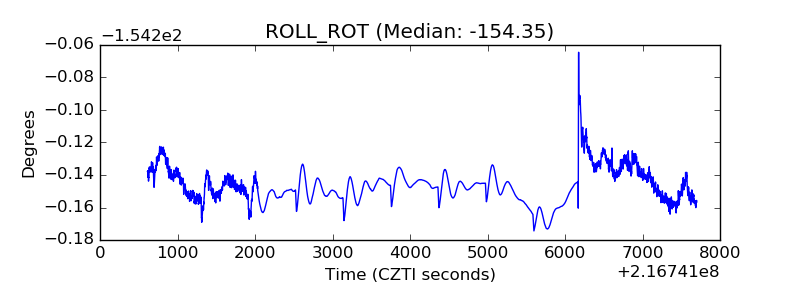 |
| _Roll_DEC | 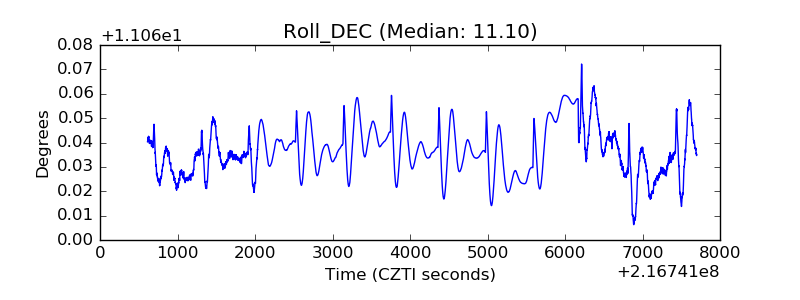 |
| _Roll_RA | 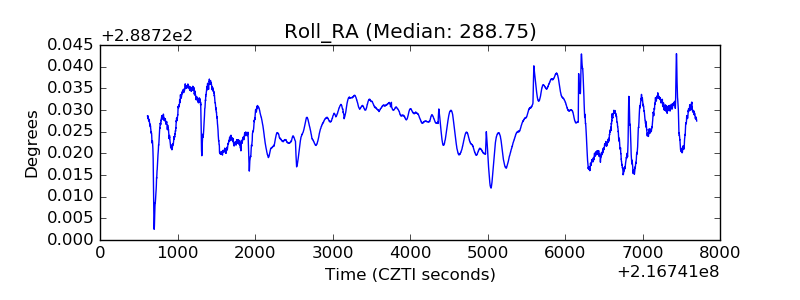 |
| Veto Counter | 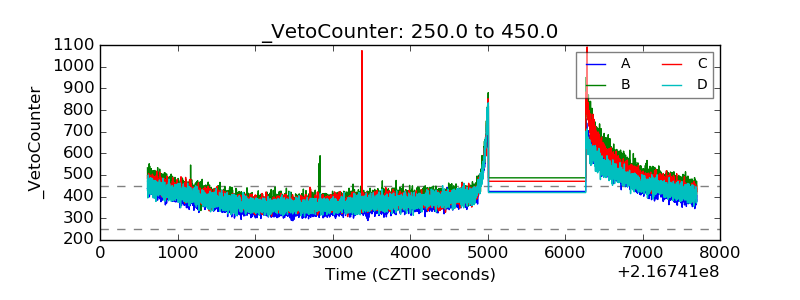 |