| Param | Original file | Final file |
|---|---|---|
| Filename | modeM0/AS1G06_033T01_9000000792_06108cztM0_level2.evt | modeM0/AS1G06_033T01_9000000792_06108cztM0_level2_quad_clean.evt |
| Size (bytes) | 425,185,920 | 77,351,040 |
| Size | 405.5 MB | 73.8 MB |
| Events in quadrant A | 2,853,610 | 488,411 |
| Events in quadrant B | 3,894,935 | 488,667 |
| Events in quadrant C | 2,745,614 | 489,305 |
| Events in quadrant D | 2,982,032 | 464,109 |
| Mode M0 | |||
|---|---|---|---|
| Quadrant | BADHDUFLAG | Total packets | Discarded packets |
| A | 0 | 12185 | 2 |
| B | 0 | 15366 | 1 |
| C | 0 | 12053 | 1 |
| D | 0 | 12913 | 1 |
| Mode SS | |||
|---|---|---|---|
| Quadrant | BADHDUFLAG | Total packets | Discarded packets |
| A | 0 | 122 | 0 |
| B | 0 | 122 | 0 |
| C | 0 | 122 | 0 |
| D | 0 | 122 | 0 |
| Mode M9 | |||
|---|---|---|---|
| Quadrant | BADHDUFLAG | Total packets | Discarded packets |
| A | 0 | 14 | 0 |
| B | 0 | 14 | 0 |
| C | 0 | 14 | 0 |
| D | 0 | 14 | 0 |
| Quadrant | Total seconds | Saturated seconds | Saturation percentage |
|---|---|---|---|
| A | 5891 | 22 | 0.373451% |
| B | 5891 | 207 | 3.513835% |
| C | 5891 | 16 | 0.271601% |
| D | 5891 | 30 | 0.509251% |
Noise dominated data is calculated using 1-second bins in cleaned event files. If a bin has >2000 counts, and if more than 50% of those come from <1% of pixels, then it is considered to be noise-dominated and hence unusable.
| Quadrant | # 1 sec bins | Bins with >0 counts | Bins with >2000 counts | High rate bins dominated by noise | Noise dominated (total time) | Noise dominated (detector-on time) | Marked lightcurve |
|---|---|---|---|---|---|---|---|
| A | 7256 | 5893 | 0 | 0 | 0.00% | 0.00% | 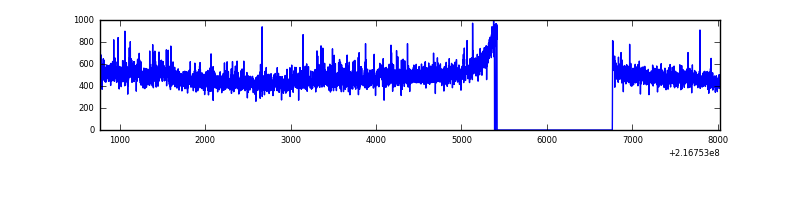 |
| B | 7256 | 5893 | 148 | 148 | 2.04% | 2.51% | 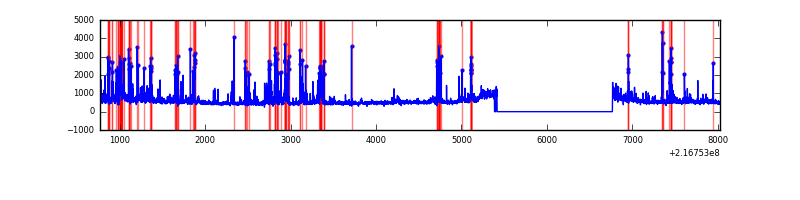 |
| C | 7256 | 5893 | 2 | 2 | 0.03% | 0.03% | 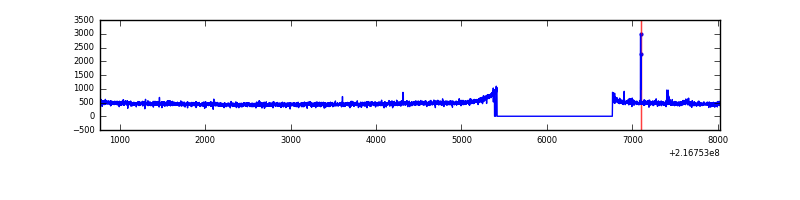 |
| D | 7256 | 5893 | 21 | 21 | 0.29% | 0.36% | 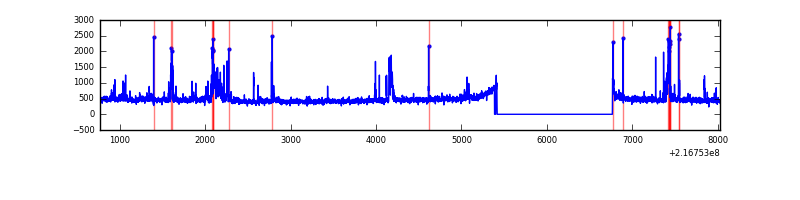 |
Top three noisy pixels from each quadrant. If the there are fewer than three noisy pixels in the level2.evt file, extra rows are filled as -1
| Pixel properties | Quadrant properties | ||||||
|---|---|---|---|---|---|---|---|
| Quadrant | DetID | PixID | Counts | Sigma | Mean | Median | Sigma |
| A | 8 | 15 | 131431 | 905.53 | 706 | 692 | 144.4 |
| A | 12 | 194 | 6960 | 43.41 | 706 | 692 | 144.4 |
| A | 0 | 226 | 6825 | 42.48 | 706 | 692 | 144.4 |
| B | 3 | 64 | 769462 | 5678.56 | 710 | 695 | 135.4 |
| B | 15 | 204 | 253081 | 1864.27 | 710 | 695 | 135.4 |
| B | 0 | 219 | 37093 | 268.86 | 710 | 695 | 135.4 |
| C | 1 | 16 | 36388 | 219.22 | 694 | 699 | 162.8 |
| C | 13 | 61 | 5520 | 29.61 | 694 | 699 | 162.8 |
| C | 9 | 54 | 3336 | 16.2 | 694 | 699 | 162.8 |
| D | 11 | 241 | 120239 | 705.5 | 687 | 667 | 169.5 |
| D | 2 | 33 | 95857 | 561.64 | 687 | 667 | 169.5 |
| D | 2 | 14 | 60728 | 354.37 | 687 | 667 | 169.5 |
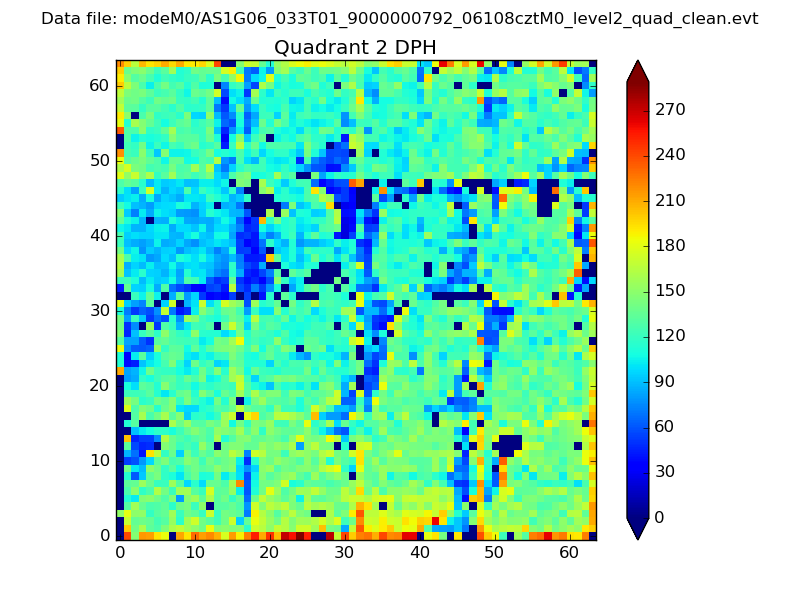
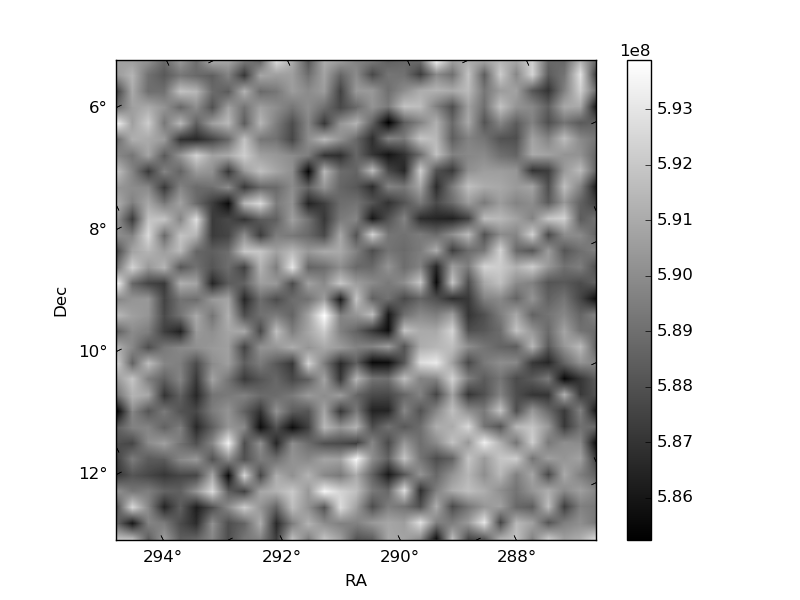
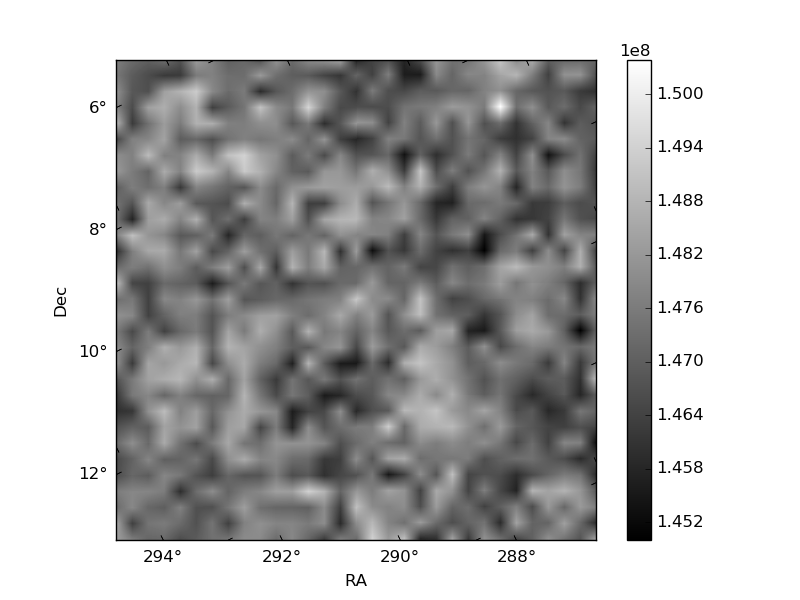
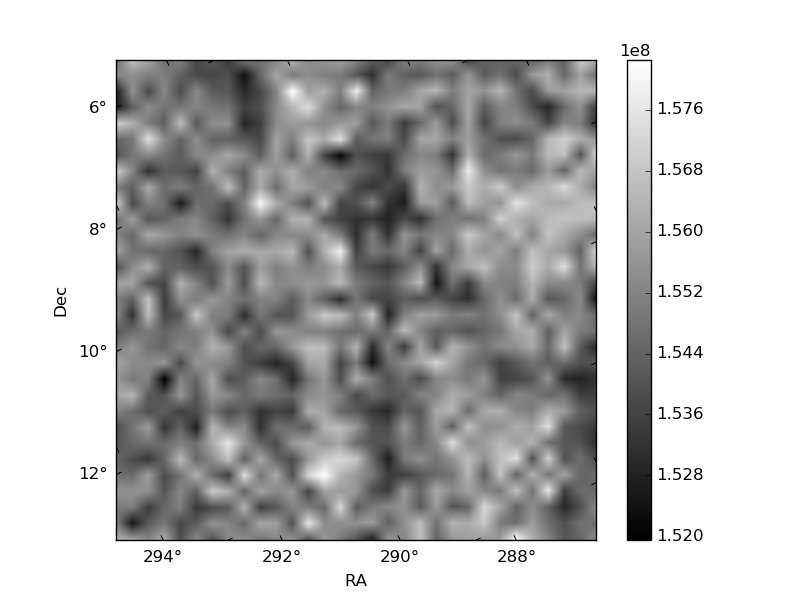
Histogram calculated using DETX and DETY for each event in the final _common_clean file
| Quadrant A | 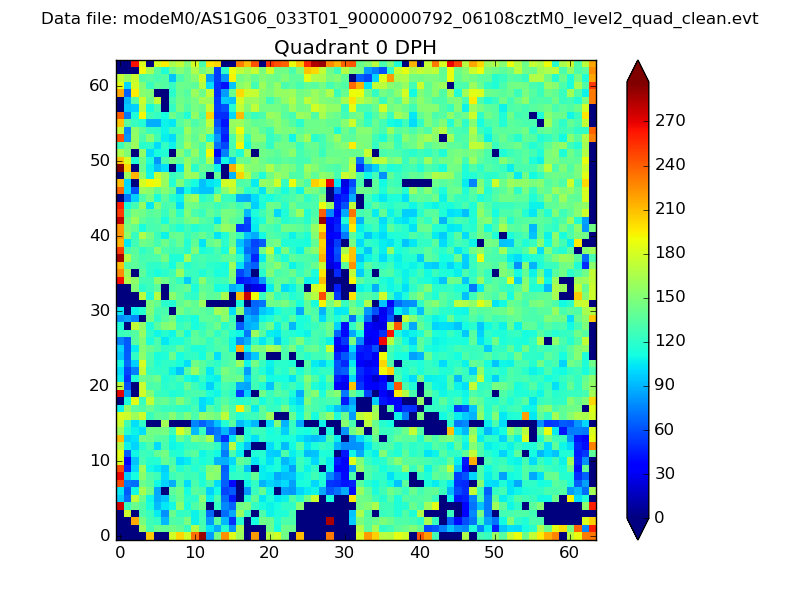 |
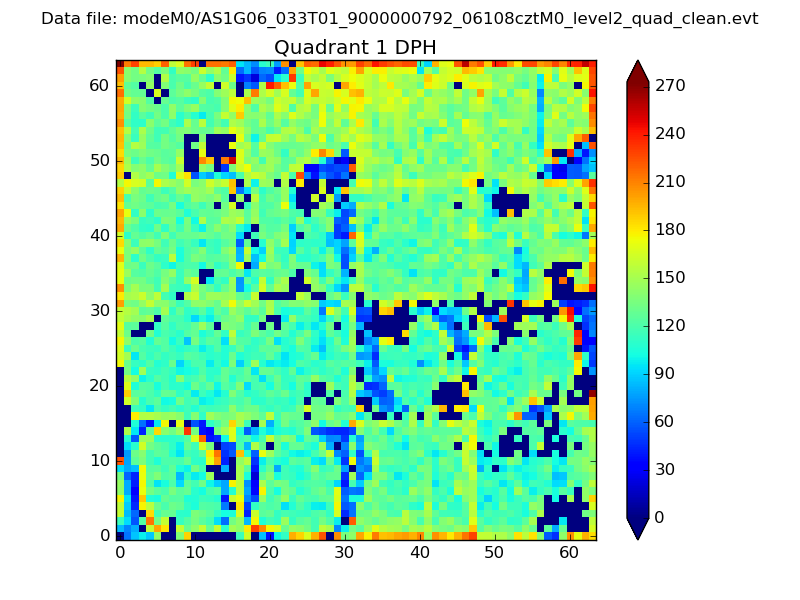 |
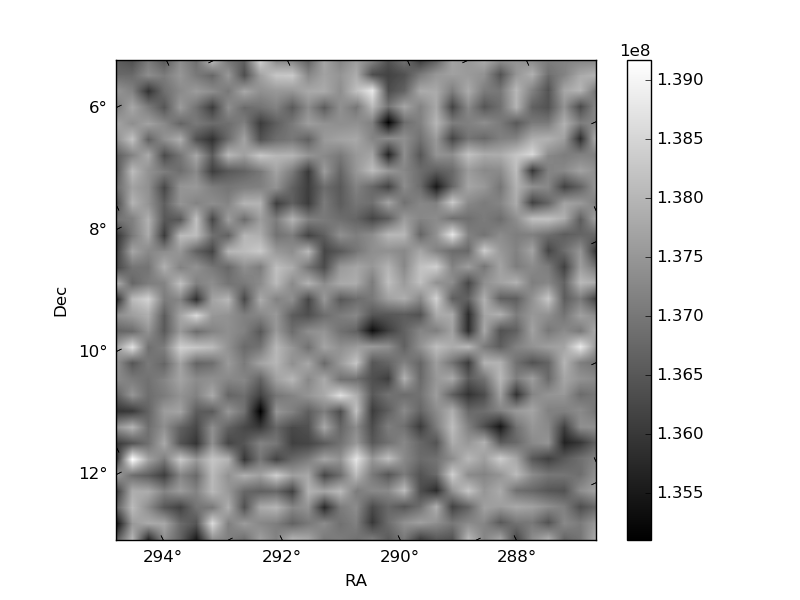
Quadrant B |
|---|---|---|---|
| Quadrant D | 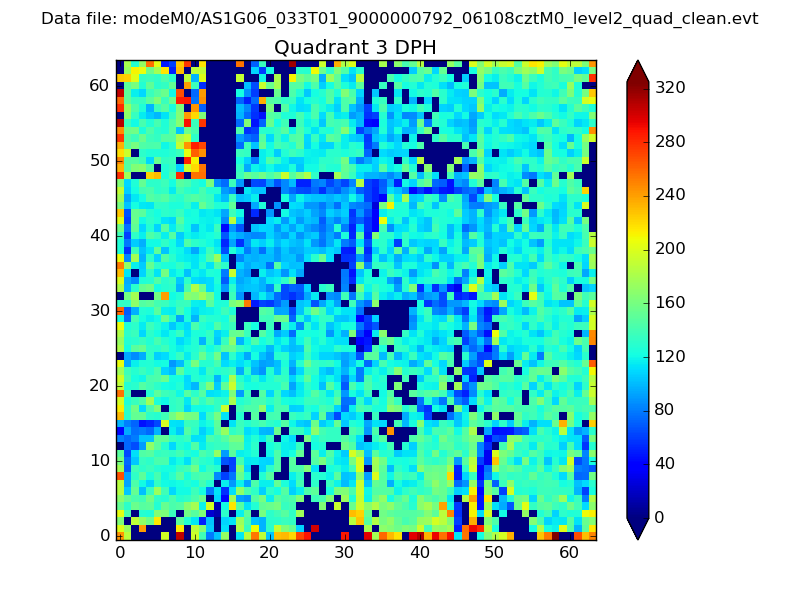 |
 |
Quadrant C |
| Plot type | Count rate plots | Images |
|---|---|---|
| Comparison with Poisson distribution Blue bars denote a histogram of data divided into 1 sec bins. Red curve is a Poisson curve with rate = median count rate of data. |
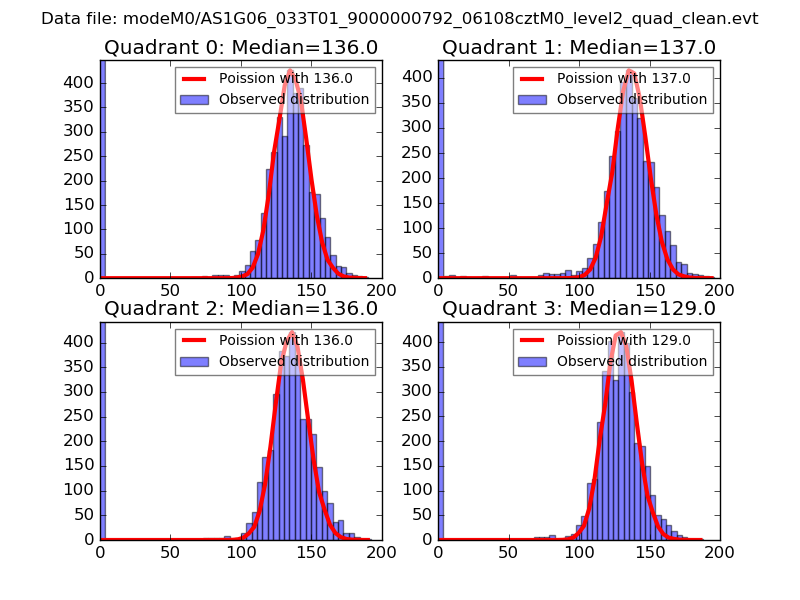 |
 |
| Quadrant-wise count rates Data is divided into 100 sec bins |
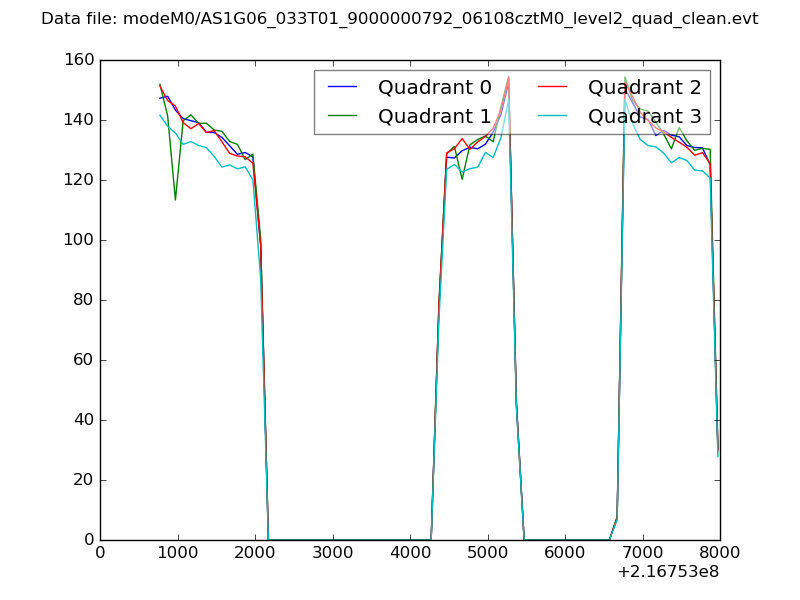 |
|
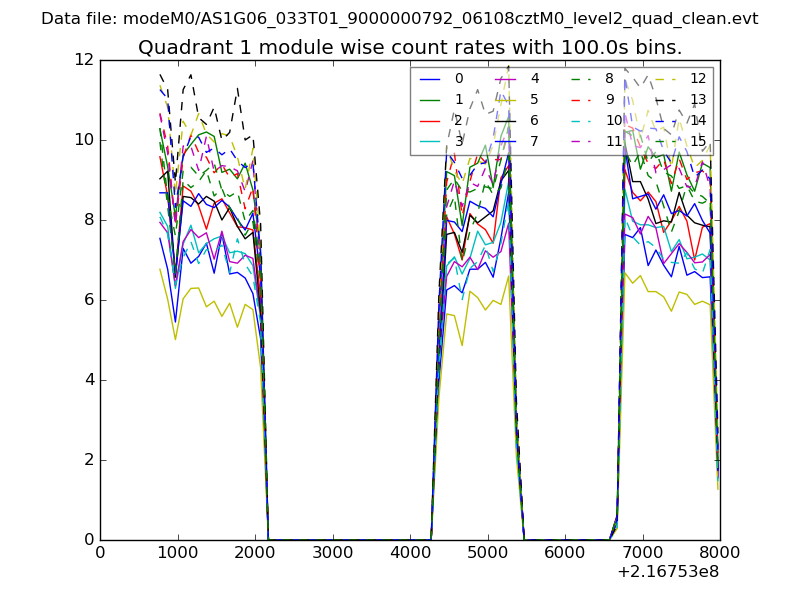
| Module-wise count rates for Quadrant A Data is divided into 100 sec bins |
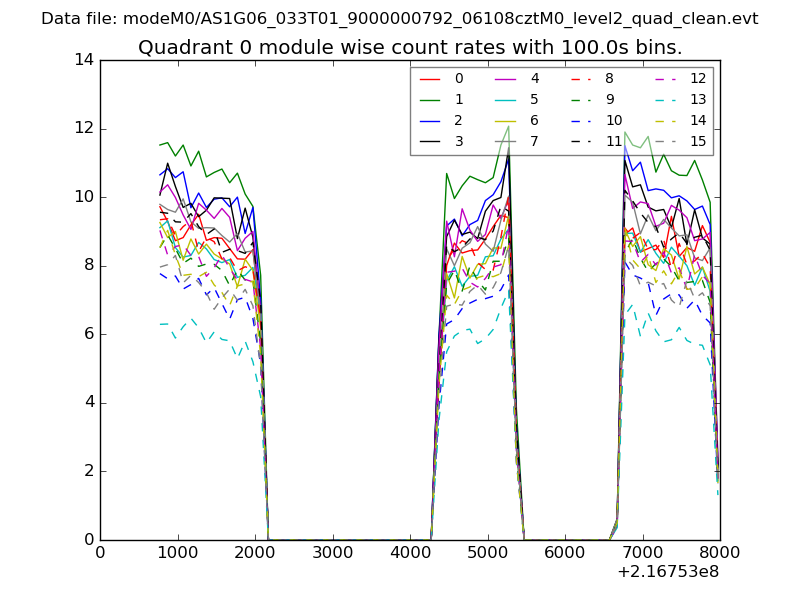 |
 |
| Module-wise count rates for Quadrant B Data is divided into 100 sec bins |
 |
 |
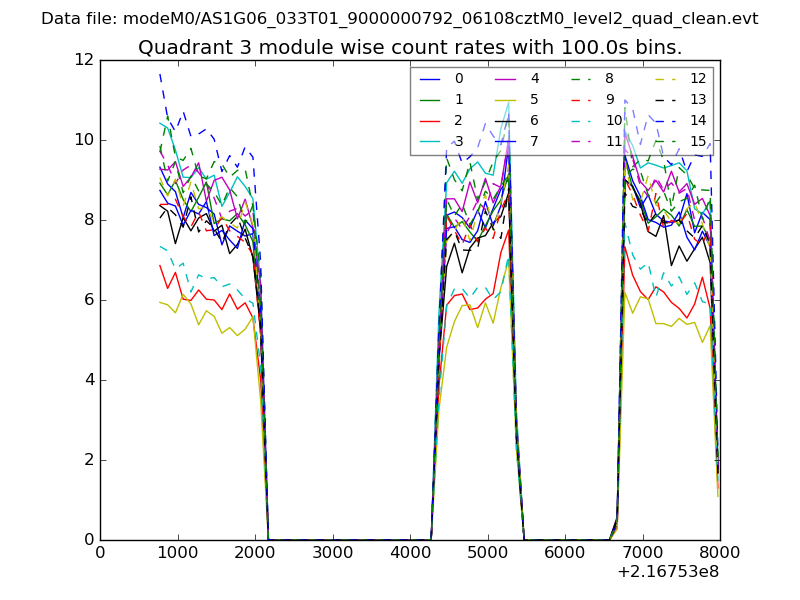
| Module-wise count rates for Quadrant C Data is divided into 100 sec bins |
 |
 |
| Module-wise count rates for Quadrant D Data is divided into 100 sec bins |
 |
 |
| Parameter | Plot |
|---|---|
| CZT HV Monitor | 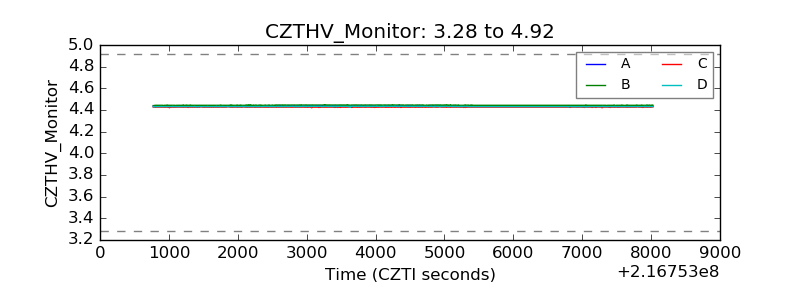 |
| D_VDD | 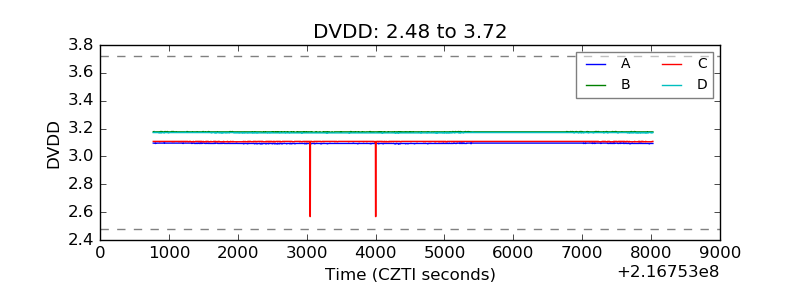 |
| Temperature 1 | 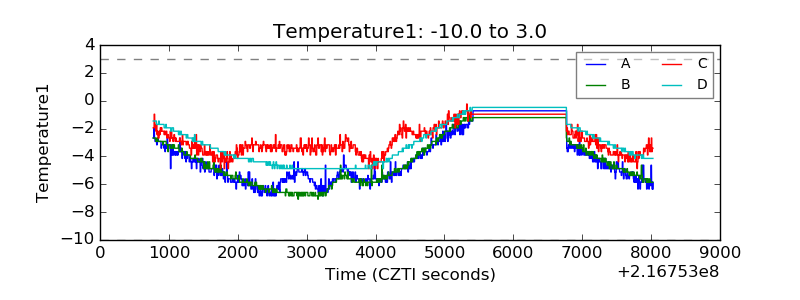 |
| Veto HV Monitor | 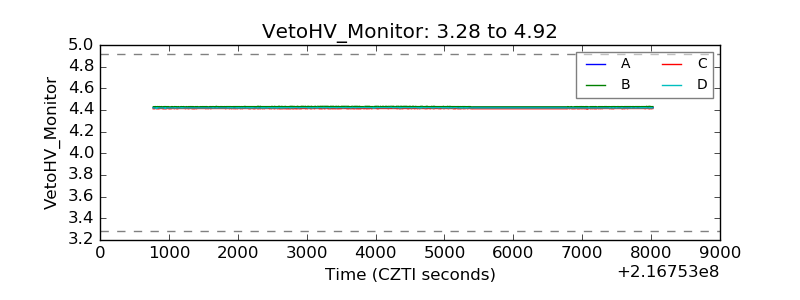 |
| Veto LLD | 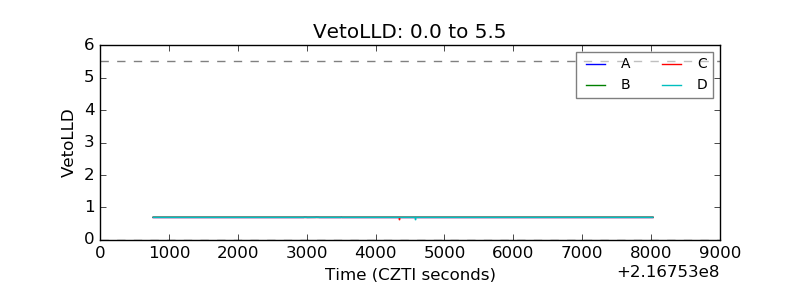 |
| Alpha Counter | 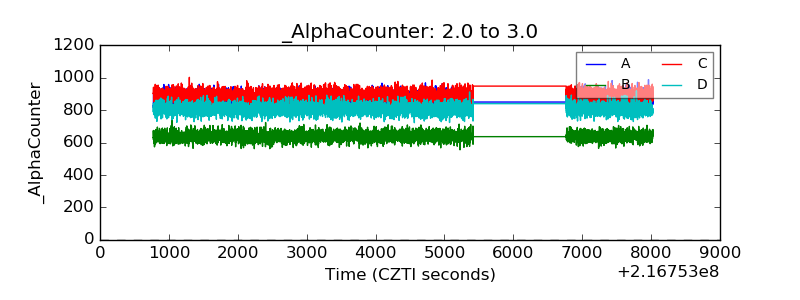 |
| _CPM_Rate | 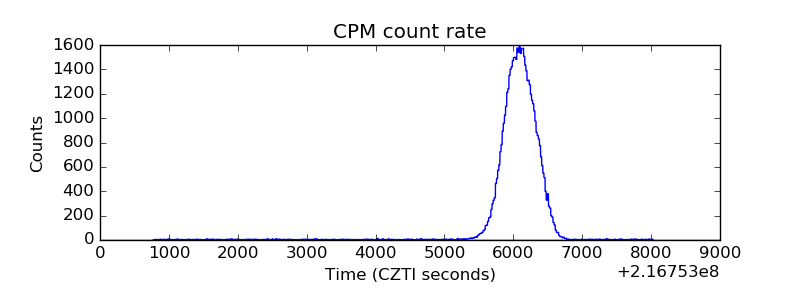 |
| CZT Counter | 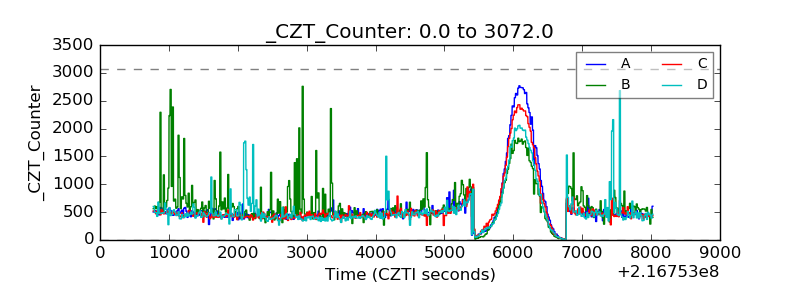 |
| +2.5 Volts monitor |  |
| +5 Volts monitor | 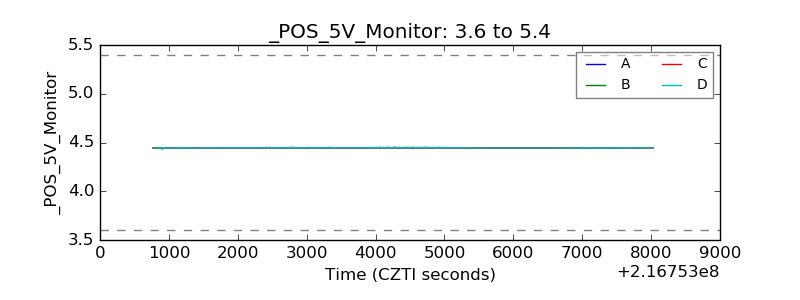 |
| _ROLL_ROT | 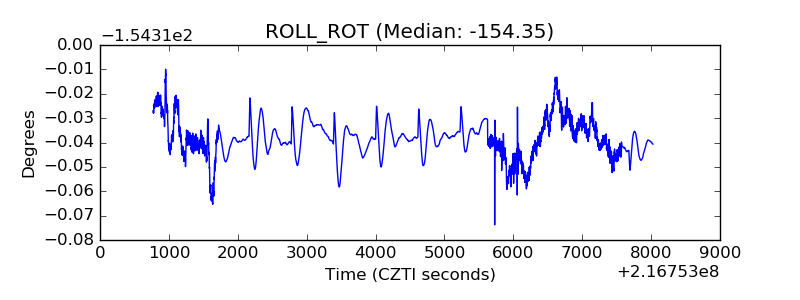 |
| _Roll_DEC | 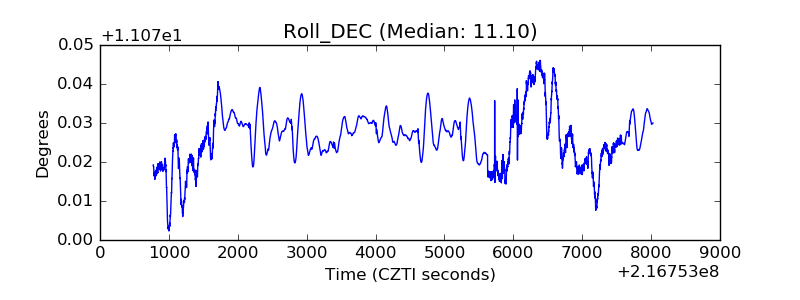 |
| _Roll_RA | 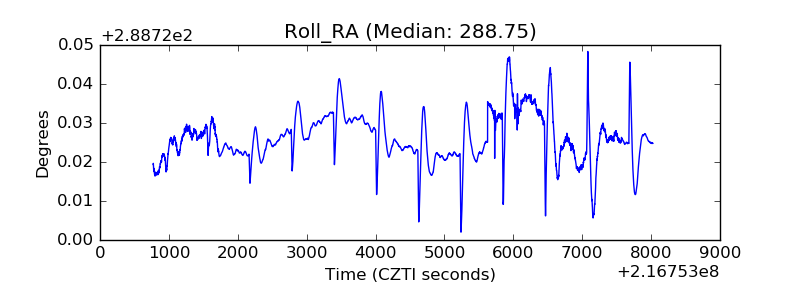 |
| Veto Counter | 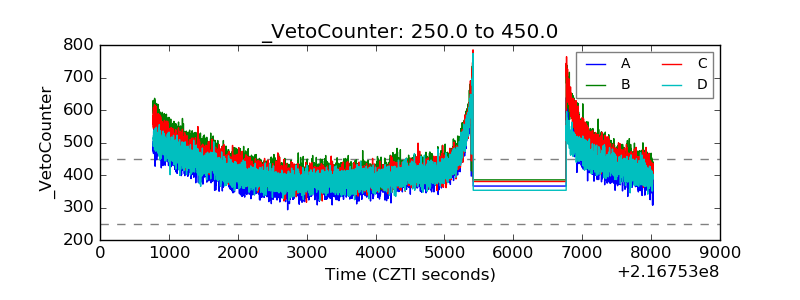 |