| Param | Original file | Final file |
|---|---|---|
| Filename | modeM0/AS1G06_033T01_9000000792_06110cztM0_level2.evt | modeM0/AS1G06_033T01_9000000792_06110cztM0_level2_quad_clean.evt |
| Size (bytes) | 490,651,200 | 71,182,080 |
| Size | 467.9 MB | 67.9 MB |
| Events in quadrant A | 3,057,548 | 429,510 |
| Events in quadrant B | 3,516,095 | 430,252 |
| Events in quadrant C | 3,014,317 | 424,998 |
| Events in quadrant D | 4,821,629 | 408,587 |
| Mode M0 | |||
|---|---|---|---|
| Quadrant | BADHDUFLAG | Total packets | Discarded packets |
| A | 0 | 13626 | 2 |
| B | 0 | 14749 | 1 |
| C | 0 | 13565 | 1 |
| D | 0 | 18926 | 1 |
| Mode SS | |||
|---|---|---|---|
| Quadrant | BADHDUFLAG | Total packets | Discarded packets |
| A | 0 | 134 | 0 |
| B | 0 | 134 | 0 |
| C | 0 | 134 | 0 |
| D | 0 | 134 | 0 |
| Mode M9 | |||
|---|---|---|---|
| Quadrant | BADHDUFLAG | Total packets | Discarded packets |
| A | 0 | 10 | 0 |
| B | 0 | 10 | 0 |
| C | 0 | 10 | 0 |
| D | 0 | 10 | 0 |
| Quadrant | Total seconds | Saturated seconds | Saturation percentage |
|---|---|---|---|
| A | 6627 | 51 | 0.769579% |
| B | 6627 | 88 | 1.327901% |
| C | 6627 | 49 | 0.739399% |
| D | 6627 | 248 | 3.742266% |
Noise dominated data is calculated using 1-second bins in cleaned event files. If a bin has >2000 counts, and if more than 50% of those come from <1% of pixels, then it is considered to be noise-dominated and hence unusable.
| Quadrant | # 1 sec bins | Bins with >0 counts | Bins with >2000 counts | High rate bins dominated by noise | Noise dominated (total time) | Noise dominated (detector-on time) | Marked lightcurve |
|---|---|---|---|---|---|---|---|
| A | 7572 | 6628 | 0 | 0 | 0.00% | 0.00% | 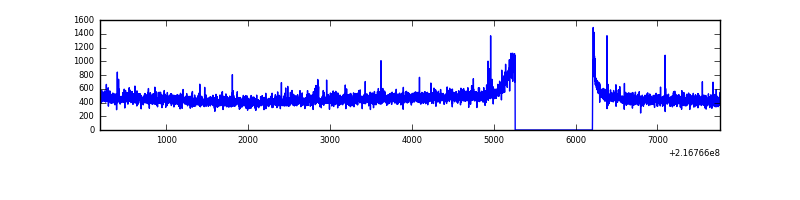 |
| B | 7572 | 6628 | 17 | 17 | 0.22% | 0.26% | 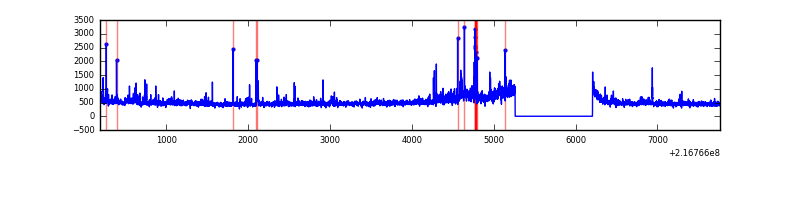 |
| C | 7572 | 6627 | 0 | 0 | 0.00% | 0.00% | 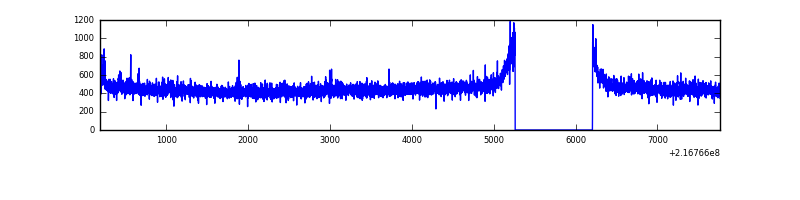 |
| D | 7572 | 6628 | 78 | 78 | 1.03% | 1.18% | 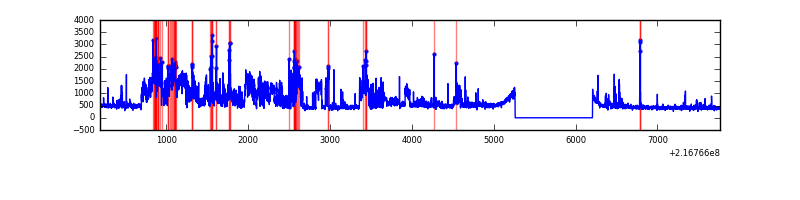 |
Top three noisy pixels from each quadrant. If the there are fewer than three noisy pixels in the level2.evt file, extra rows are filled as -1
| Pixel properties | Quadrant properties | ||||||
|---|---|---|---|---|---|---|---|
| Quadrant | DetID | PixID | Counts | Sigma | Mean | Median | Sigma |
| A | 8 | 15 | 57225 | 355.51 | 775 | 757 | 158.8 |
| A | 0 | 226 | 7395 | 41.79 | 775 | 757 | 158.8 |
| A | 12 | 194 | 7355 | 41.54 | 775 | 757 | 158.8 |
| B | 15 | 204 | 196437 | 1288.31 | 786 | 768 | 151.9 |
| B | 3 | 64 | 126835 | 830.04 | 786 | 768 | 151.9 |
| B | 0 | 214 | 59493 | 386.65 | 786 | 768 | 151.9 |
| C | 1 | 16 | 36579 | 202.73 | 760 | 765 | 176.7 |
| C | 13 | 61 | 6116 | 30.29 | 760 | 765 | 176.7 |
| C | 8 | 128 | 5453 | 26.54 | 760 | 765 | 176.7 |
| D | 13 | 169 | 1755188 | 9421.32 | 751 | 727 | 186.2 |
| D | 13 | 105 | 98851 | 526.92 | 751 | 727 | 186.2 |
| D | 2 | 33 | 50006 | 264.62 | 751 | 727 | 186.2 |
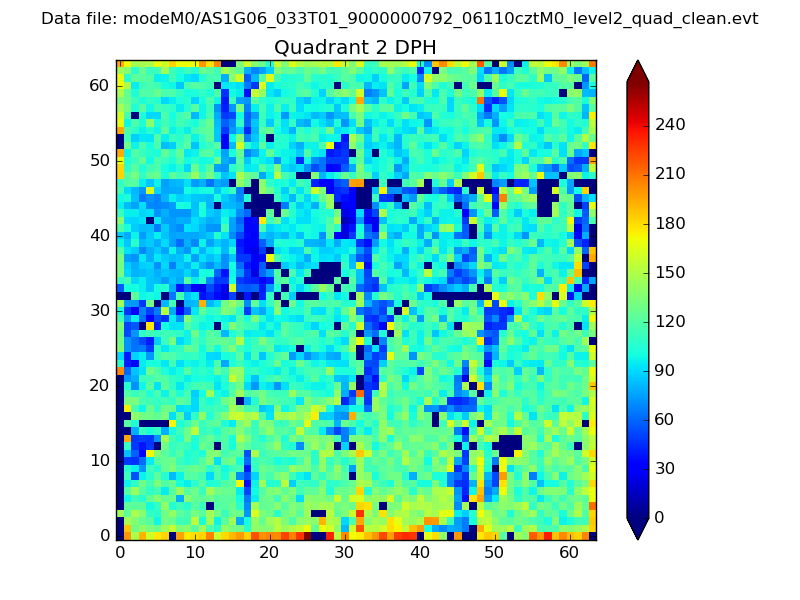
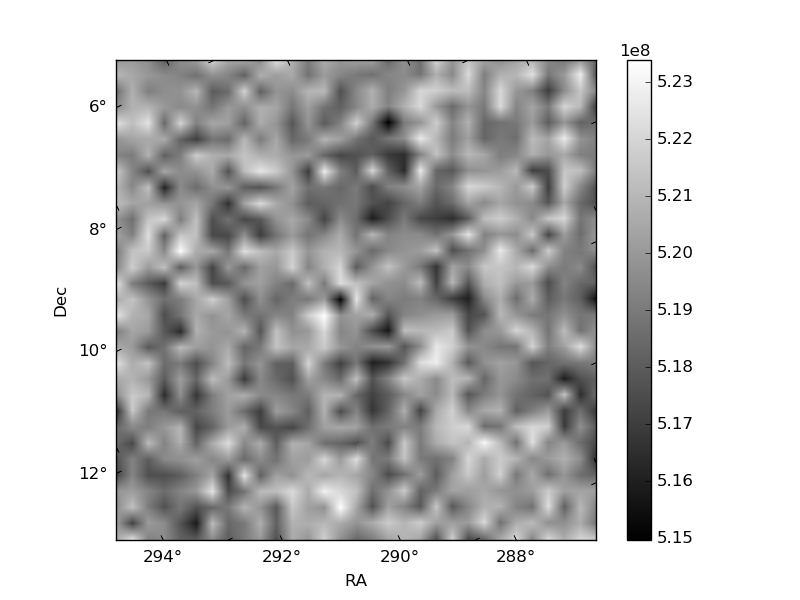
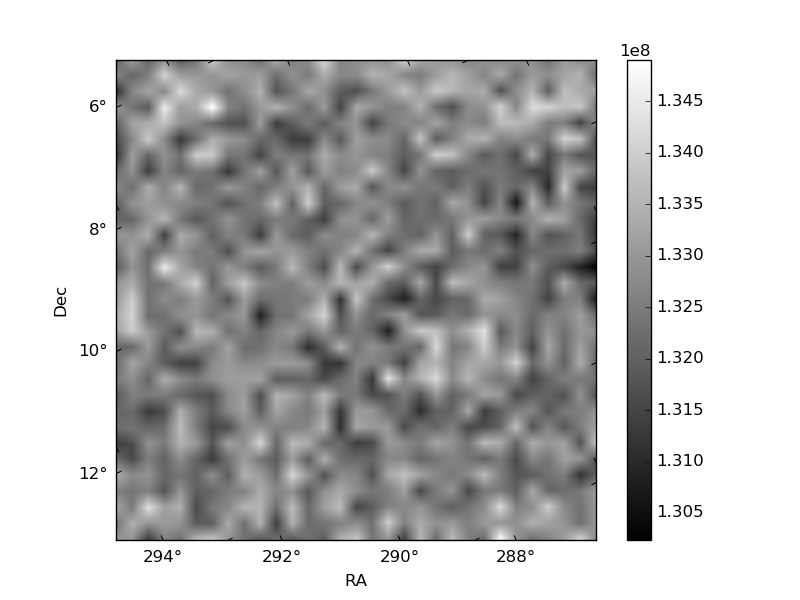
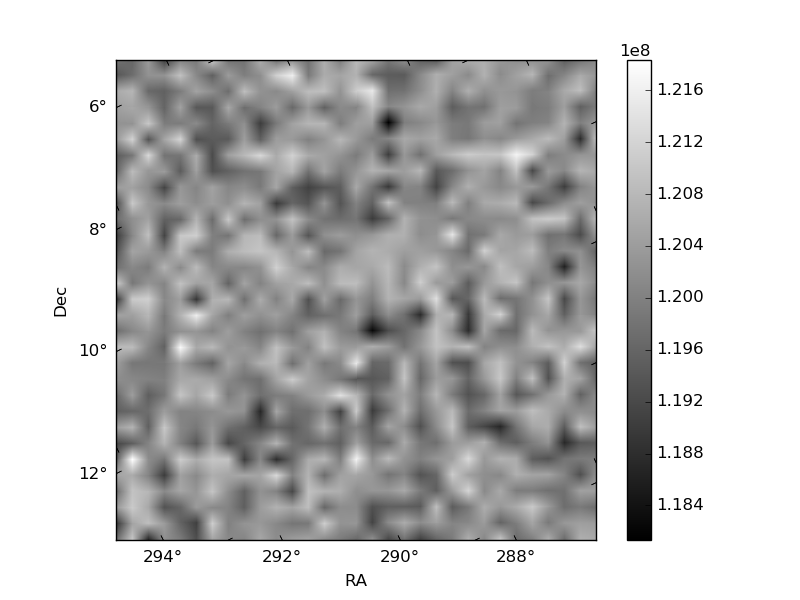
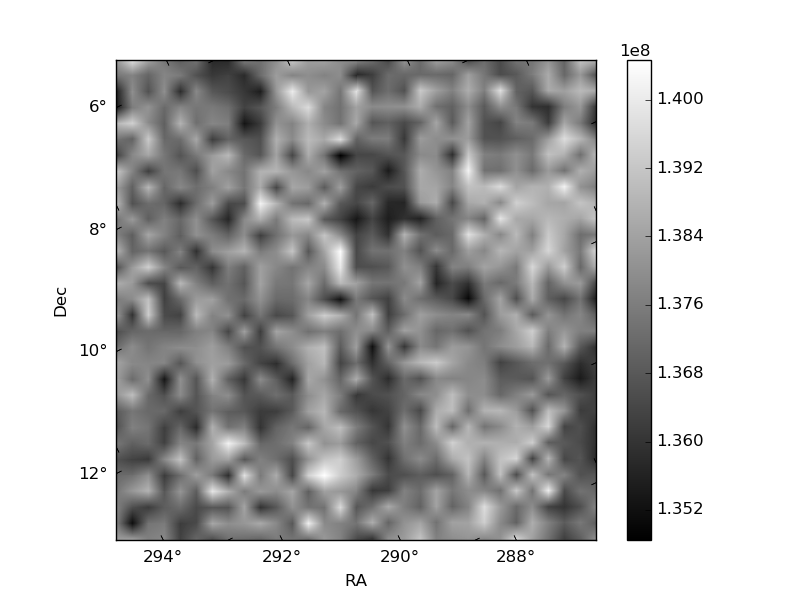
Histogram calculated using DETX and DETY for each event in the final _common_clean file
| Quadrant A | 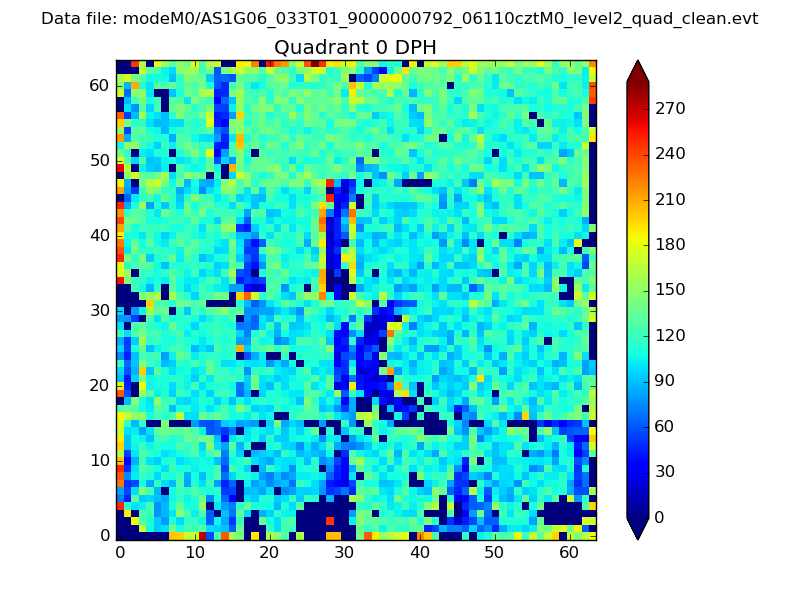 |
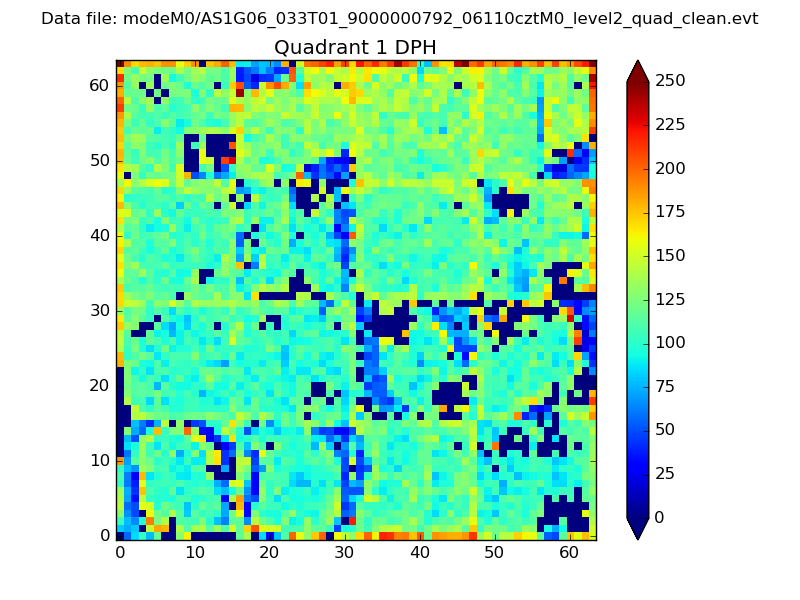 |
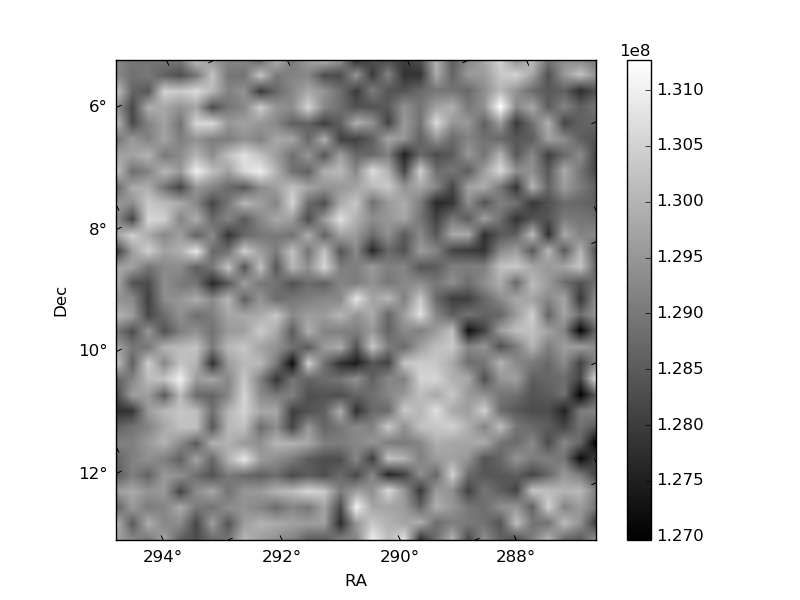
Quadrant B |
|---|---|---|---|
| Quadrant D | 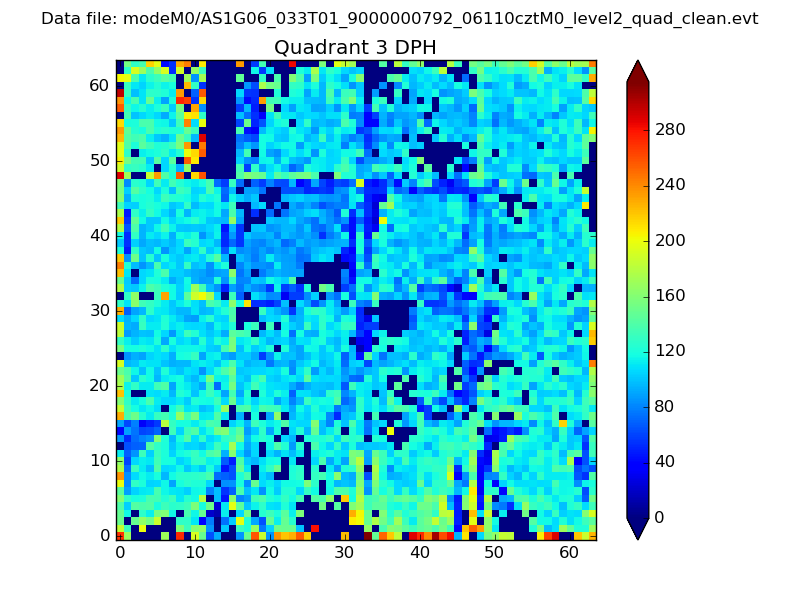 |
 |
Quadrant C |
| Plot type | Count rate plots | Images |
|---|---|---|
| Comparison with Poisson distribution Blue bars denote a histogram of data divided into 1 sec bins. Red curve is a Poisson curve with rate = median count rate of data. |
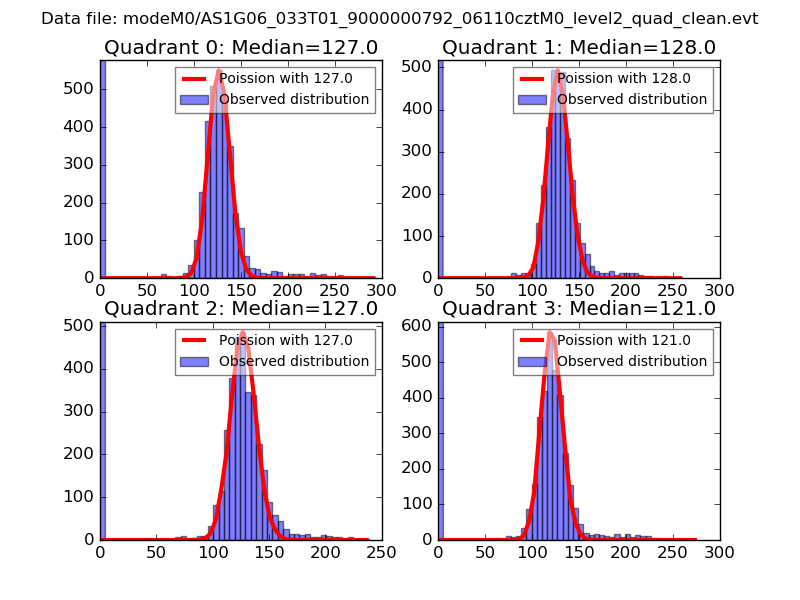 |
 |
| Quadrant-wise count rates Data is divided into 100 sec bins |
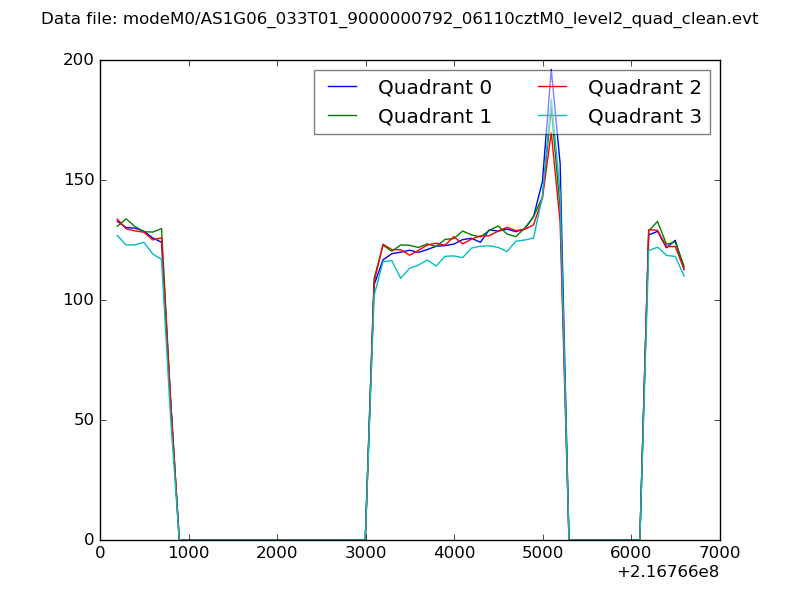 |
|
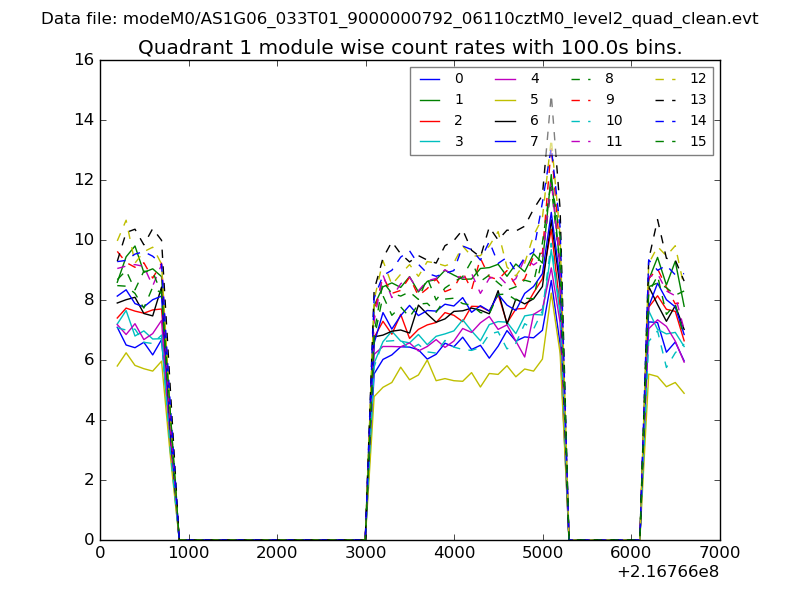
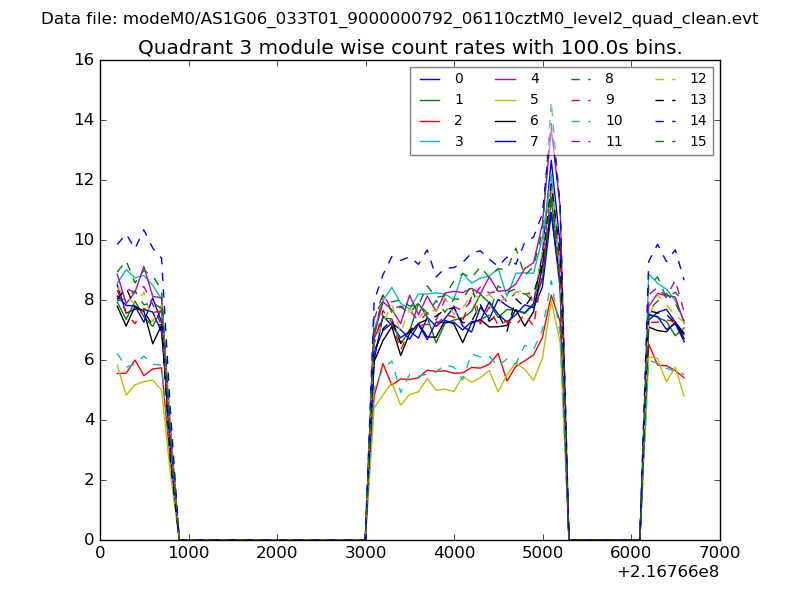
| Module-wise count rates for Quadrant A Data is divided into 100 sec bins |
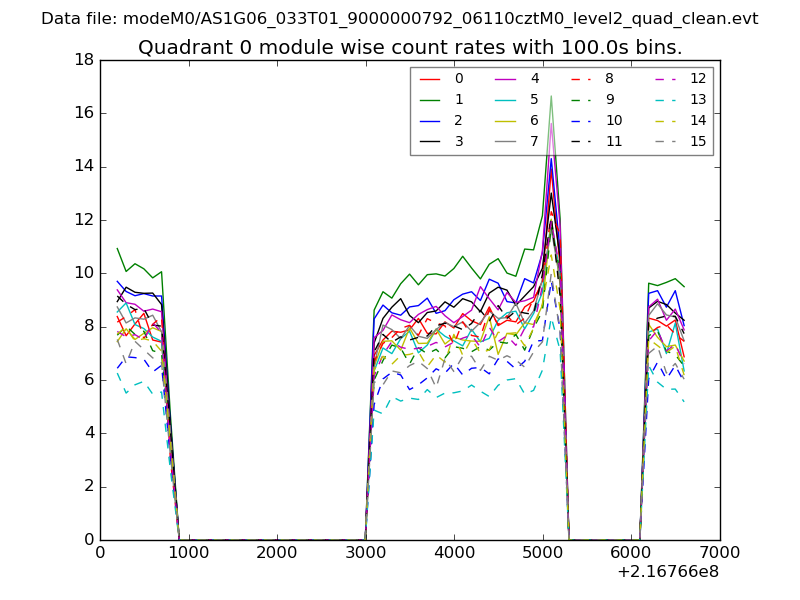 |
 |
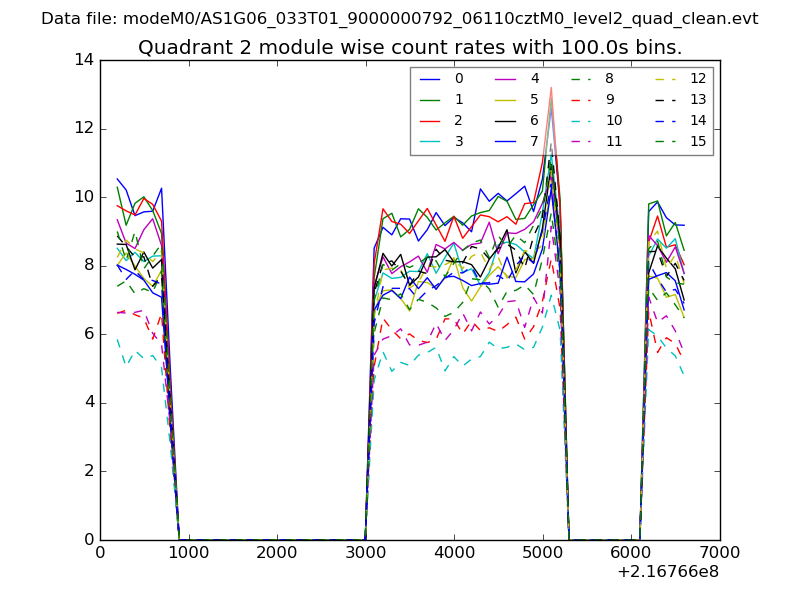
| Module-wise count rates for Quadrant B Data is divided into 100 sec bins |
 |
 |
| Module-wise count rates for Quadrant C Data is divided into 100 sec bins |
 |
 |
| Module-wise count rates for Quadrant D Data is divided into 100 sec bins |
 |
 |
| Parameter | Plot |
|---|---|
| CZT HV Monitor | 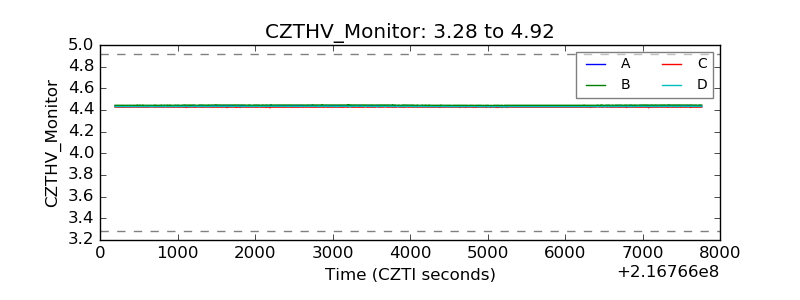 |
| D_VDD | 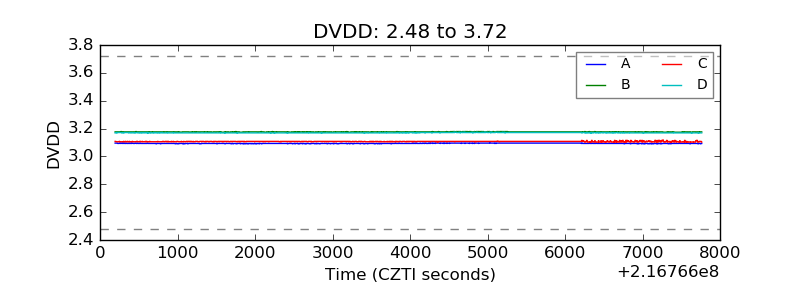 |
| Temperature 1 | 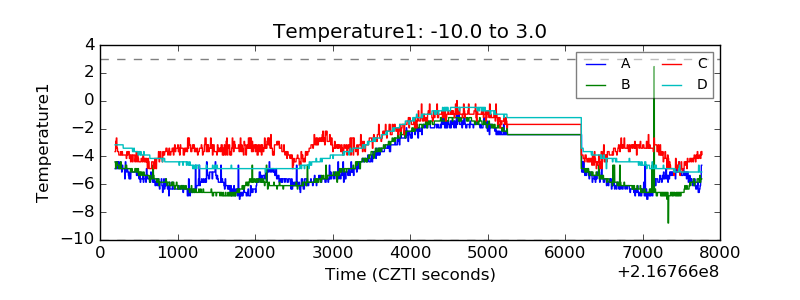 |
| Veto HV Monitor | 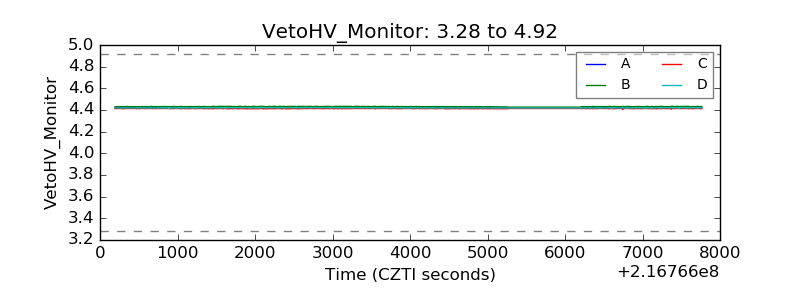 |
| Veto LLD | 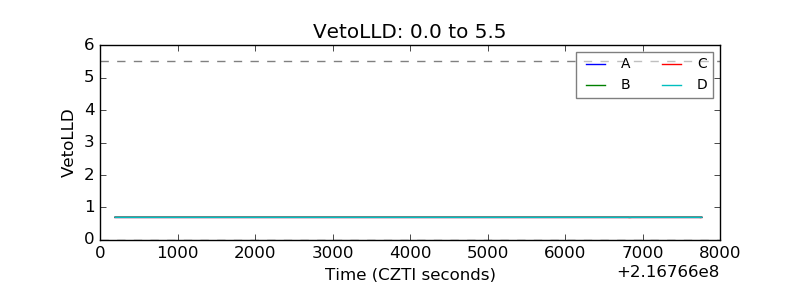 |
| Alpha Counter | 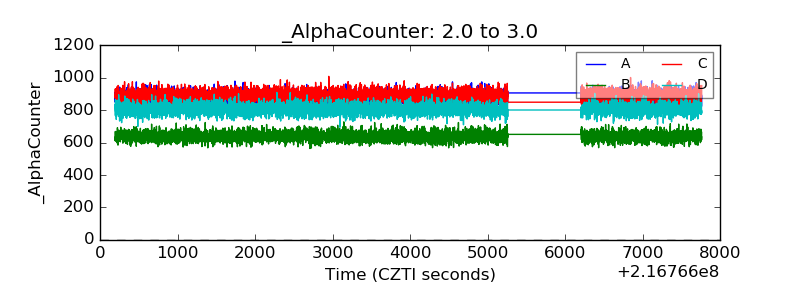 |
| _CPM_Rate | 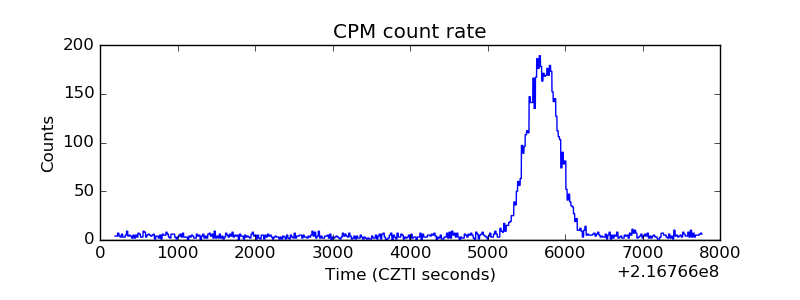 |
| CZT Counter | 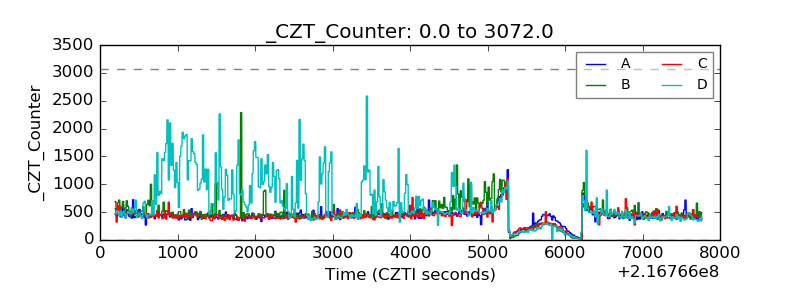 |
| +2.5 Volts monitor |  |
| +5 Volts monitor | 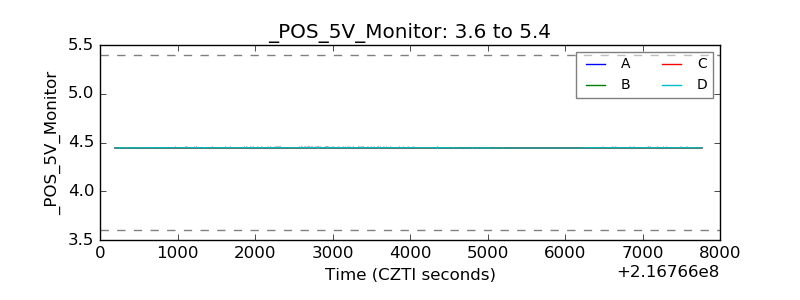 |
| _ROLL_ROT | 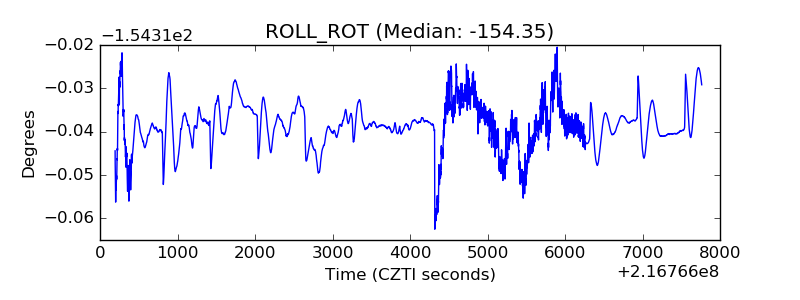 |
| _Roll_DEC | 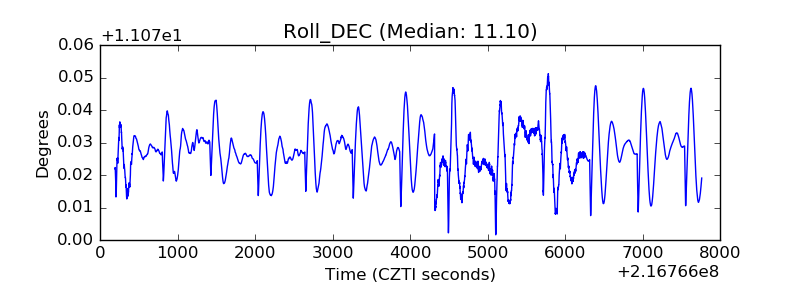 |
| _Roll_RA | 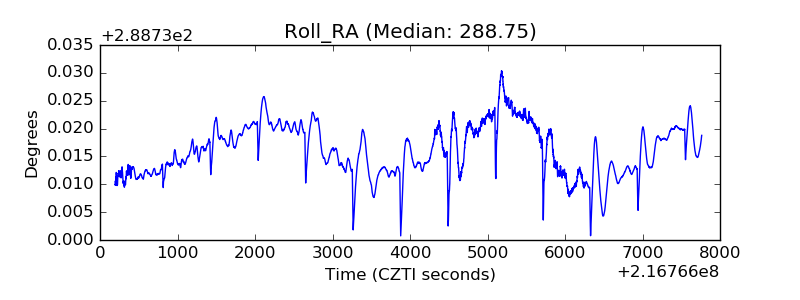 |
| Veto Counter | 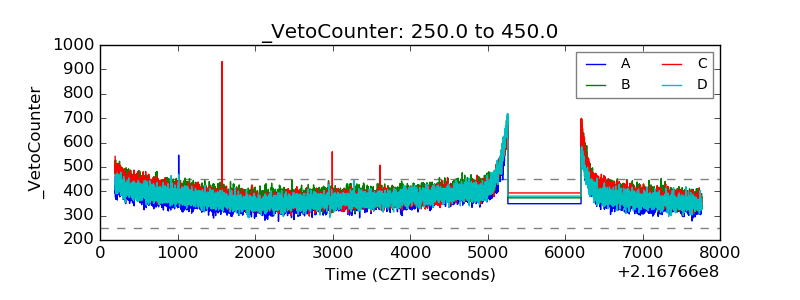 |