| Param | Original file | Final file |
|---|---|---|
| Filename | modeM0/AS1G06_033T01_9000000792_06119cztM0_level2.evt | modeM0/AS1G06_033T01_9000000792_06119cztM0_level2_quad_clean.evt |
| Size (bytes) | 189,766,080 | 20,430,720 |
| Size | 181.0 MB | 19.5 MB |
| Events in quadrant A | 1,359,624 | 100,420 |
| Events in quadrant B | 1,451,885 | 101,894 |
| Events in quadrant C | 1,372,708 | 100,606 |
| Events in quadrant D | 1,352,857 | 97,423 |
| Mode M0 | |||
|---|---|---|---|
| Quadrant | BADHDUFLAG | Total packets | Discarded packets |
| A | 0 | 6292 | 1 |
| B | 0 | 6411 | 1 |
| C | 0 | 6269 | 1 |
| D | 0 | 6400 | 1 |
| Mode SS | |||
|---|---|---|---|
| Quadrant | BADHDUFLAG | Total packets | Discarded packets |
| A | 0 | 62 | 0 |
| B | 0 | 62 | 0 |
| C | 0 | 62 | 0 |
| D | 0 | 62 | 0 |
| Mode M9 | |||
|---|---|---|---|
| Quadrant | BADHDUFLAG | Total packets | Discarded packets |
| A | 0 | 10 | 0 |
| B | 0 | 10 | 0 |
| C | 0 | 10 | 0 |
| D | 0 | 10 | 0 |
| Quadrant | Total seconds | Saturated seconds | Saturation percentage |
|---|---|---|---|
| A | 3058 | 35 | 1.144539% |
| B | 3058 | 44 | 1.438849% |
| C | 3058 | 34 | 1.111838% |
| D | 3058 | 43 | 1.406148% |
Noise dominated data is calculated using 1-second bins in cleaned event files. If a bin has >2000 counts, and if more than 50% of those come from <1% of pixels, then it is considered to be noise-dominated and hence unusable.
| Quadrant | # 1 sec bins | Bins with >0 counts | Bins with >2000 counts | High rate bins dominated by noise | Noise dominated (total time) | Noise dominated (detector-on time) | Marked lightcurve |
|---|---|---|---|---|---|---|---|
| A | 4003 | 3059 | 0 | 0 | 0.00% | 0.00% | 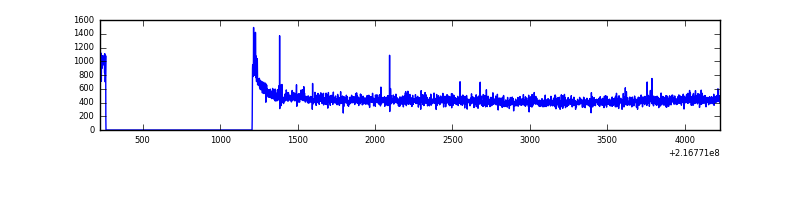 |
| B | 4003 | 3059 | 0 | 0 | 0.00% | 0.00% | 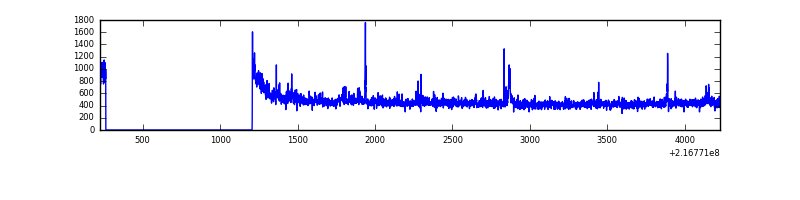 |
| C | 4003 | 3058 | 0 | 0 | 0.00% | 0.00% | 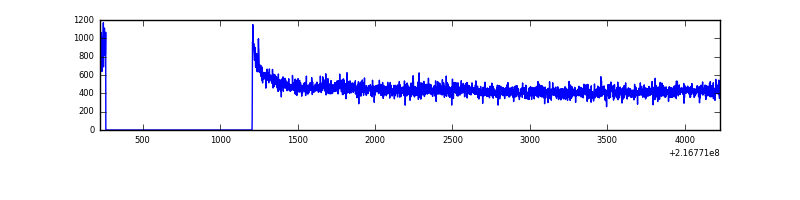 |
| D | 4003 | 3059 | 5 | 5 | 0.12% | 0.16% | 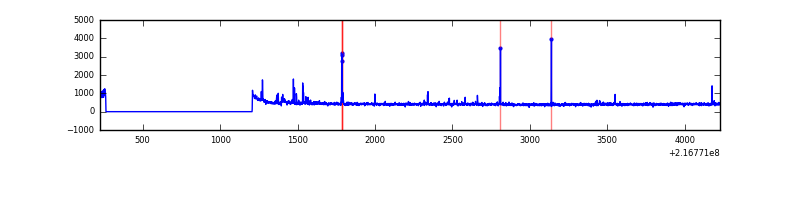 |
Top three noisy pixels from each quadrant. If the there are fewer than three noisy pixels in the level2.evt file, extra rows are filled as -1
| Pixel properties | Quadrant properties | ||||||
|---|---|---|---|---|---|---|---|
| Quadrant | DetID | PixID | Counts | Sigma | Mean | Median | Sigma |
| A | 8 | 15 | 18939 | 256.9 | 345 | 337 | 72.4 |
| A | 10 | 253 | 6128 | 79.97 | 345 | 337 | 72.4 |
| A | 10 | 17 | 3426 | 42.66 | 345 | 337 | 72.4 |
| B | 15 | 204 | 28633 | 403.03 | 354 | 346 | 70.2 |
| B | 4 | 172 | 18688 | 261.33 | 354 | 346 | 70.2 |
| B | 3 | 64 | 12060 | 166.9 | 354 | 346 | 70.2 |
| C | 1 | 16 | 20140 | 240.3 | 342 | 344 | 82.4 |
| C | 8 | 128 | 8814 | 102.82 | 342 | 344 | 82.4 |
| C | 8 | 112 | 3981 | 44.15 | 342 | 344 | 82.4 |
| D | 2 | 33 | 35330 | 416.22 | 337 | 328 | 84.1 |
| D | 2 | 206 | 14549 | 169.11 | 337 | 328 | 84.1 |
| D | 8 | 195 | 12514 | 144.91 | 337 | 328 | 84.1 |
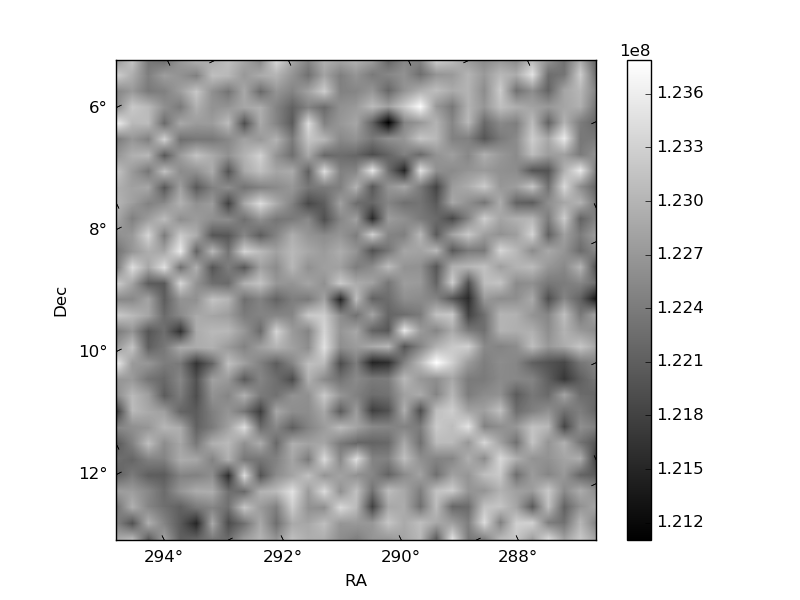
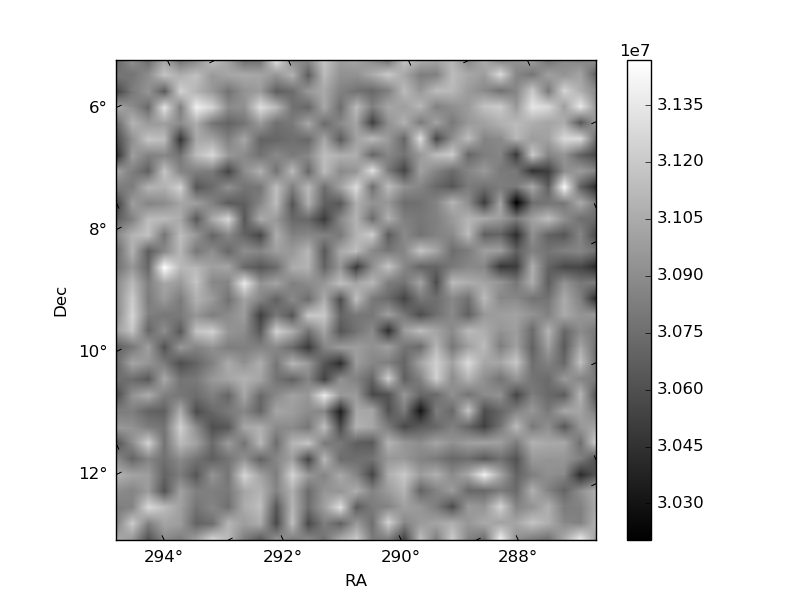
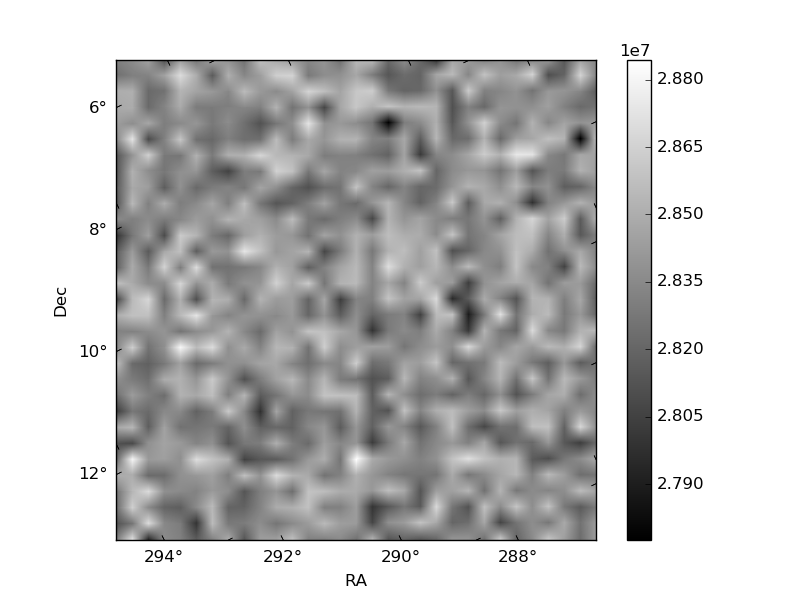
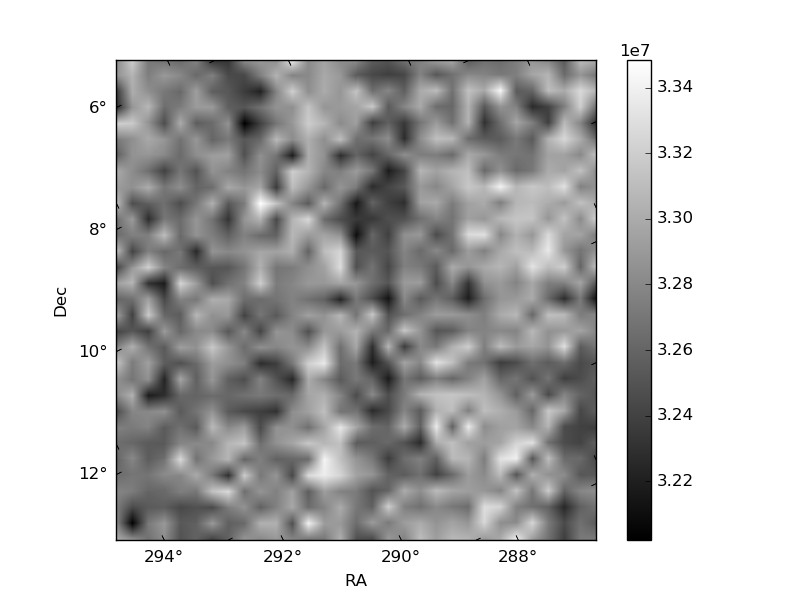
Histogram calculated using DETX and DETY for each event in the final _common_clean file
| Quadrant A | 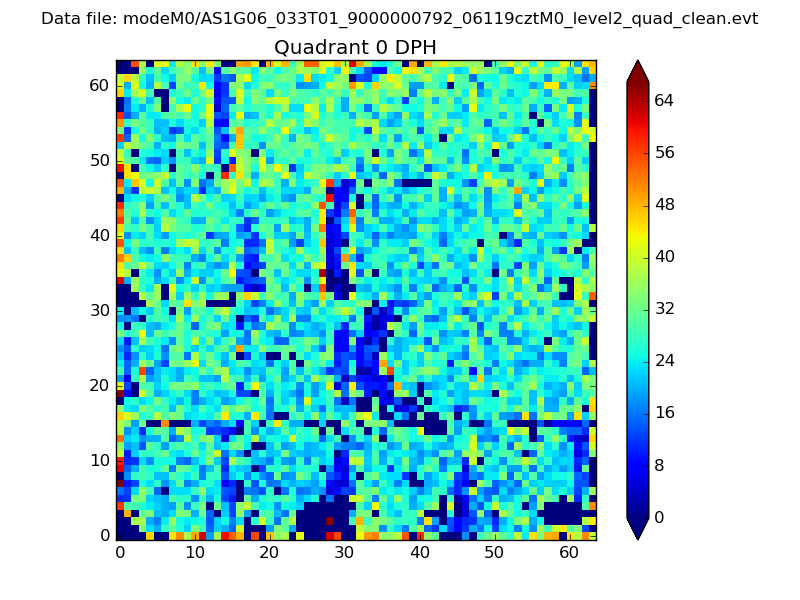 |
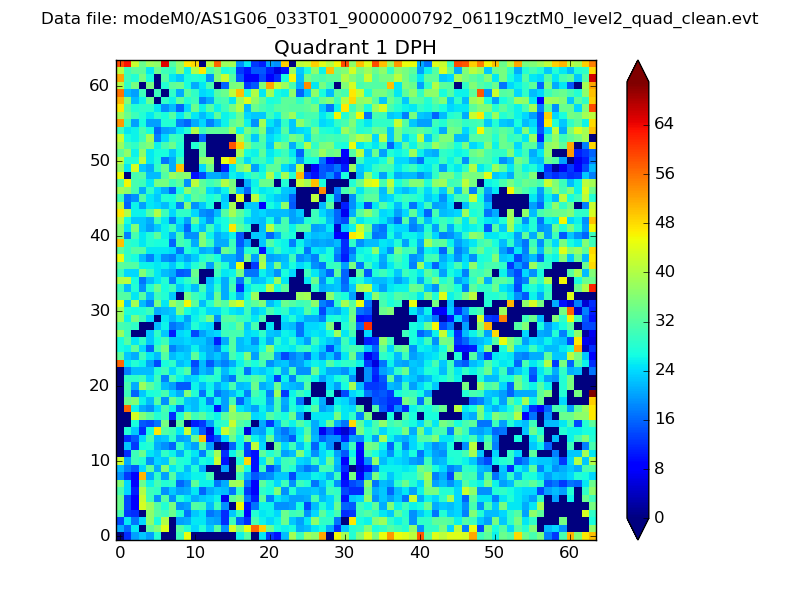 |
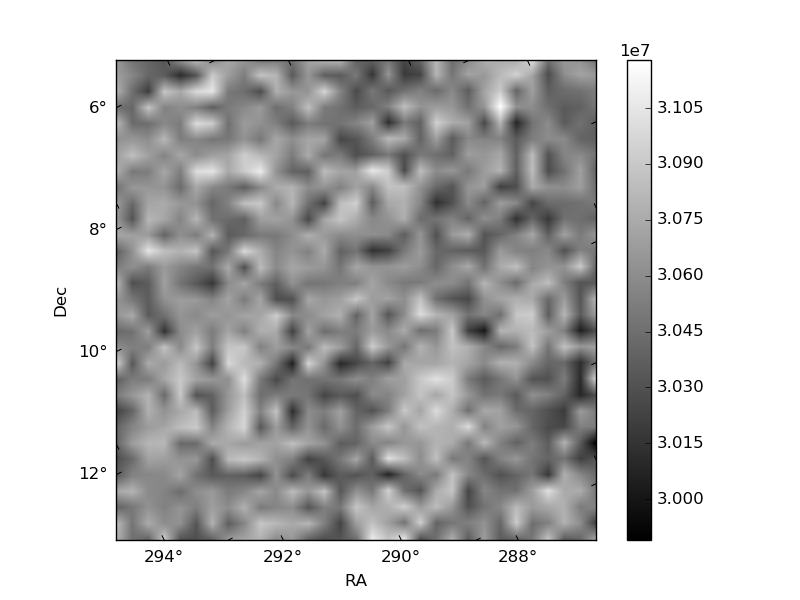
Quadrant B |
|---|---|---|---|
| Quadrant D | 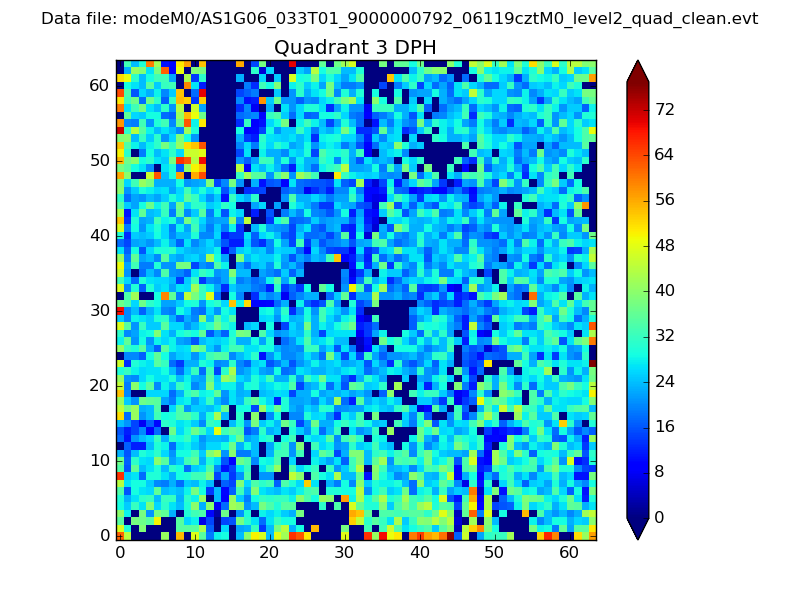 |
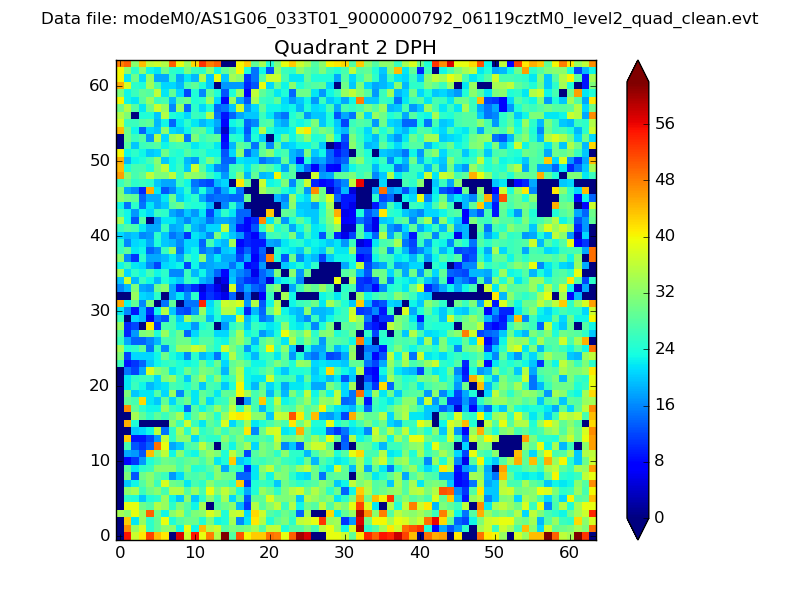 |
Quadrant C |
| Plot type | Count rate plots | Images |
|---|---|---|
| Comparison with Poisson distribution Blue bars denote a histogram of data divided into 1 sec bins. Red curve is a Poisson curve with rate = median count rate of data. |
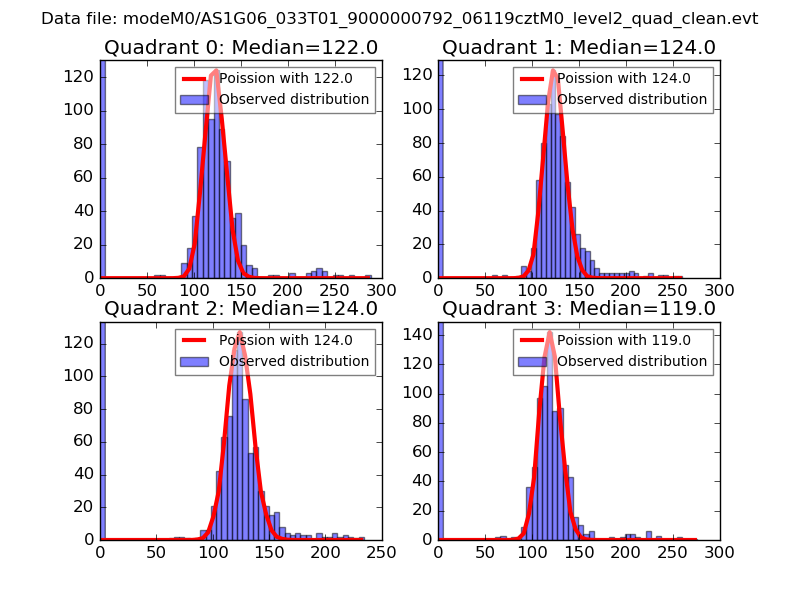 |
 |
| Quadrant-wise count rates Data is divided into 100 sec bins |
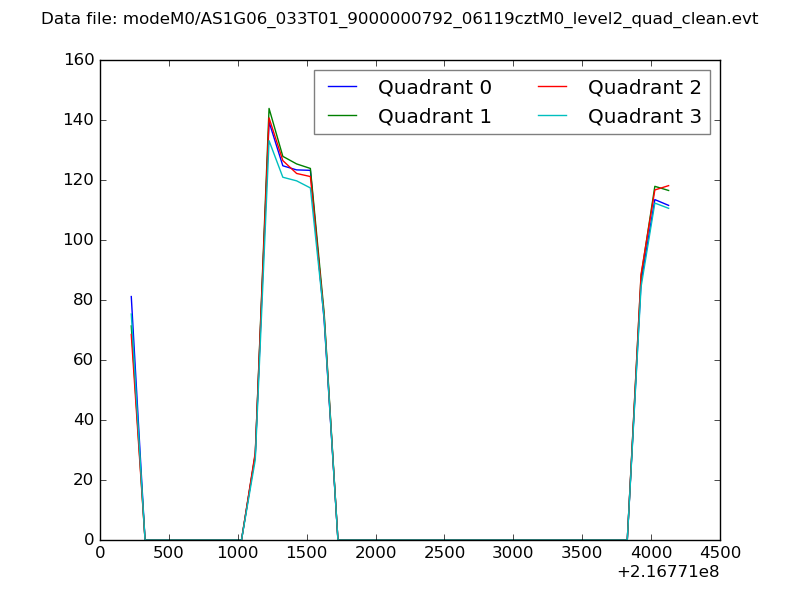 |
|
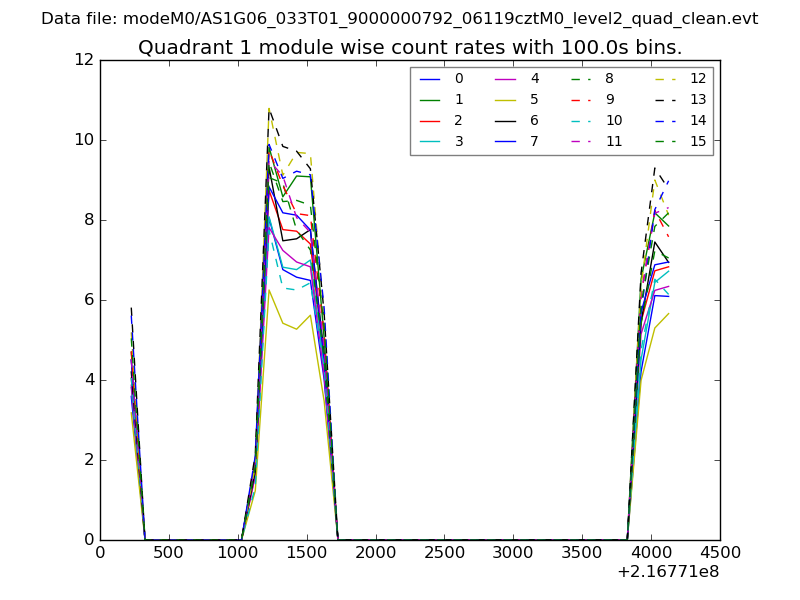
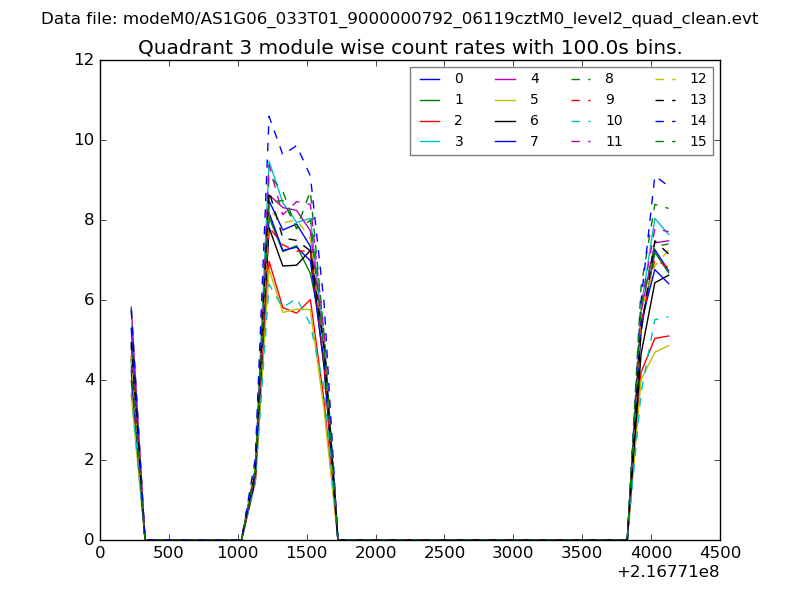
| Module-wise count rates for Quadrant A Data is divided into 100 sec bins |
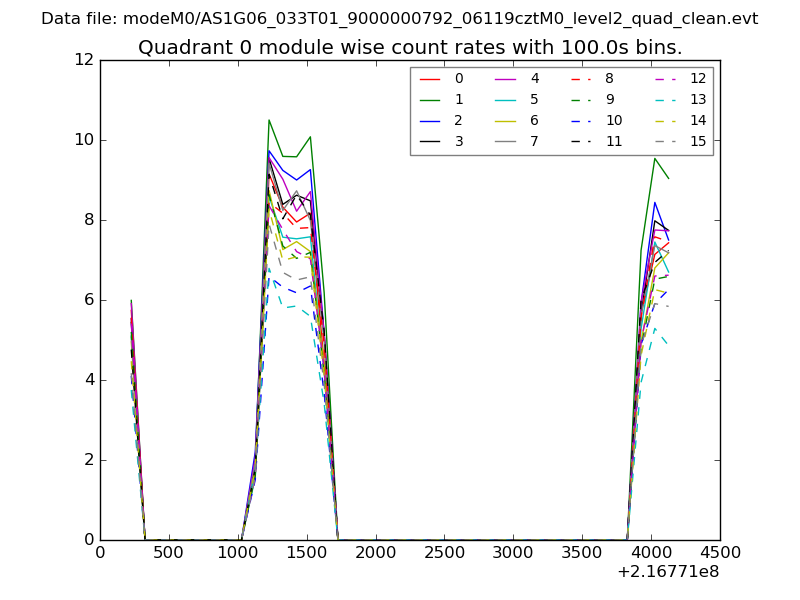 |
 |
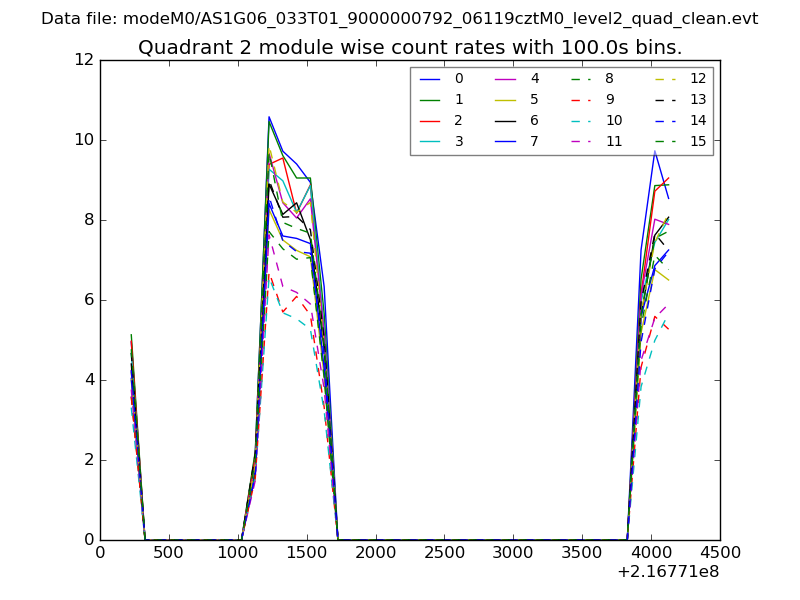
| Module-wise count rates for Quadrant B Data is divided into 100 sec bins |
 |
 |
| Module-wise count rates for Quadrant C Data is divided into 100 sec bins |
 |
 |
| Module-wise count rates for Quadrant D Data is divided into 100 sec bins |
 |
 |
| Parameter | Plot |
|---|---|
| CZT HV Monitor | 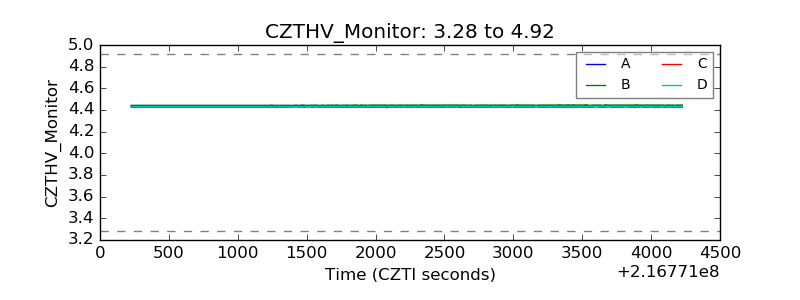 |
| D_VDD | 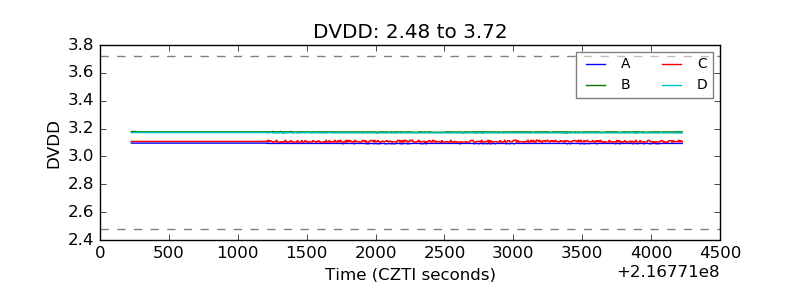 |
| Temperature 1 | 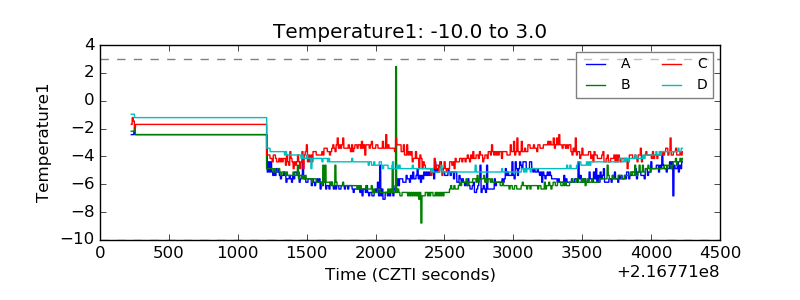 |
| Veto HV Monitor | 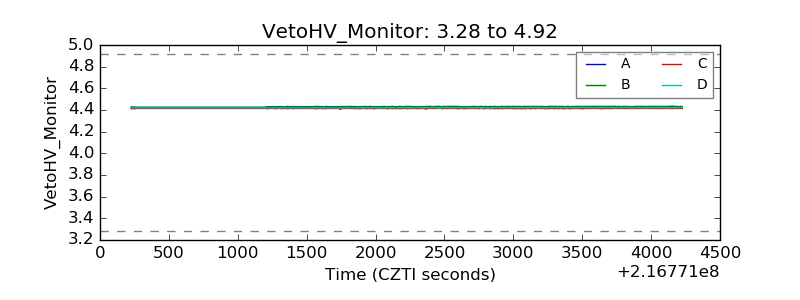 |
| Veto LLD |  |
| Alpha Counter | 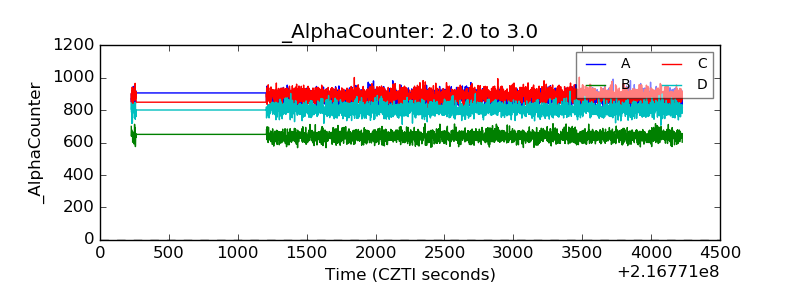 |
| _CPM_Rate | 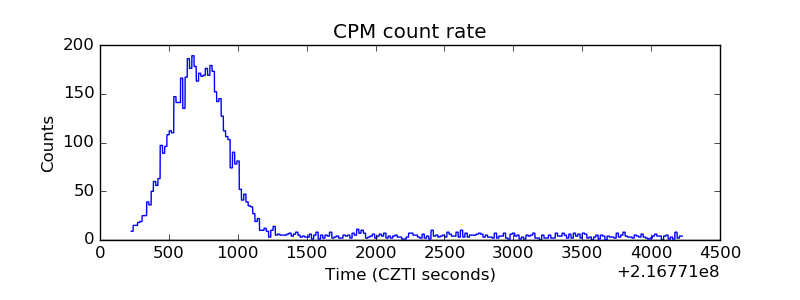 |
| CZT Counter | 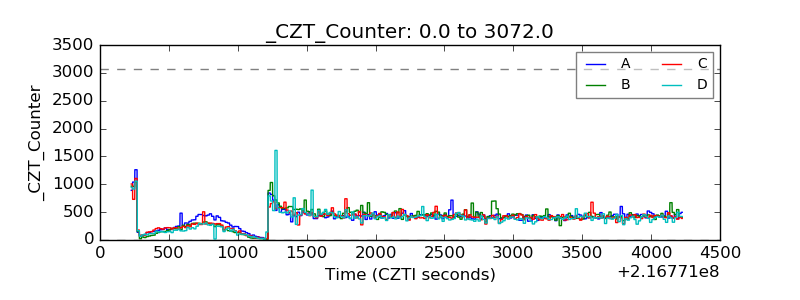 |
| +2.5 Volts monitor |  |
| +5 Volts monitor |  |
| _ROLL_ROT | 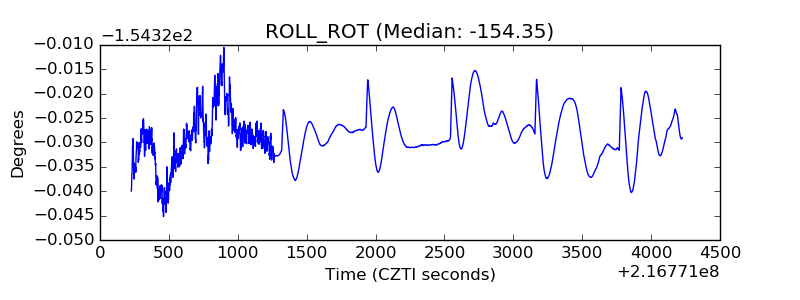 |
| _Roll_DEC | 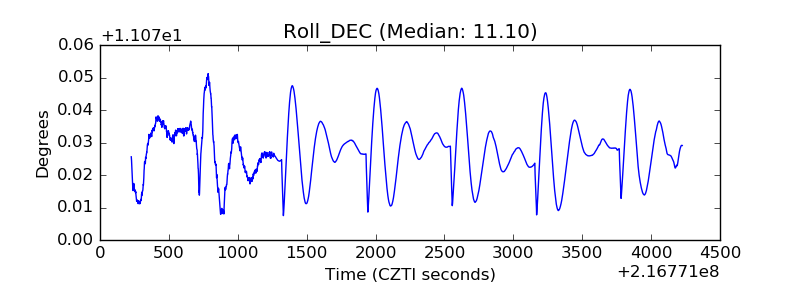 |
| _Roll_RA | 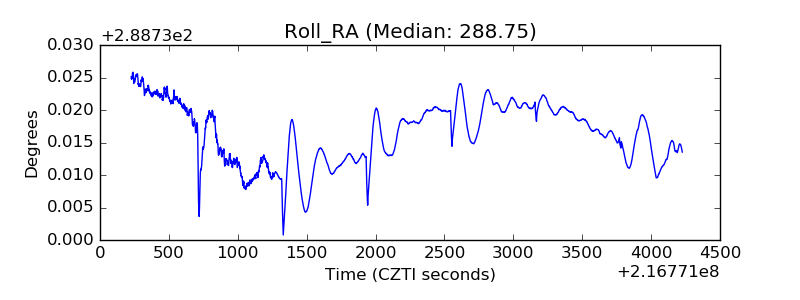 |
| Veto Counter | 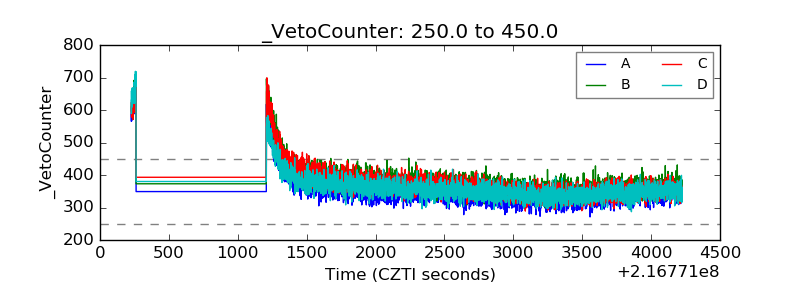 |