| Param | Original file | Final file |
|---|---|---|
| Filename | modeM0/AS1G06_168T02_9000000790cztM0_level2.fits | modeM0/AS1G06_168T02_9000000790cztM0_level2_quad_clean.evt |
| Size (bytes) | 73,638,720 | 81,521,280 |
| Size | 70.2 MB | 77.7 MB |
| Events in quadrant A | 446,382 | 500,615 |
| Events in quadrant B | 424,160 | 501,347 |
| Events in quadrant C | 436,592 | 479,247 |
| Events in quadrant D | 374,172 | 438,141 |
| Mode M0 | |||
|---|---|---|---|
| Quadrant | BADHDUFLAG | Total packets | Discarded packets |
| A | 0 | 17228 | 0 |
| B | 0 | 18874 | 0 |
| C | 0 | 16206 | 0 |
| D | 0 | 20391 | 0 |
| Mode M9 | |||
|---|---|---|---|
| Quadrant | BADHDUFLAG | Total packets | Discarded packets |
| A | 0 | 19 | 0 |
| B | 0 | 19 | 0 |
| C | 0 | 19 | 0 |
| D | 0 | 19 | 0 |
| Mode SS | |||
|---|---|---|---|
| Quadrant | BADHDUFLAG | Total packets | Discarded packets |
| A | 0 | 158 | 0 |
| B | 0 | 158 | 0 |
| C | 0 | 158 | 0 |
| D | 0 | 158 | 0 |
| Quadrant | Total seconds | Saturated seconds | Saturation percentage |
|---|---|---|---|
| A | 7901 | 70 | 0.885964% |
| B | 7902 | 332 | 4.201468% |
| C | 7902 | 42 | 0.531511% |
| D | 7901 | 309 | 3.910897% |
Noise dominated data is calculated using 1-second bins in cleaned event files. If a bin has >2000 counts, and if more than 50% of those come from <1% of pixels, then it is considered to be noise-dominated and hence unusable.
| Quadrant | # 1 sec bins | Bins with >0 counts | Bins with >2000 counts | High rate bins dominated by noise | Noise dominated (total time) | Noise dominated (detector-on time) | Marked lightcurve |
|---|---|---|---|---|---|---|---|
| A | 8981 | 7900 | 0 | 0 | 0.00% | 0.00% |  |
| B | 8981 | 7897 | 0 | 0 | 0.00% | 0.00% | 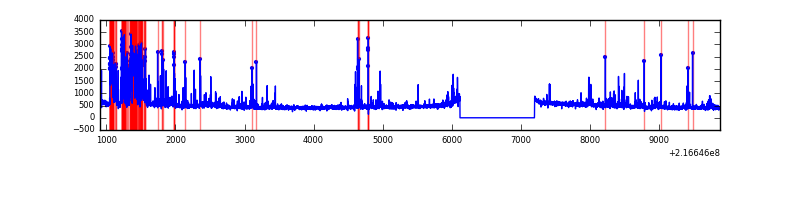 |
| C | 8981 | 7901 | 0 | 0 | 0.00% | 0.00% | 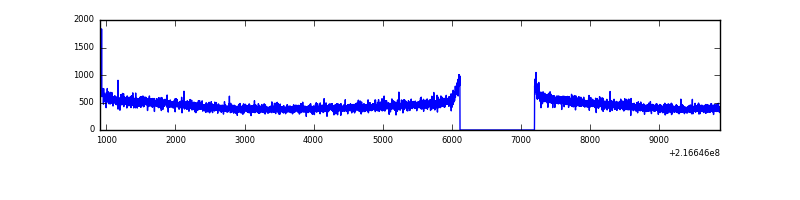 |
| D | 8981 | 7900 | 0 | 0 | 0.00% | 0.00% |  |
Top three noisy pixels from each quadrant. If the there are fewer than three noisy pixels in the level2.evt file, extra rows are filled as -1
| Pixel properties | Quadrant properties | ||||||
|---|---|---|---|---|---|---|---|
| Quadrant | DetID | PixID | Counts | Sigma | Mean | Median | Sigma |
| A | 0 | 29 | 444 | 10.59 | 116 | 108 | 31.7 |
| A | 7 | 110 | 379 | 8.54 | 116 | 108 | 31.7 |
| A | 9 | 19 | 356 | 7.82 | 116 | 108 | 31.7 |
| B | 2 | 9 | 385 | 10.94 | 112 | 106 | 25.5 |
| B | 12 | 226 | 318 | 8.32 | 112 | 106 | 25.5 |
| B | 5 | 128 | 288 | 7.14 | 112 | 106 | 25.5 |
| C | 1 | 81 | 340 | 7.2 | 115 | 107 | 32.4 |
| C | 2 | 191 | 324 | 6.7 | 115 | 107 | 32.4 |
| C | 1 | 80 | 323 | 6.67 | 115 | 107 | 32.4 |
| D | 3 | 14 | 312 | 7.17 | 106 | 97 | 30.0 |
| D | 7 | 3 | 304 | 6.9 | 106 | 97 | 30.0 |
| D | 3 | 31 | 284 | 6.23 | 106 | 97 | 30.0 |
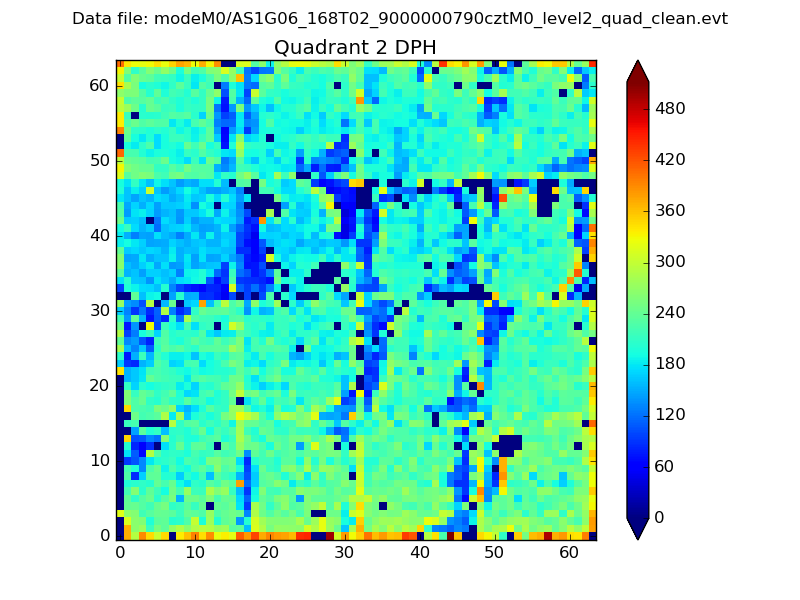
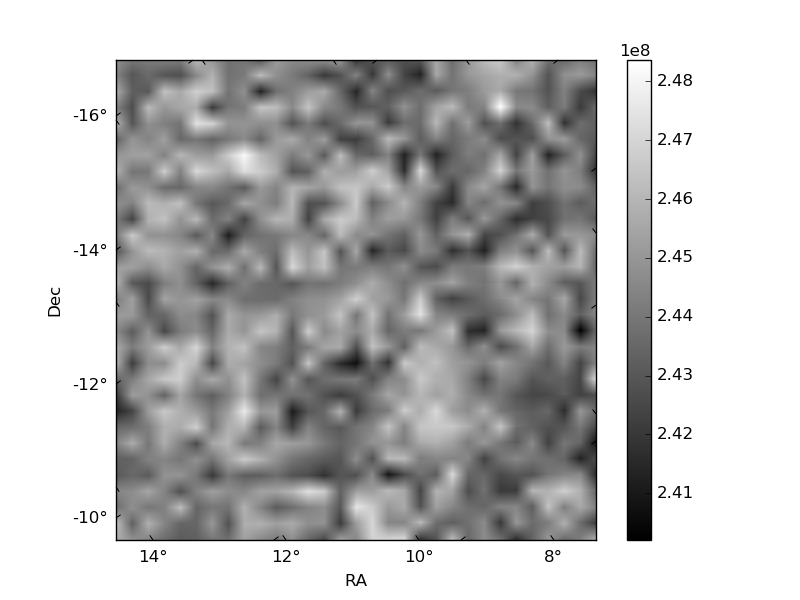
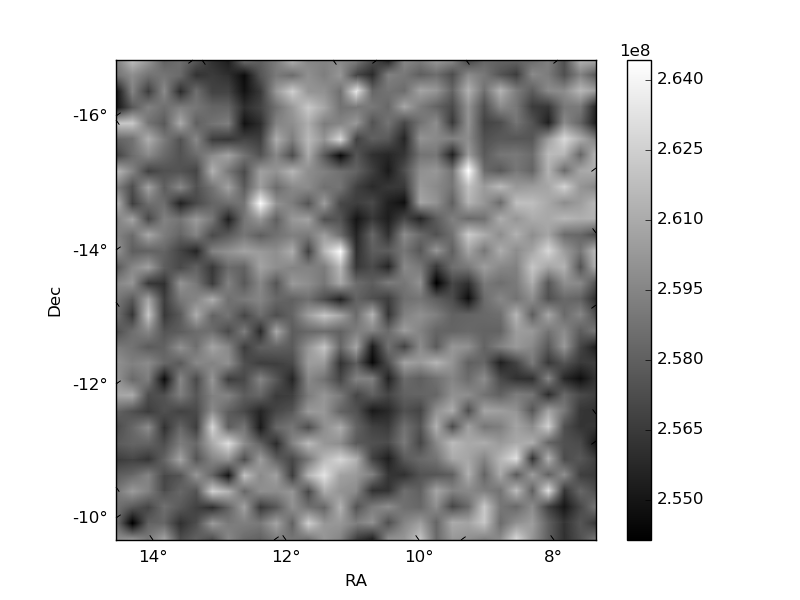
Histogram calculated using DETX and DETY for each event in the final _common_clean file
| Quadrant A | 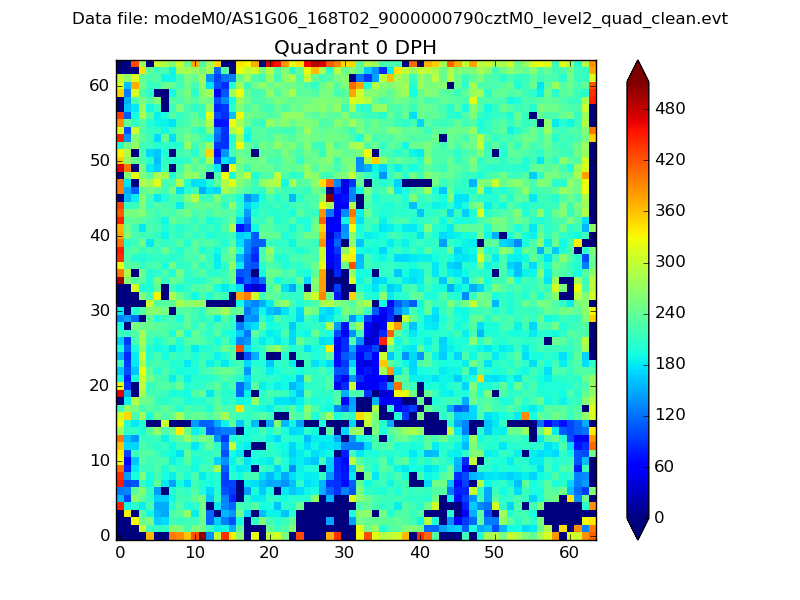 |
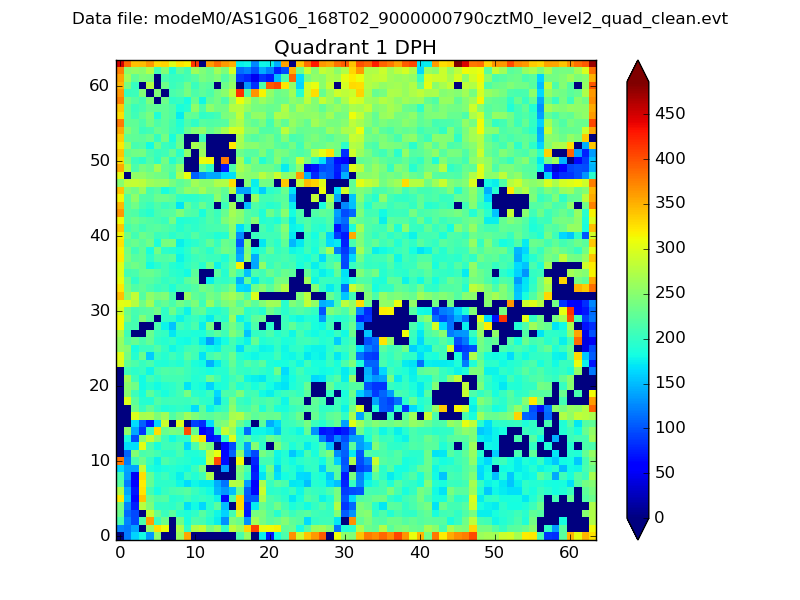 |
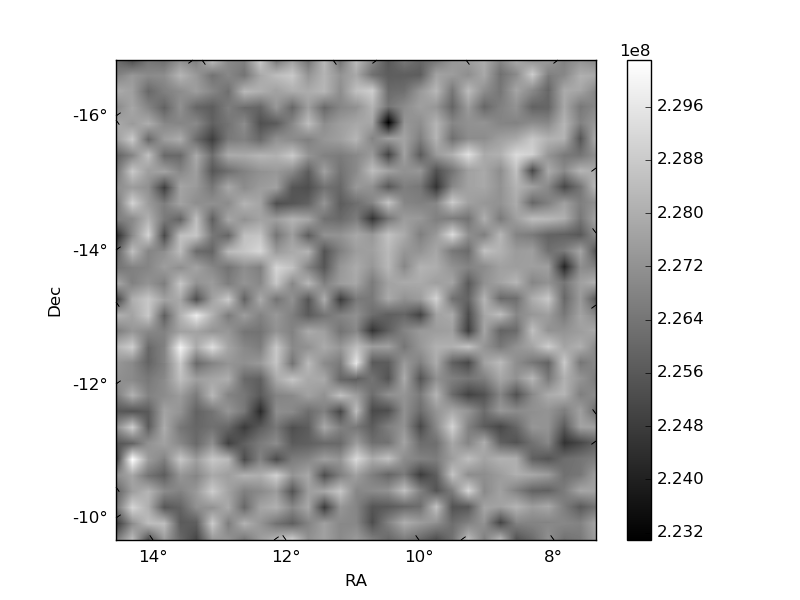
Quadrant B |
|---|---|---|---|
| Quadrant D | 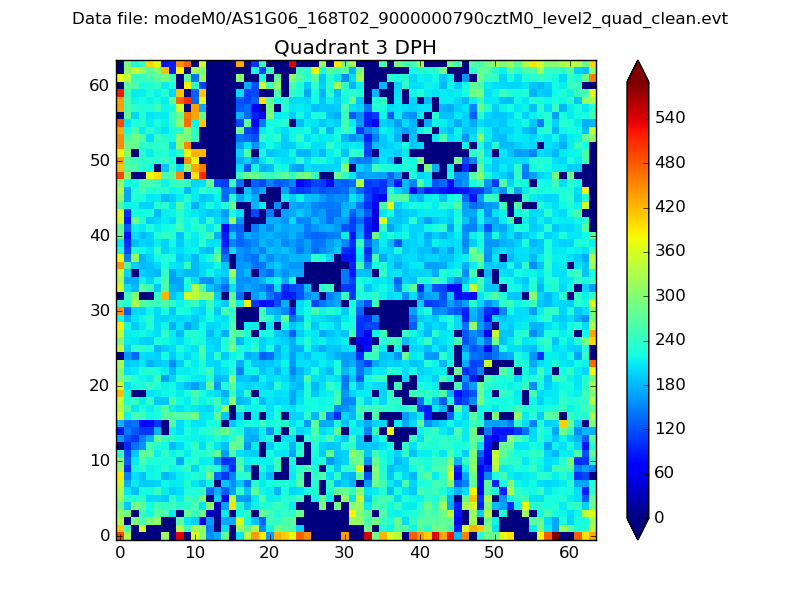 |
 |
Quadrant C |
| Plot type | Count rate plots | Images |
|---|---|---|
| Comparison with Poisson distribution Blue bars denote a histogram of data divided into 1 sec bins. Red curve is a Poisson curve with rate = median count rate of data. |
 |
 |
| Quadrant-wise count rates Data is divided into 100 sec bins |
 |
|
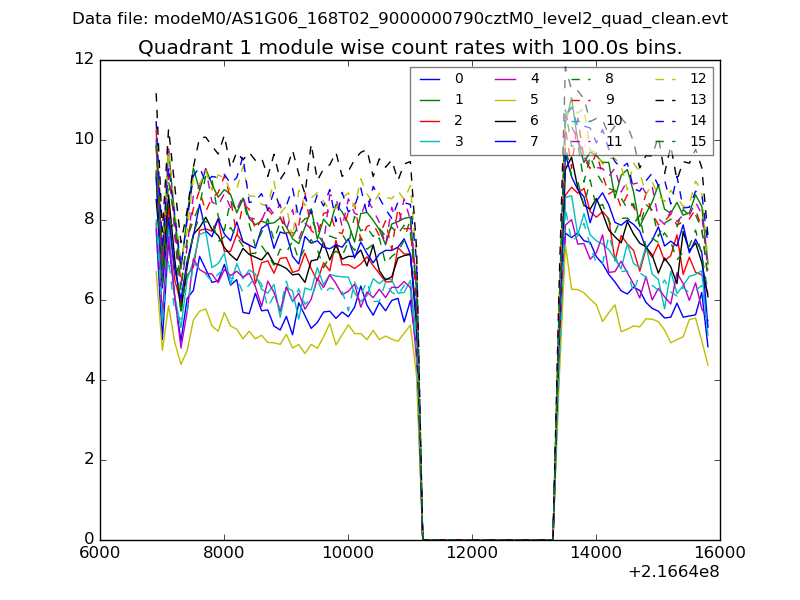
| Module-wise count rates for Quadrant A Data is divided into 100 sec bins |
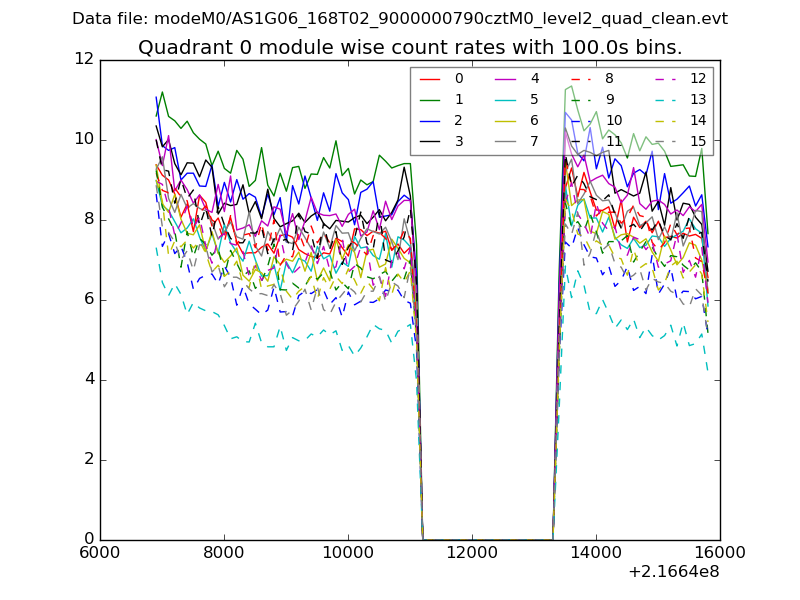 |
 |
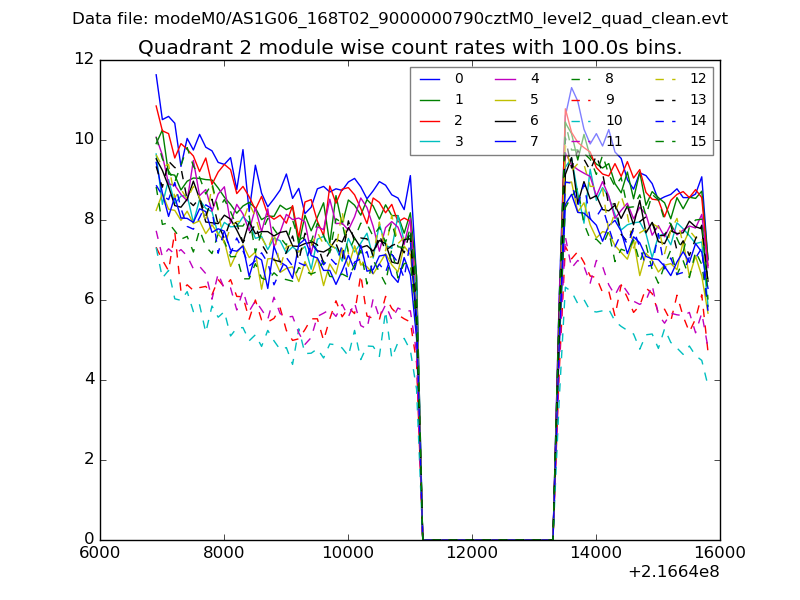
| Module-wise count rates for Quadrant B Data is divided into 100 sec bins |
 |
 |
| Module-wise count rates for Quadrant C Data is divided into 100 sec bins |
 |
 |
| Module-wise count rates for Quadrant D Data is divided into 100 sec bins |
 |
 |
| Parameter | Plot |
|---|---|
| CZT HV Monitor |  |
| D_VDD | 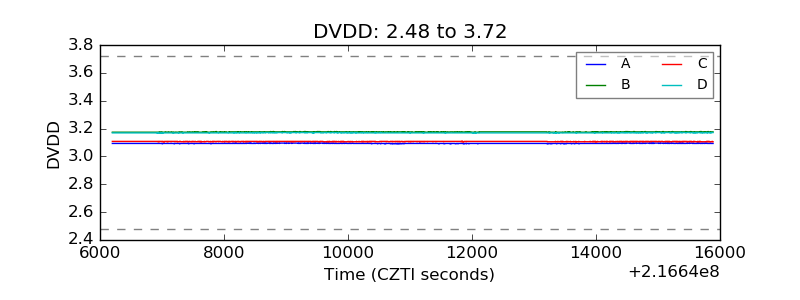 |
| Temperature 1 |  |
| Veto HV Monitor | 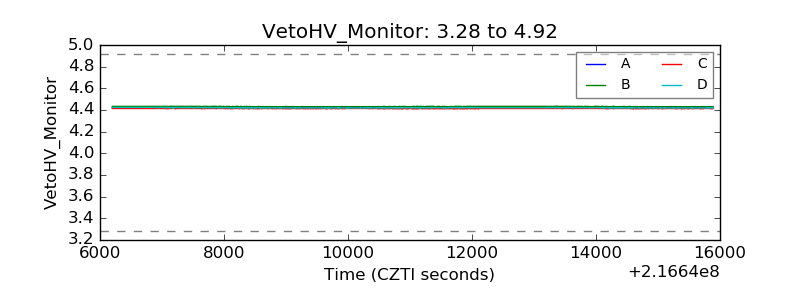 |
| Veto LLD | 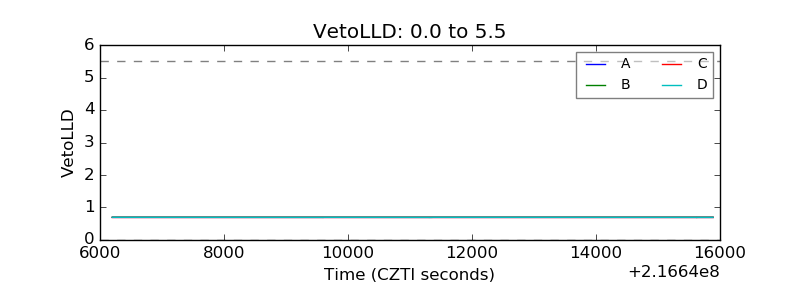 |
| Alpha Counter | 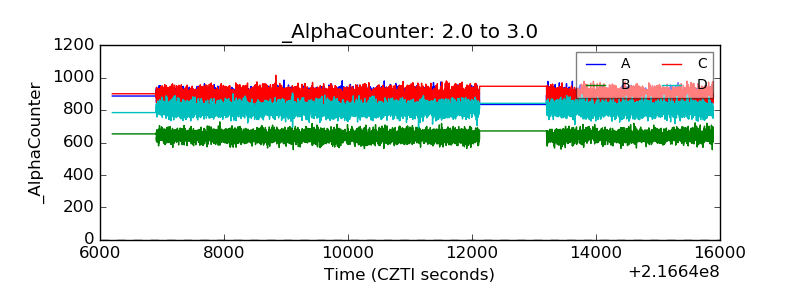 |
| _CPM_Rate | 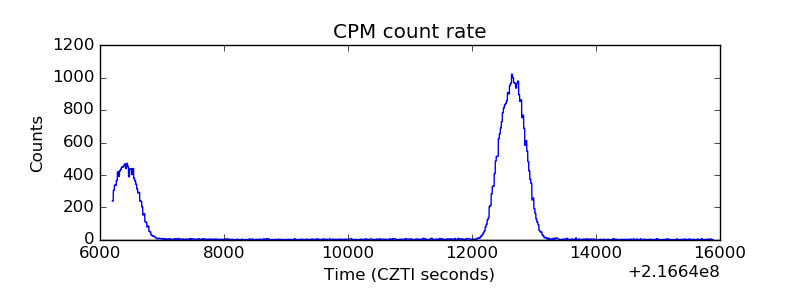 |
| CZT Counter |  |
| +2.5 Volts monitor |  |
| +5 Volts monitor | 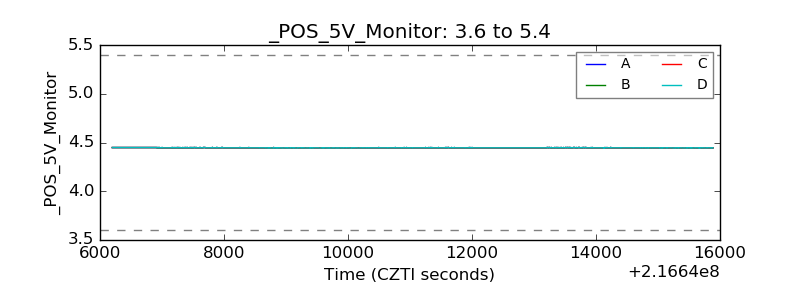 |
| _ROLL_ROT | 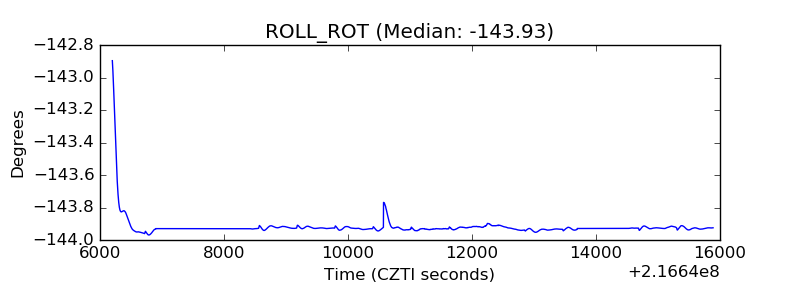 |
| _Roll_DEC | 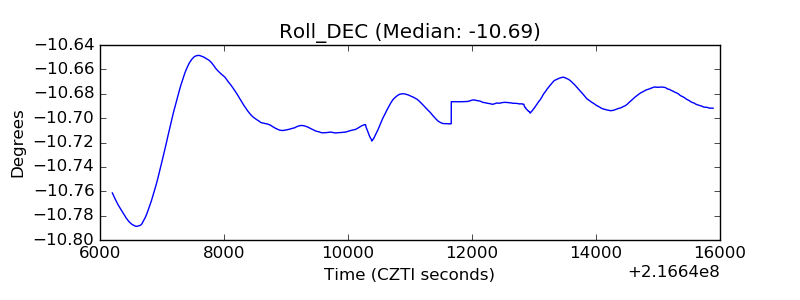 |
| _Roll_RA |  |
| Veto Counter |  |