| Param | Original file | Final file |
|---|---|---|
| Filename | modeM0/AS1G06_168T02_9000000790_06088cztM0_level2.evt | modeM0/AS1G06_168T02_9000000790_06088cztM0_level2_quad_clean.evt |
| Size (bytes) | 153,910,080 | 16,436,160 |
| Size | 146.8 MB | 15.7 MB |
| Events in quadrant A | 807,639 | 97,489 |
| Events in quadrant B | 1,365,874 | 100,431 |
| Events in quadrant C | 755,823 | 99,951 |
| Events in quadrant D | 1,627,494 | 88,020 |
| Mode M0 | |||
|---|---|---|---|
| Quadrant | BADHDUFLAG | Total packets | Discarded packets |
| A | 0 | 3266 | 4 |
| B | 0 | 5041 | 1 |
| C | 0 | 3123 | 1 |
| D | 0 | 5891 | 5 |
| Mode M9 | |||
|---|---|---|---|
| Quadrant | BADHDUFLAG | Total packets | Discarded packets |
| A | 0 | 8 | 0 |
| B | 0 | 8 | 0 |
| C | 0 | 8 | 0 |
| D | 0 | 8 | 0 |
| Mode SS | |||
|---|---|---|---|
| Quadrant | BADHDUFLAG | Total packets | Discarded packets |
| A | 0 | 30 | 0 |
| B | 0 | 30 | 0 |
| C | 0 | 30 | 0 |
| D | 0 | 30 | 0 |
| Quadrant | Total seconds | Saturated seconds | Saturation percentage |
|---|---|---|---|
| A | 1499 | 6 | 0.400267% |
| B | 1500 | 258 | 17.200000% |
| C | 1500 | 7 | 0.466667% |
| D | 1499 | 231 | 15.410274% |
Noise dominated data is calculated using 1-second bins in cleaned event files. If a bin has >2000 counts, and if more than 50% of those come from <1% of pixels, then it is considered to be noise-dominated and hence unusable.
| Quadrant | # 1 sec bins | Bins with >0 counts | Bins with >2000 counts | High rate bins dominated by noise | Noise dominated (total time) | Noise dominated (detector-on time) | Marked lightcurve |
|---|---|---|---|---|---|---|---|
| A | 1500 | 1500 | 0 | 0 | 0.00% | 0.00% | 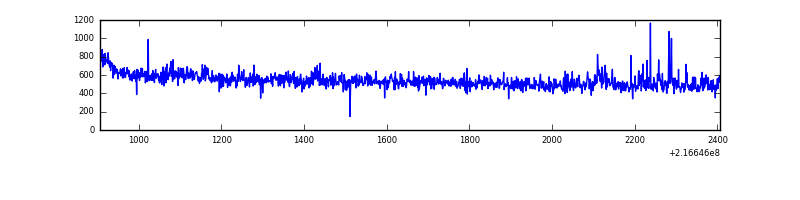 |
| B | 1500 | 1500 | 152 | 152 | 10.13% | 10.13% | 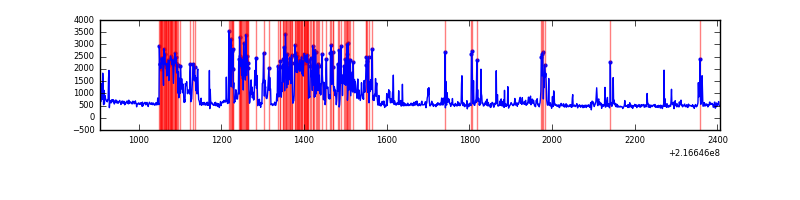 |
| C | 1500 | 1500 | 0 | 0 | 0.00% | 0.00% | 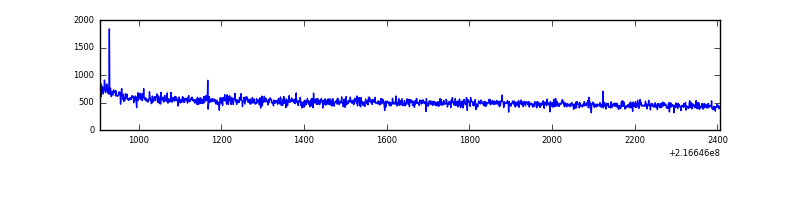 |
| D | 1500 | 1500 | 153 | 153 | 10.20% | 10.20% | 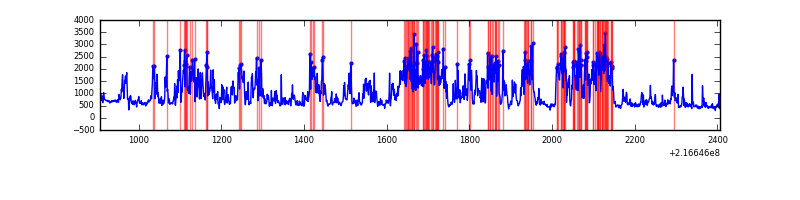 |
Top three noisy pixels from each quadrant. If the there are fewer than three noisy pixels in the level2.evt file, extra rows are filled as -1
| Pixel properties | Quadrant properties | ||||||
|---|---|---|---|---|---|---|---|
| Quadrant | DetID | PixID | Counts | Sigma | Mean | Median | Sigma |
| A | 8 | 15 | 40924 | 943.81 | 199 | 195 | 43.2 |
| A | 0 | 226 | 1954 | 40.76 | 199 | 195 | 43.2 |
| A | 12 | 194 | 1868 | 38.77 | 199 | 195 | 43.2 |
| B | 3 | 64 | 627493 | 16453.72 | 186 | 181 | 38.1 |
| B | 0 | 219 | 8014 | 205.45 | 186 | 181 | 38.1 |
| B | 4 | 81 | 5519 | 140.01 | 186 | 181 | 38.1 |
| C | 1 | 16 | 5244 | 108.49 | 191 | 192 | 46.6 |
| C | 9 | 16 | 2758 | 55.1 | 191 | 192 | 46.6 |
| C | 13 | 61 | 1480 | 27.66 | 191 | 192 | 46.6 |
| D | 11 | 241 | 902511 | 19027.52 | 187 | 180 | 47.4 |
| D | 5 | 190 | 6573 | 134.81 | 187 | 180 | 47.4 |
| D | 2 | 206 | 4033 | 81.25 | 187 | 180 | 47.4 |
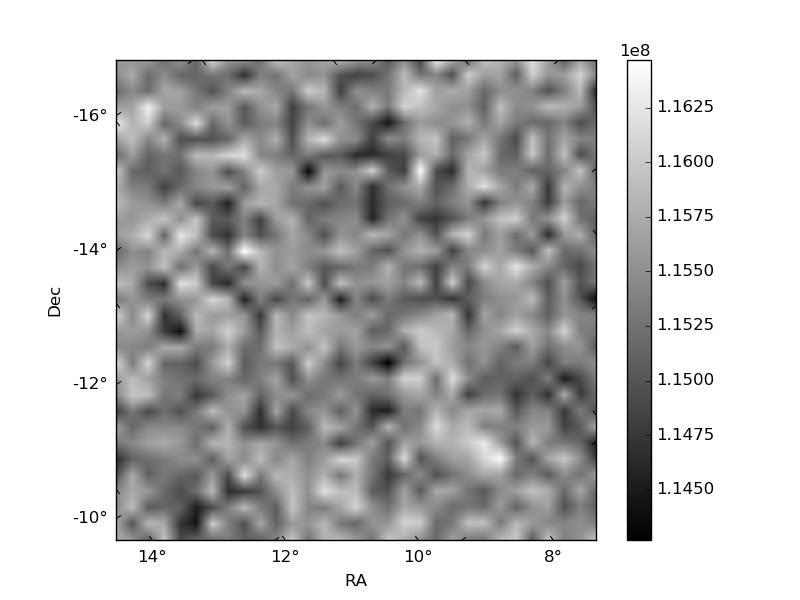
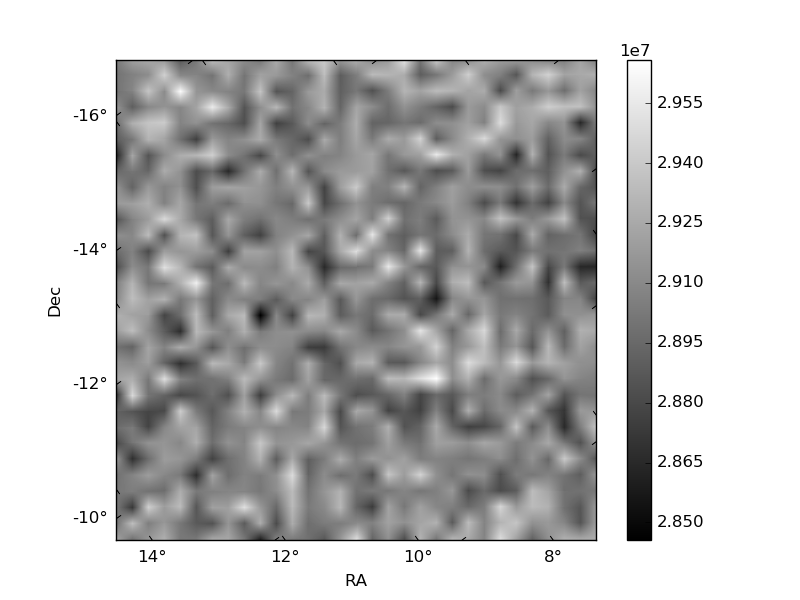
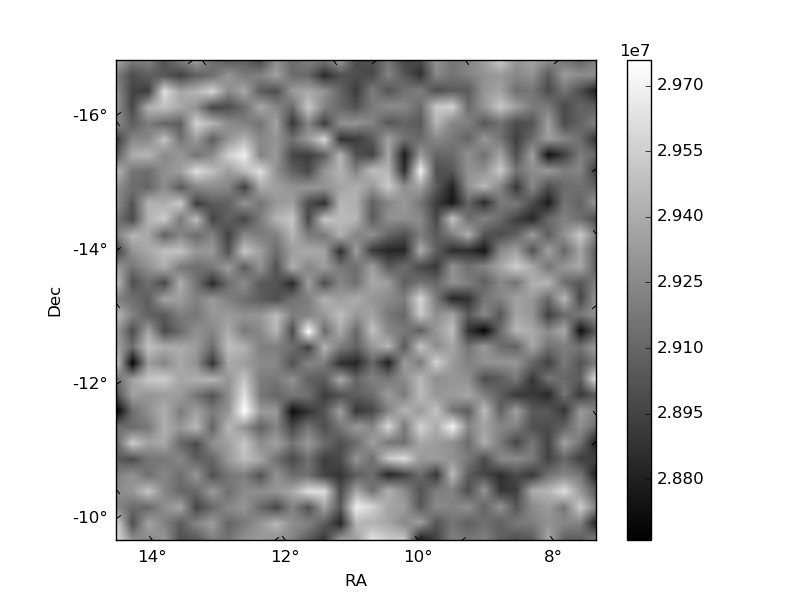
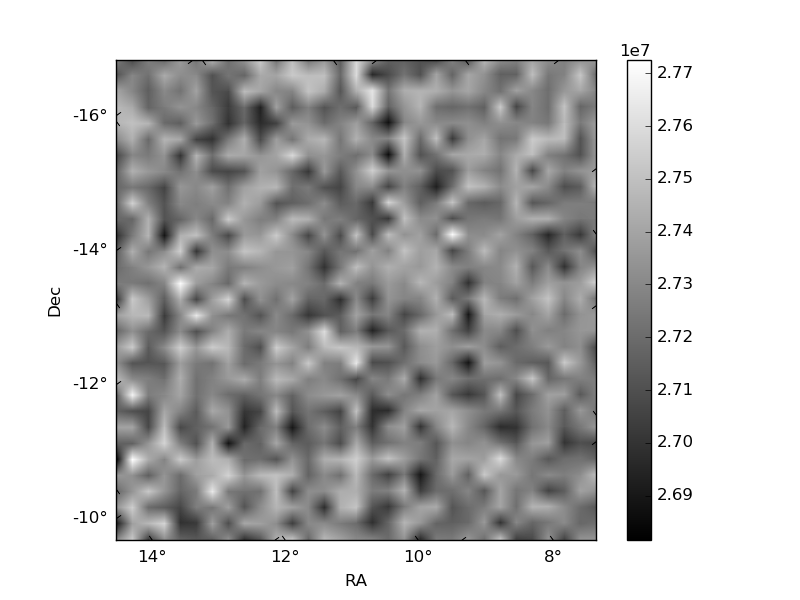
Histogram calculated using DETX and DETY for each event in the final _common_clean file
| Quadrant A | 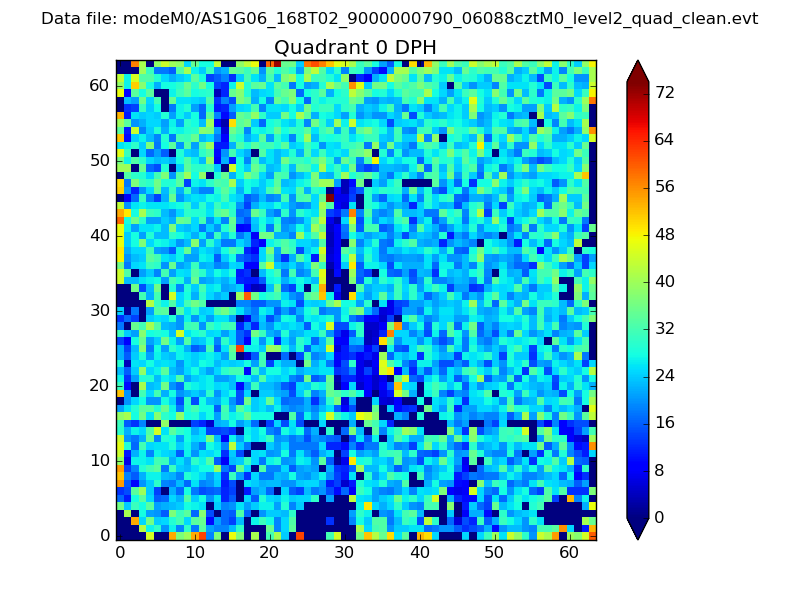 |
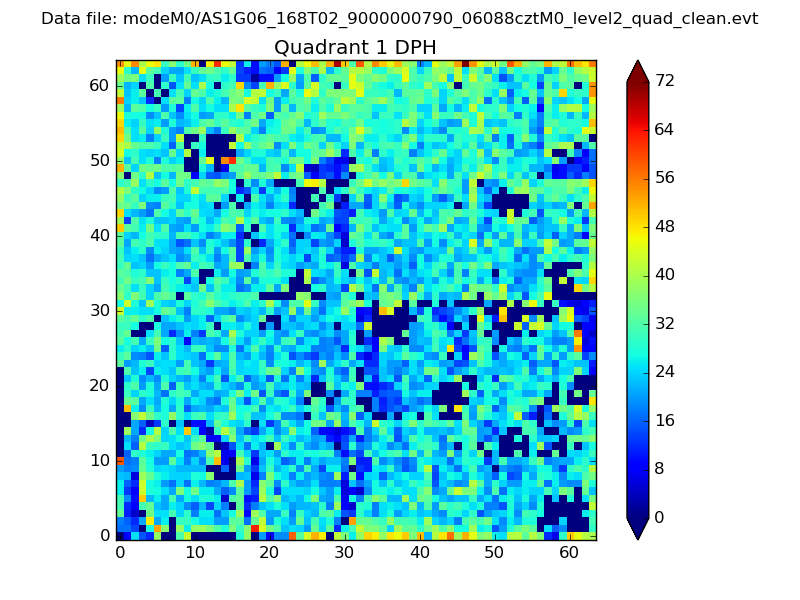 |
Quadrant B |
|---|---|---|---|
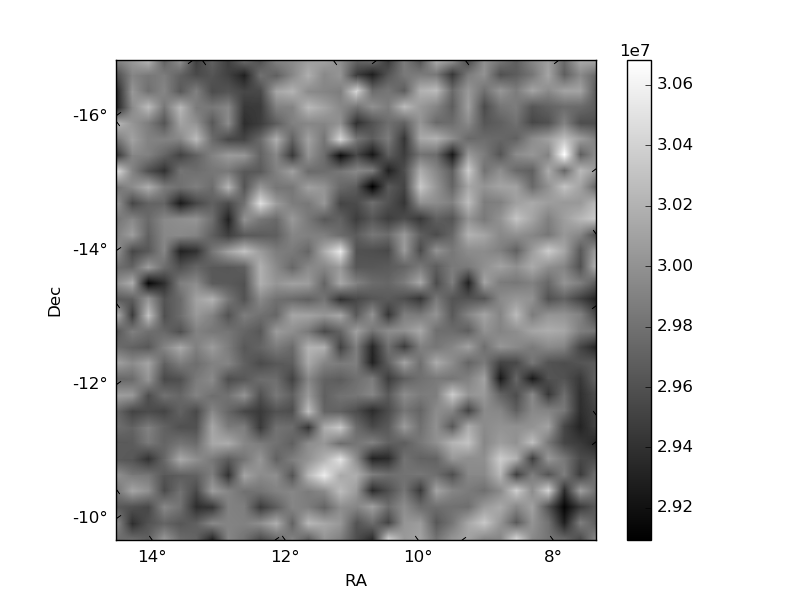
| Quadrant D | 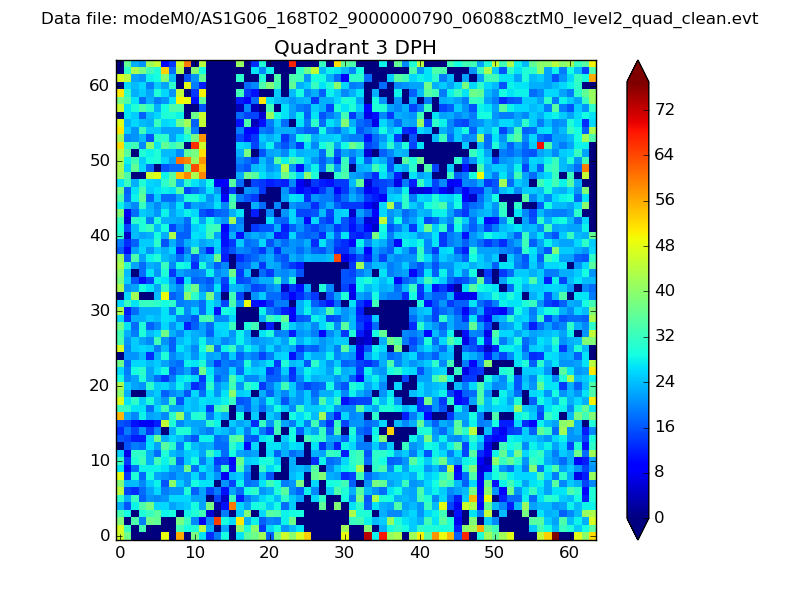 |
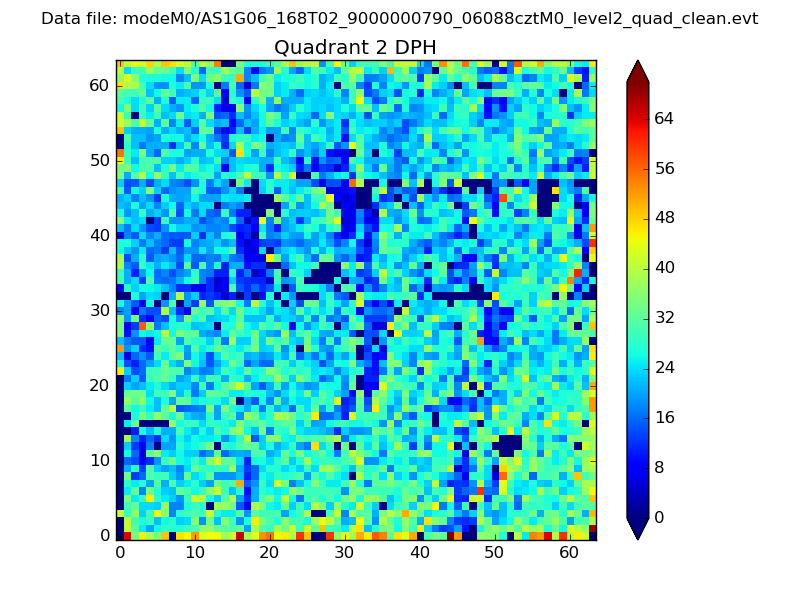 |
Quadrant C |
| Plot type | Count rate plots | Images |
|---|---|---|
| Comparison with Poisson distribution Blue bars denote a histogram of data divided into 1 sec bins. Red curve is a Poisson curve with rate = median count rate of data. |
 |
 |
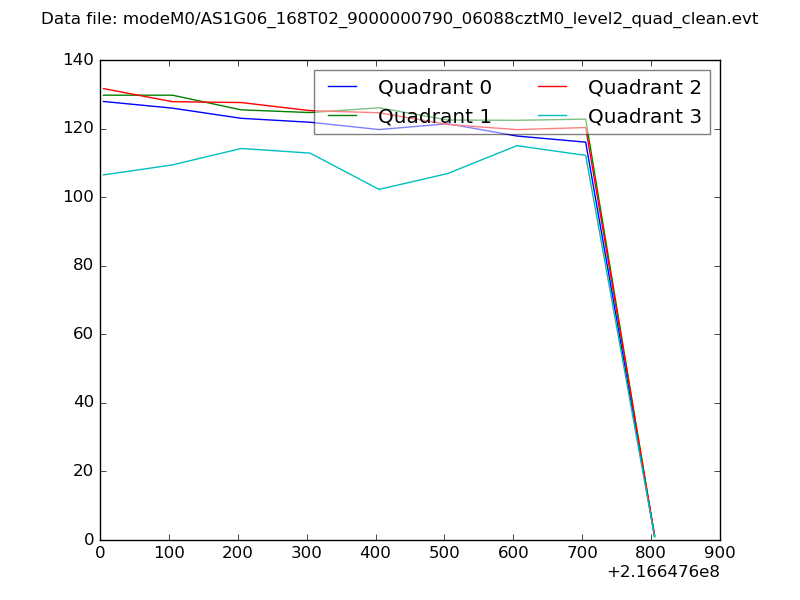
| Quadrant-wise count rates Data is divided into 100 sec bins |
 |
|
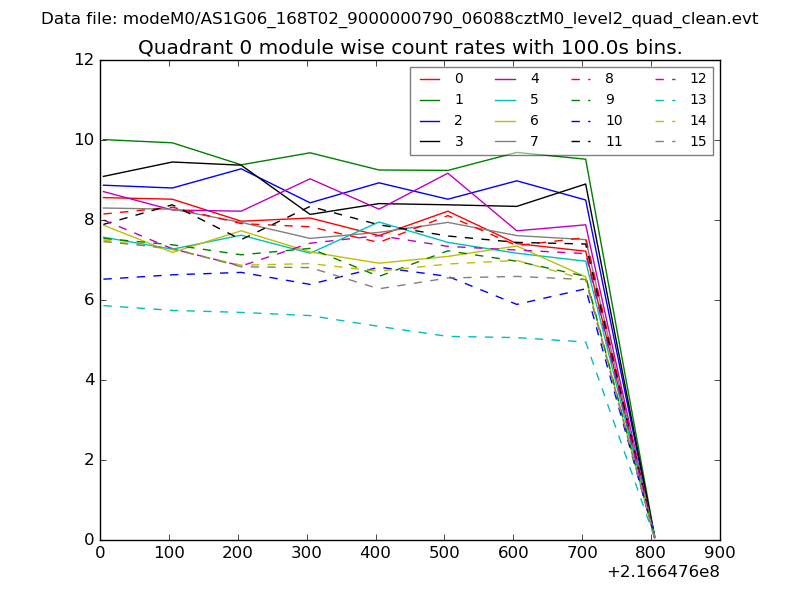
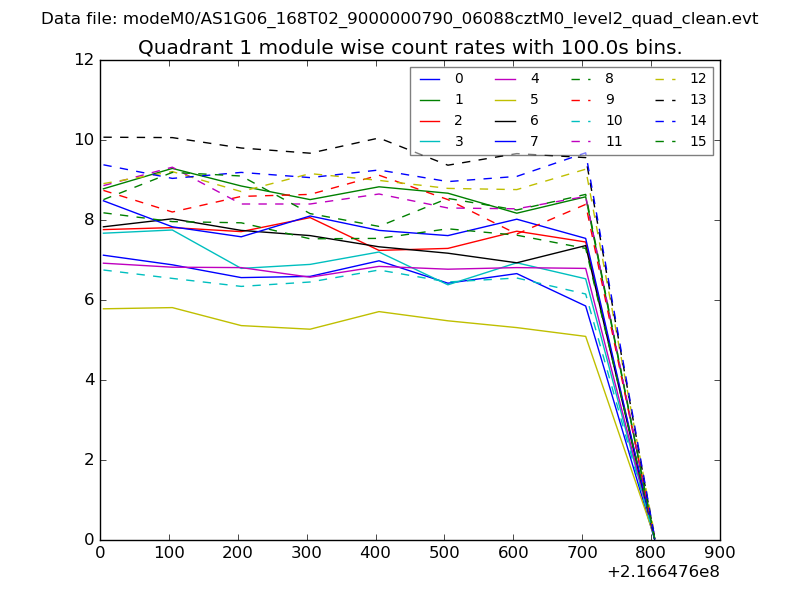
| Module-wise count rates for Quadrant A Data is divided into 100 sec bins |
 |
 |
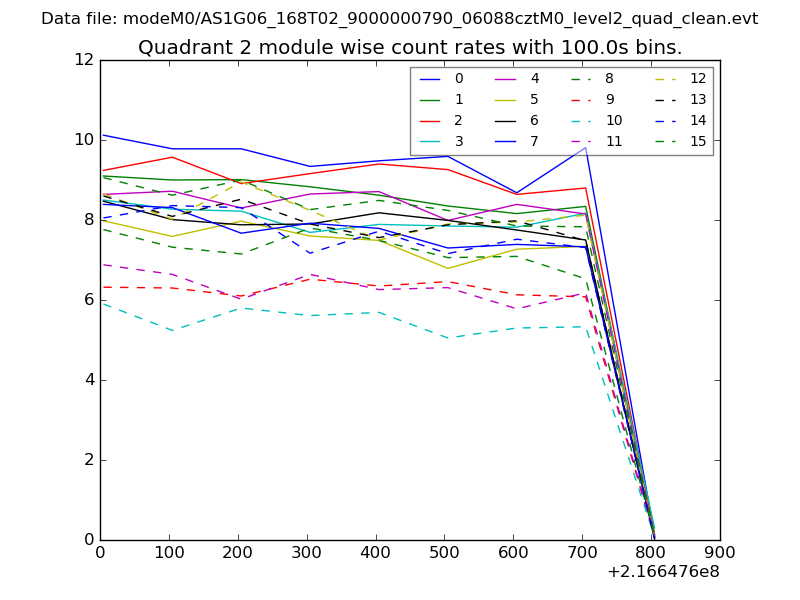
| Module-wise count rates for Quadrant B Data is divided into 100 sec bins |
 |
 |
| Module-wise count rates for Quadrant C Data is divided into 100 sec bins |
 |
 |
| Module-wise count rates for Quadrant D Data is divided into 100 sec bins |
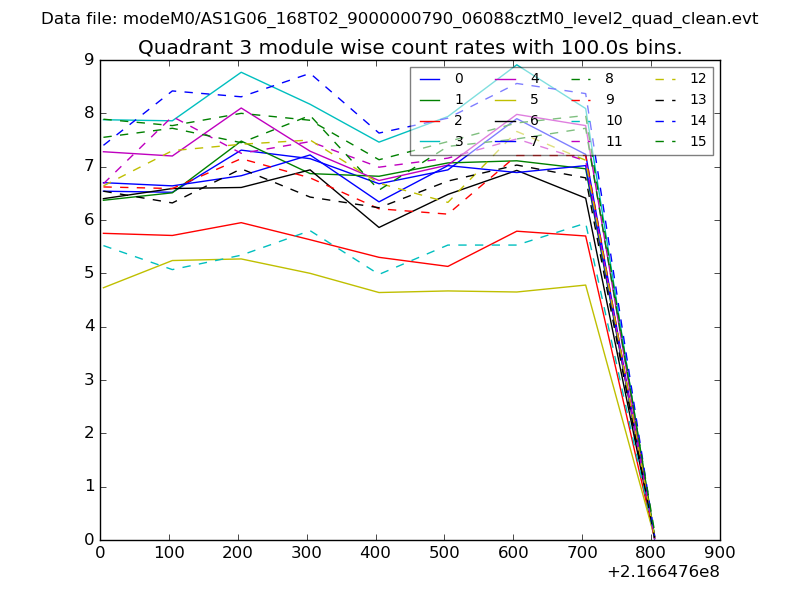 |
 |
| Parameter | Plot |
|---|---|
| CZT HV Monitor | 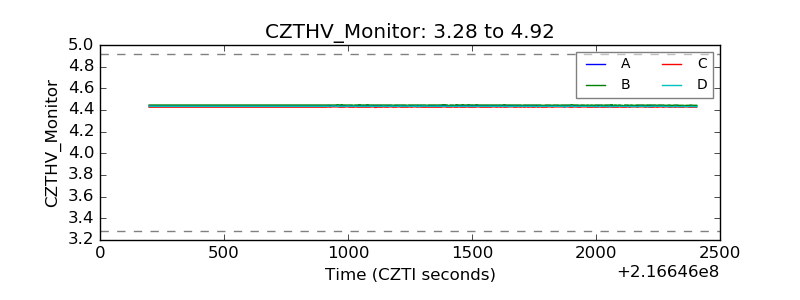 |
| D_VDD | 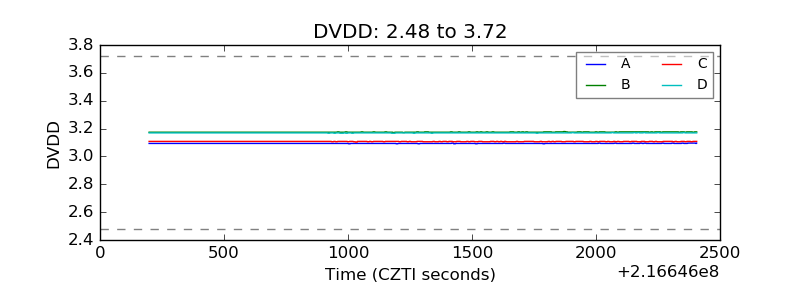 |
| Temperature 1 | 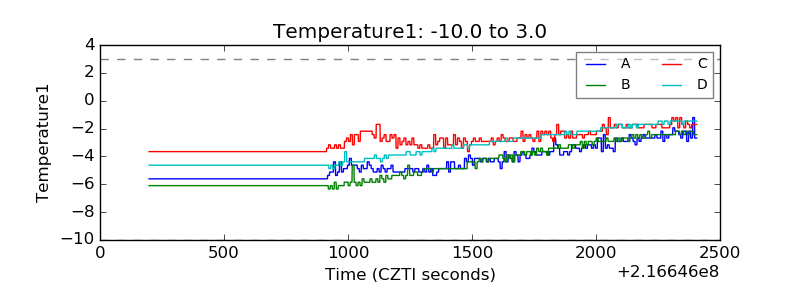 |
| Veto HV Monitor | 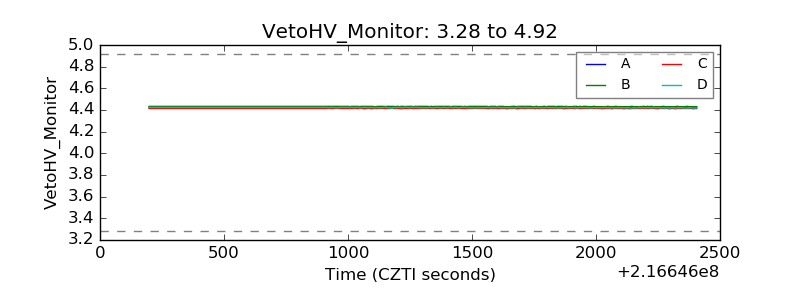 |
| Veto LLD | 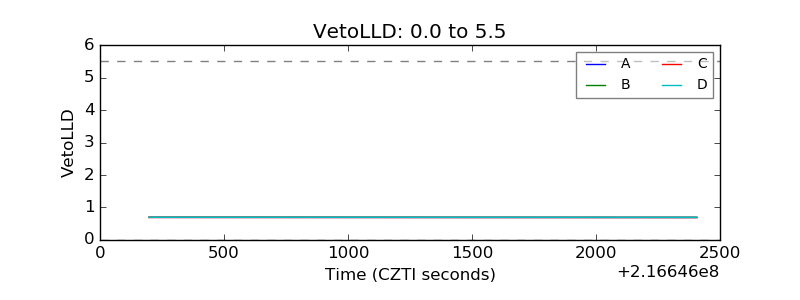 |
| Alpha Counter | 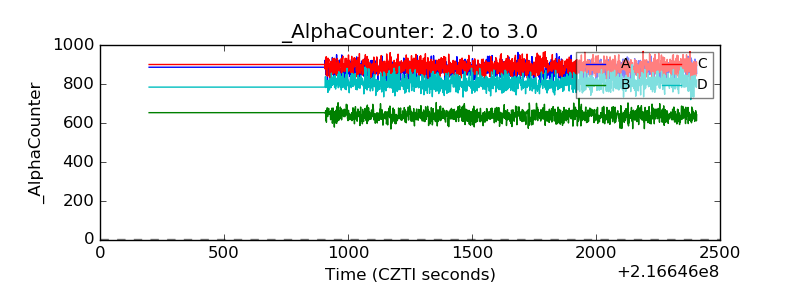 |
| _CPM_Rate | 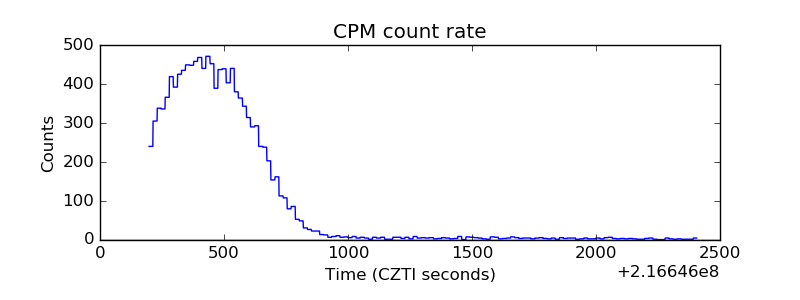 |
| CZT Counter | 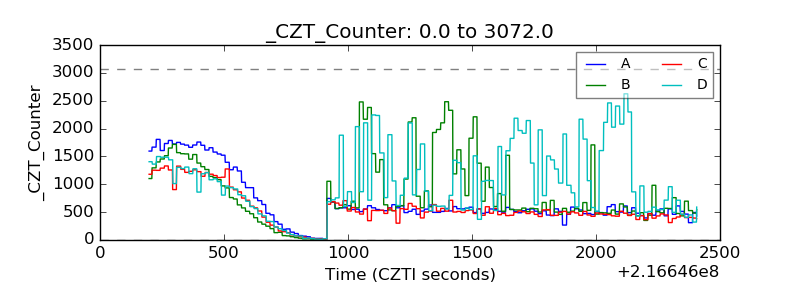 |
| +2.5 Volts monitor | 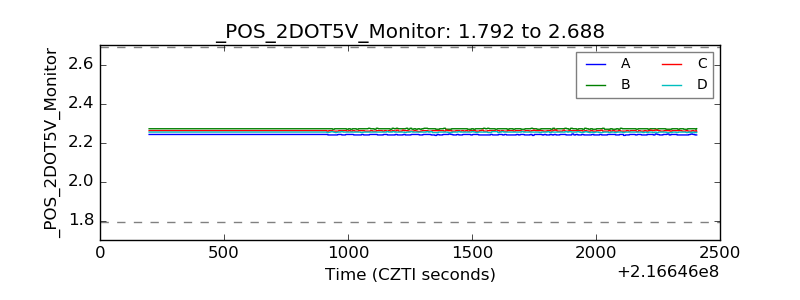 |
| +5 Volts monitor | 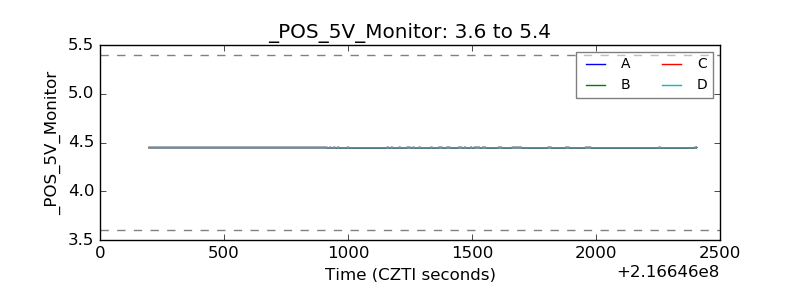 |
| _ROLL_ROT | 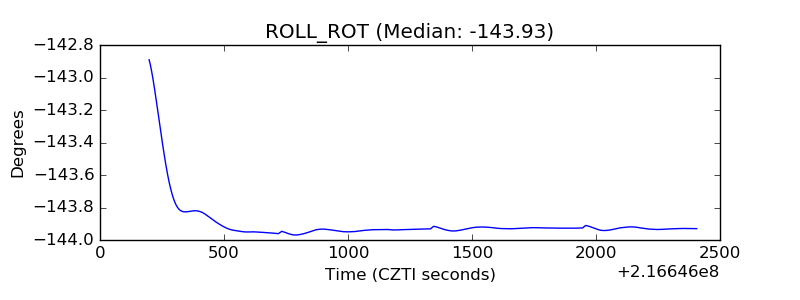 |
| _Roll_DEC | 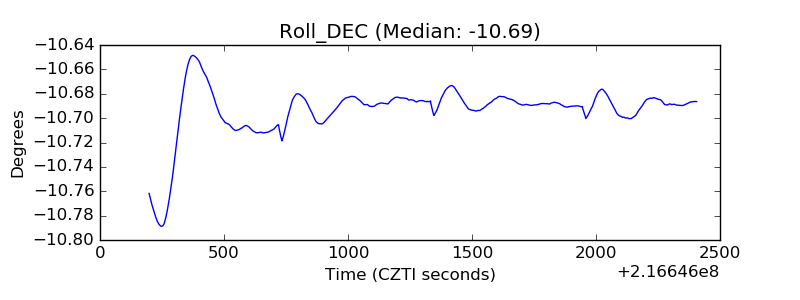 |
| _Roll_RA | 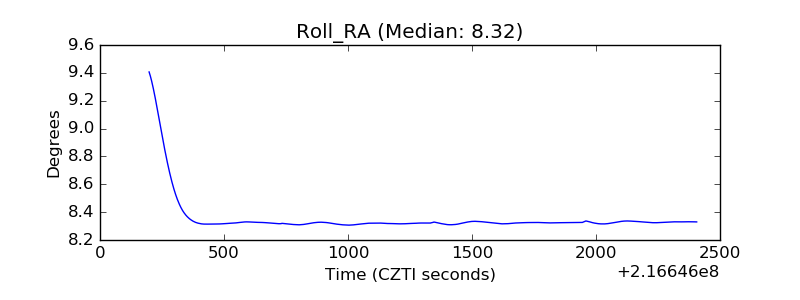 |
| Veto Counter | 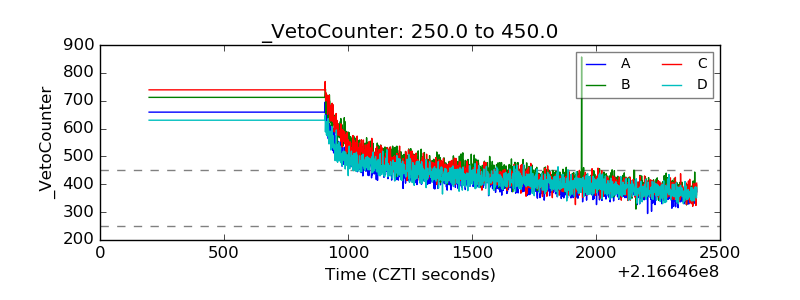 |