| Param | Original file | Final file |
|---|---|---|
| Filename | modeM0/AS1A02_104T01_9000000794cztM0_level2.fits | modeM0/AS1A02_104T01_9000000794cztM0_level2_quad_clean.evt |
| Size (bytes) | 539,043,840 | 489,375,360 |
| Size | 514.1 MB | 466.7 MB |
| Events in quadrant A | 3,166,380 | 2,718,393 |
| Events in quadrant B | 3,150,934 | 2,854,566 |
| Events in quadrant C | 3,251,616 | 2,744,330 |
| Events in quadrant D | 2,757,726 | 2,506,067 |
| Mode SS | |||
|---|---|---|---|
| Quadrant | BADHDUFLAG | Total packets | Discarded packets |
| A | 0 | 1186 | 0 |
| B | 0 | 1186 | 0 |
| C | 0 | 1186 | 0 |
| D | 0 | 1186 | 0 |
| Mode M0 | |||
|---|---|---|---|
| Quadrant | BADHDUFLAG | Total packets | Discarded packets |
| A | 0 | 154289 | 0 |
| B | 0 | 127969 | 0 |
| C | 0 | 120848 | 0 |
| D | 0 | 128914 | 0 |
| Mode M9 | |||
|---|---|---|---|
| Quadrant | BADHDUFLAG | Total packets | Discarded packets |
| A | 0 | 82 | 0 |
| B | 0 | 81 | 0 |
| C | 0 | 81 | 0 |
| D | 0 | 82 | 0 |
| Quadrant | Total seconds | Saturated seconds | Saturation percentage |
|---|---|---|---|
| A | 58252 | 3172 | 5.445307% |
| B | 58254 | 1115 | 1.914032% |
| C | 58256 | 415 | 0.712373% |
| D | 58253 | 1196 | 2.053113% |
Noise dominated data is calculated using 1-second bins in cleaned event files. If a bin has >2000 counts, and if more than 50% of those come from <1% of pixels, then it is considered to be noise-dominated and hence unusable.
| Quadrant | # 1 sec bins | Bins with >0 counts | Bins with >2000 counts | High rate bins dominated by noise | Noise dominated (total time) | Noise dominated (detector-on time) | Marked lightcurve |
|---|---|---|---|---|---|---|---|
| A | 72963 | 58256 | 0 | 0 | 0.00% | 0.00% |  |
| B | 72963 | 58253 | 0 | 0 | 0.00% | 0.00% |  |
| C | 72963 | 58259 | 0 | 0 | 0.00% | 0.00% |  |
| D | 72963 | 58232 | 0 | 0 | 0.00% | 0.00% | 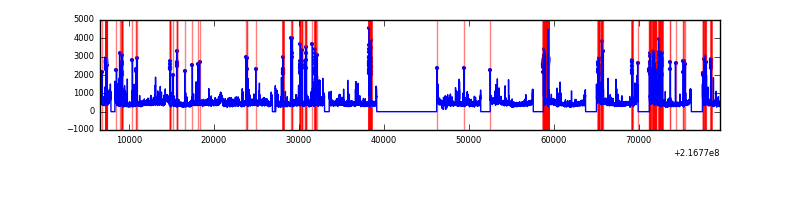 |
Top three noisy pixels from each quadrant. If the there are fewer than three noisy pixels in the level2.evt file, extra rows are filled as -1
| Pixel properties | Quadrant properties | ||||||
|---|---|---|---|---|---|---|---|
| Quadrant | DetID | PixID | Counts | Sigma | Mean | Median | Sigma |
| A | 14 | 188 | 3158 | 11.41 | 821 | 764 | 209.8 |
| A | 0 | 29 | 3124 | 11.25 | 821 | 764 | 209.8 |
| A | 14 | 204 | 2750 | 9.47 | 821 | 764 | 209.8 |
| B | 2 | 9 | 2689 | 11.18 | 831 | 786 | 170.2 |
| B | 12 | 226 | 2241 | 8.55 | 831 | 786 | 170.2 |
| B | 14 | 254 | 2217 | 8.41 | 831 | 786 | 170.2 |
| C | 1 | 80 | 2370 | 6.76 | 859 | 792 | 233.3 |
| C | 12 | 241 | 2338 | 6.63 | 859 | 792 | 233.3 |
| C | 1 | 81 | 2282 | 6.39 | 859 | 792 | 233.3 |
| D | 7 | 5 | 2059 | 6.39 | 786 | 714 | 210.6 |
| D | 6 | 231 | 2007 | 6.14 | 786 | 714 | 210.6 |
| D | 1 | 19 | 1972 | 5.97 | 786 | 714 | 210.6 |
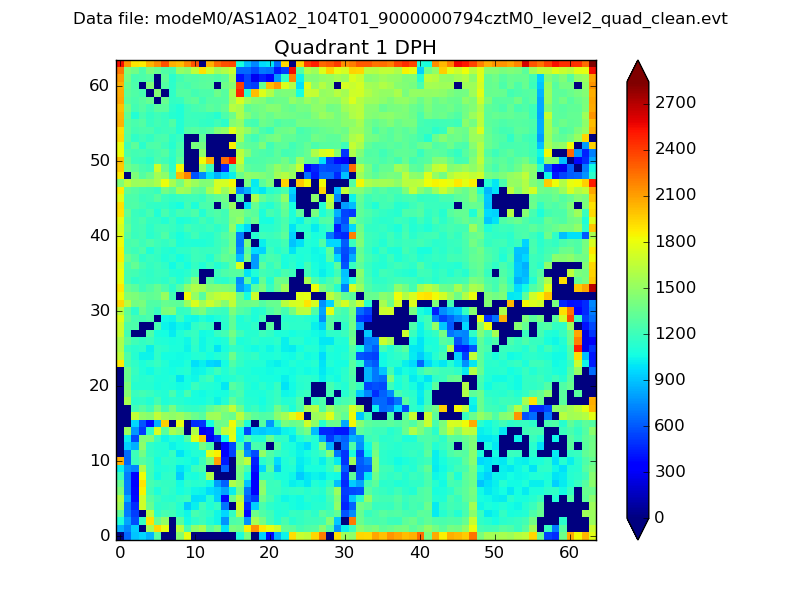
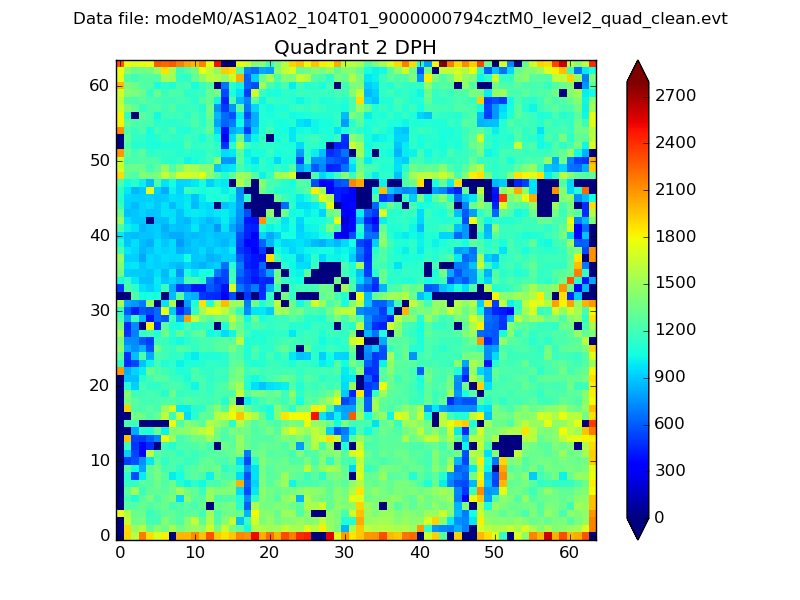
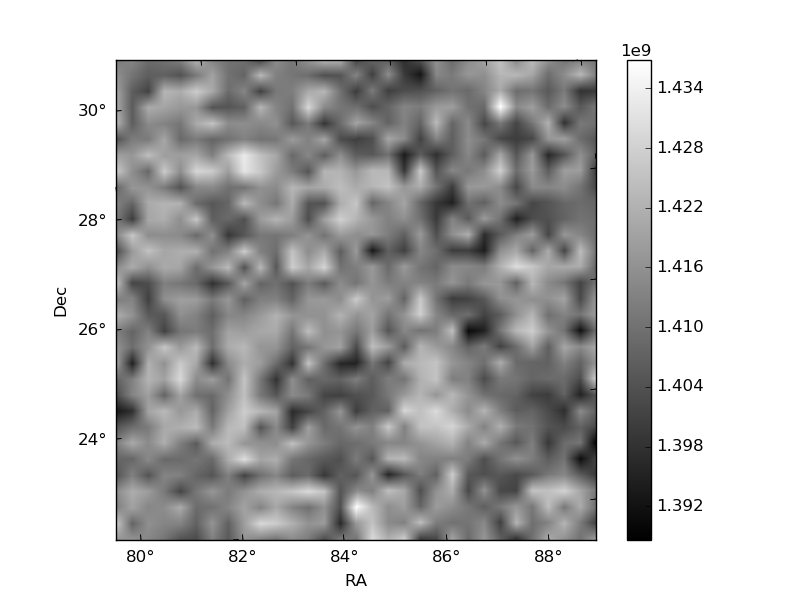
Histogram calculated using DETX and DETY for each event in the final _common_clean file
| Quadrant A |  |
 |
Quadrant B |
|---|---|---|---|
| Quadrant D |  |
 |
Quadrant C |
| Plot type | Count rate plots | Images |
|---|---|---|
| Comparison with Poisson distribution Blue bars denote a histogram of data divided into 1 sec bins. Red curve is a Poisson curve with rate = median count rate of data. |
 |
 |
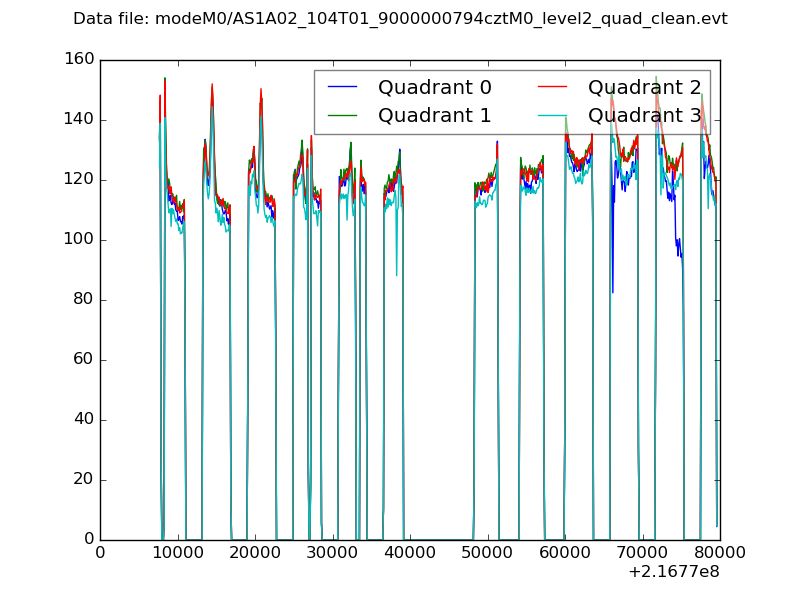
| Quadrant-wise count rates Data is divided into 100 sec bins |
 |
|
| Module-wise count rates for Quadrant A Data is divided into 100 sec bins |
 |
 |
| Module-wise count rates for Quadrant B Data is divided into 100 sec bins |
 |
 |
| Module-wise count rates for Quadrant C Data is divided into 100 sec bins |
 |
 |
| Module-wise count rates for Quadrant D Data is divided into 100 sec bins |
 |
 |
| Parameter | Plot |
|---|---|
| CZT HV Monitor |  |
| D_VDD | 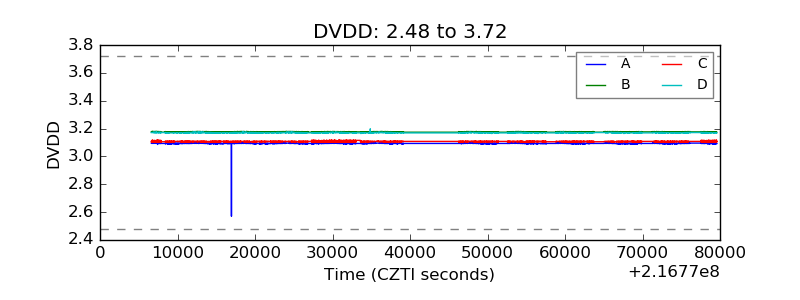 |
| Temperature 1 |  |
| Veto HV Monitor |  |
| Veto LLD |  |
| Alpha Counter |  |
| _CPM_Rate |  |
| CZT Counter | 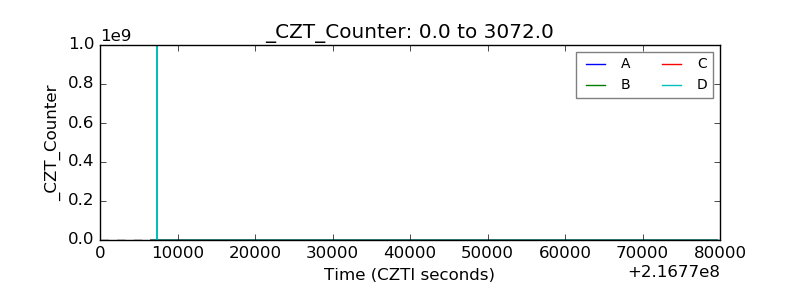 |
| +2.5 Volts monitor |  |
| +5 Volts monitor |  |
| _ROLL_ROT |  |
| _Roll_DEC |  |
| _Roll_RA |  |
| Veto Counter |  |