| Param | Original file | Final file |
|---|---|---|
| Filename | modeM0/AS1A02_104T01_9000000794_06111cztM0_level2.evt | modeM0/AS1A02_104T01_9000000794_06111cztM0_level2_quad_clean.evt |
| Size (bytes) | 199,857,600 | 37,281,600 |
| Size | 190.6 MB | 35.6 MB |
| Events in quadrant A | 1,363,503 | 234,416 |
| Events in quadrant B | 1,591,134 | 238,669 |
| Events in quadrant C | 1,342,735 | 235,759 |
| Events in quadrant D | 1,567,796 | 224,419 |
| Mode SS | |||
|---|---|---|---|
| Quadrant | BADHDUFLAG | Total packets | Discarded packets |
| A | 0 | 58 | 0 |
| B | 0 | 58 | 0 |
| C | 0 | 58 | 0 |
| D | 0 | 58 | 0 |
| Mode M0 | |||
|---|---|---|---|
| Quadrant | BADHDUFLAG | Total packets | Discarded packets |
| A | 0 | 5875 | 2 |
| B | 0 | 6567 | 1 |
| C | 0 | 5820 | 1 |
| D | 0 | 6518 | 1 |
| Mode M9 | |||
|---|---|---|---|
| Quadrant | BADHDUFLAG | Total packets | Discarded packets |
| A | 0 | 4 | 0 |
| B | 0 | 4 | 0 |
| C | 0 | 4 | 0 |
| D | 0 | 4 | 0 |
| Quadrant | Total seconds | Saturated seconds | Saturation percentage |
|---|---|---|---|
| A | 2723 | 39 | 1.432244% |
| B | 2723 | 107 | 3.929490% |
| C | 2723 | 13 | 0.477415% |
| D | 2723 | 71 | 2.607418% |
Noise dominated data is calculated using 1-second bins in cleaned event files. If a bin has >2000 counts, and if more than 50% of those come from <1% of pixels, then it is considered to be noise-dominated and hence unusable.
| Quadrant | # 1 sec bins | Bins with >0 counts | Bins with >2000 counts | High rate bins dominated by noise | Noise dominated (total time) | Noise dominated (detector-on time) | Marked lightcurve |
|---|---|---|---|---|---|---|---|
| A | 3198 | 2724 | 0 | 0 | 0.00% | 0.00% | 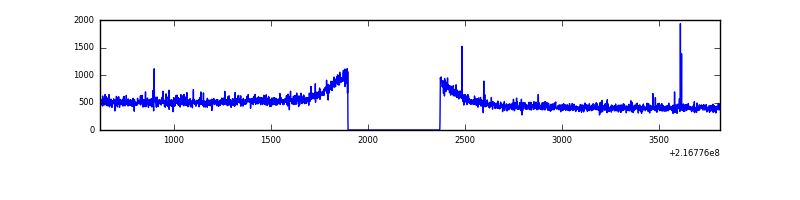 |
| B | 3198 | 2724 | 21 | 21 | 0.66% | 0.77% | 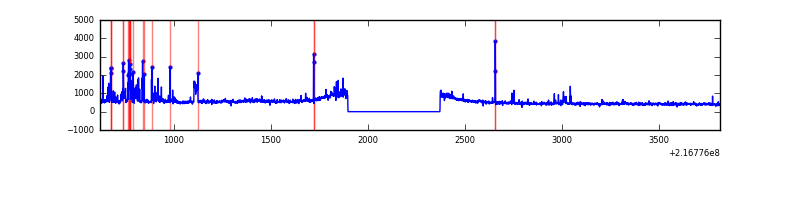 |
| C | 3198 | 2724 | 0 | 0 | 0.00% | 0.00% | 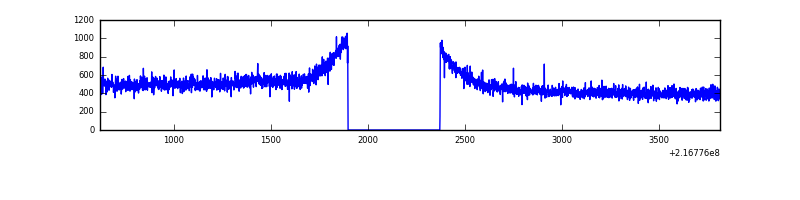 |
| D | 3198 | 2724 | 51 | 51 | 1.59% | 1.87% | 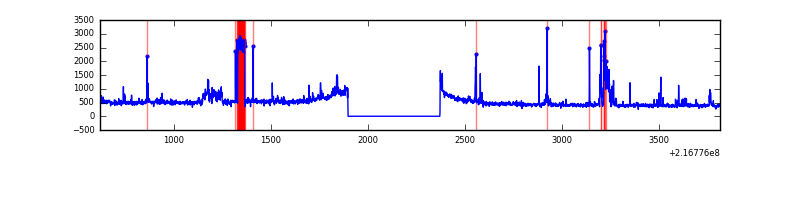 |
Top three noisy pixels from each quadrant. If the there are fewer than three noisy pixels in the level2.evt file, extra rows are filled as -1
| Pixel properties | Quadrant properties | ||||||
|---|---|---|---|---|---|---|---|
| Quadrant | DetID | PixID | Counts | Sigma | Mean | Median | Sigma |
| A | 8 | 15 | 27680 | 365.7 | 346 | 337 | 74.8 |
| A | 0 | 226 | 3365 | 40.5 | 346 | 337 | 74.8 |
| A | 12 | 194 | 3340 | 40.16 | 346 | 337 | 74.8 |
| B | 3 | 64 | 167160 | 2308.54 | 353 | 345 | 72.3 |
| B | 15 | 204 | 18188 | 246.93 | 353 | 345 | 72.3 |
| B | 0 | 214 | 11316 | 151.83 | 353 | 345 | 72.3 |
| C | 1 | 16 | 12359 | 145.55 | 339 | 340 | 82.6 |
| C | 8 | 128 | 2737 | 29.03 | 339 | 340 | 82.6 |
| C | 13 | 61 | 2703 | 28.62 | 339 | 340 | 82.6 |
| D | 5 | 97 | 106738 | 1248.94 | 331 | 319 | 85.2 |
| D | 2 | 206 | 84508 | 988.05 | 331 | 319 | 85.2 |
| D | 2 | 14 | 43018 | 501.12 | 331 | 319 | 85.2 |
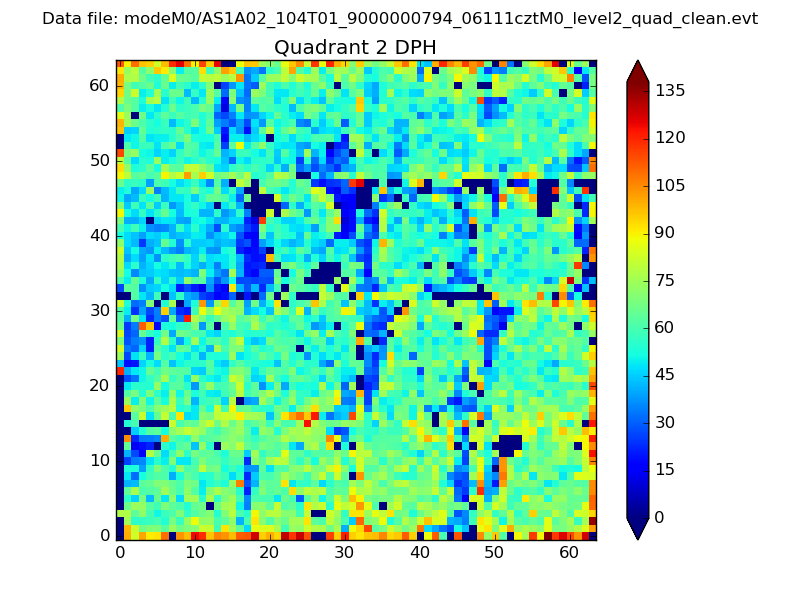
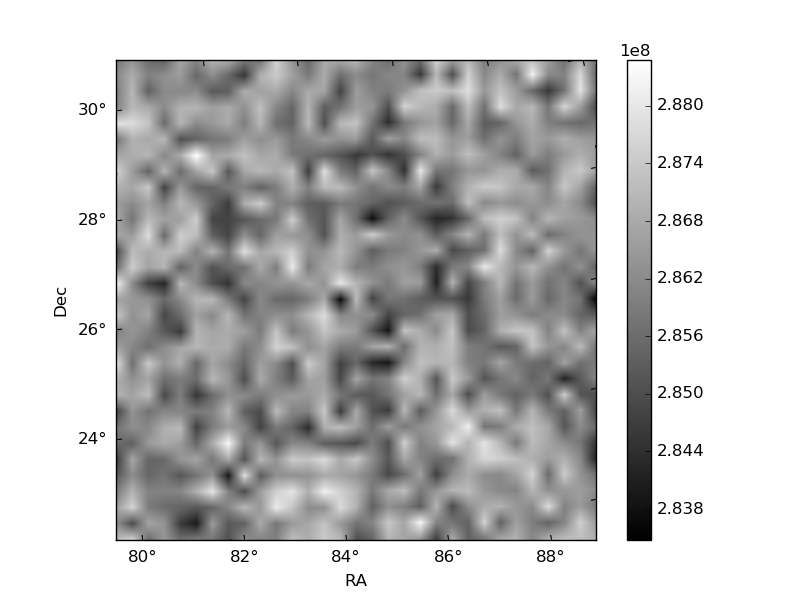
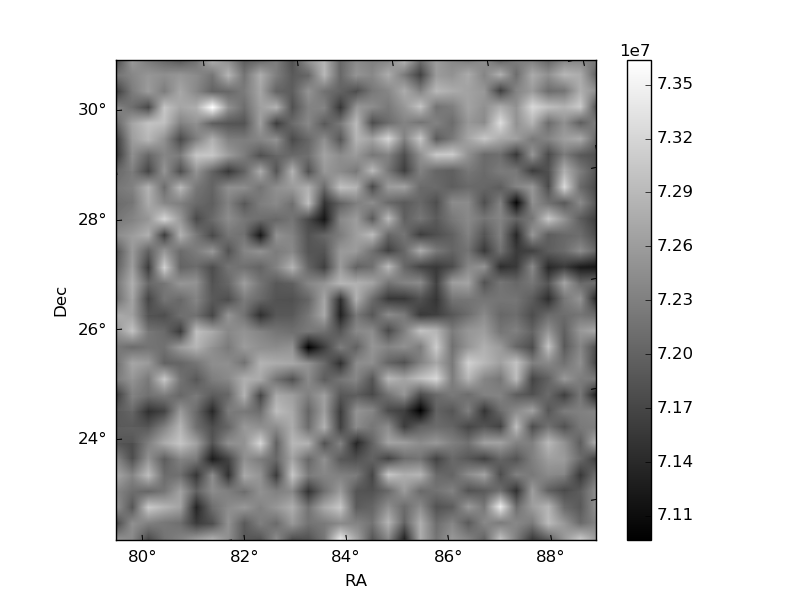
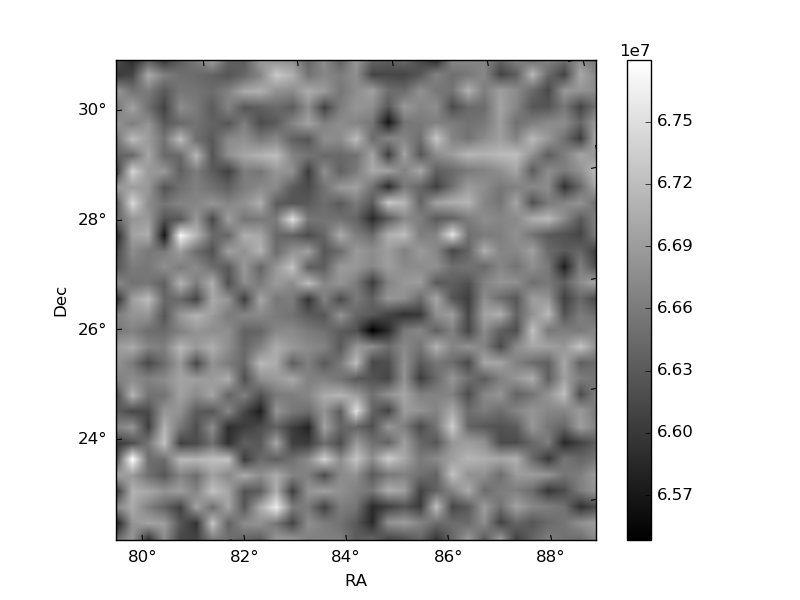
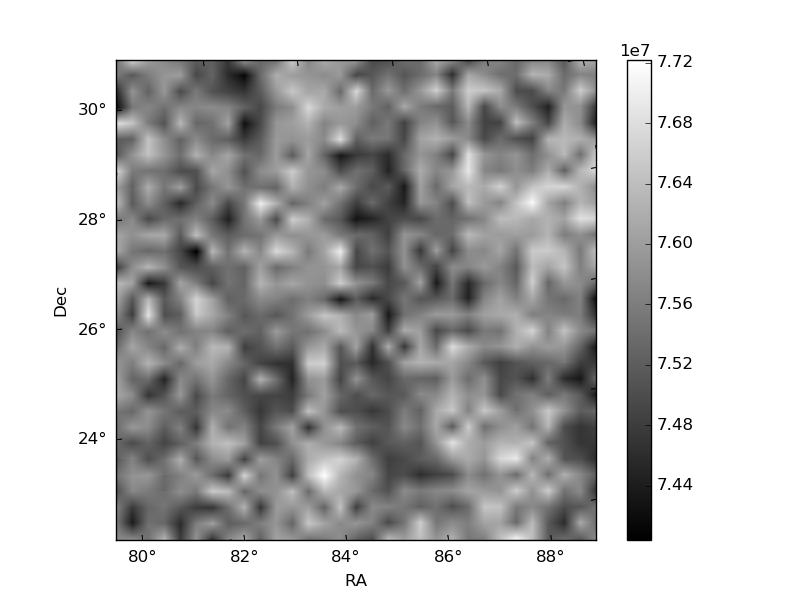
Histogram calculated using DETX and DETY for each event in the final _common_clean file
| Quadrant A | 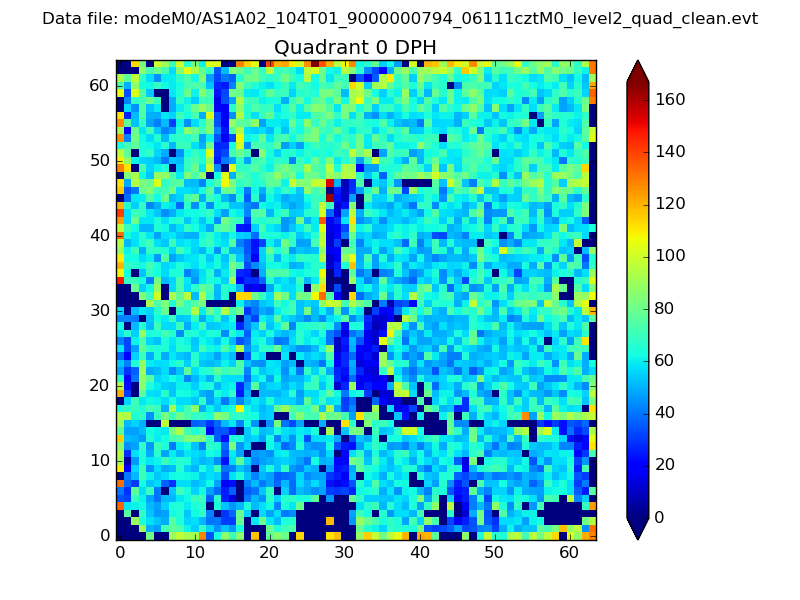 |
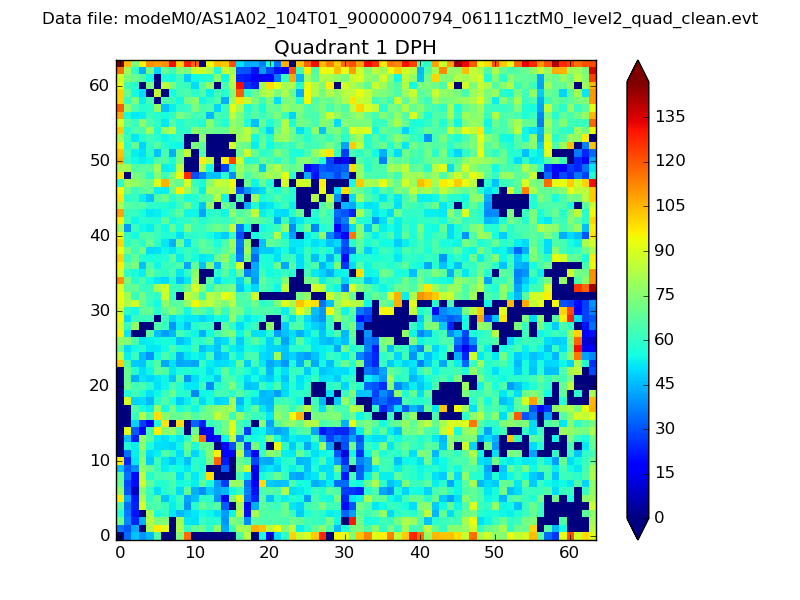 |
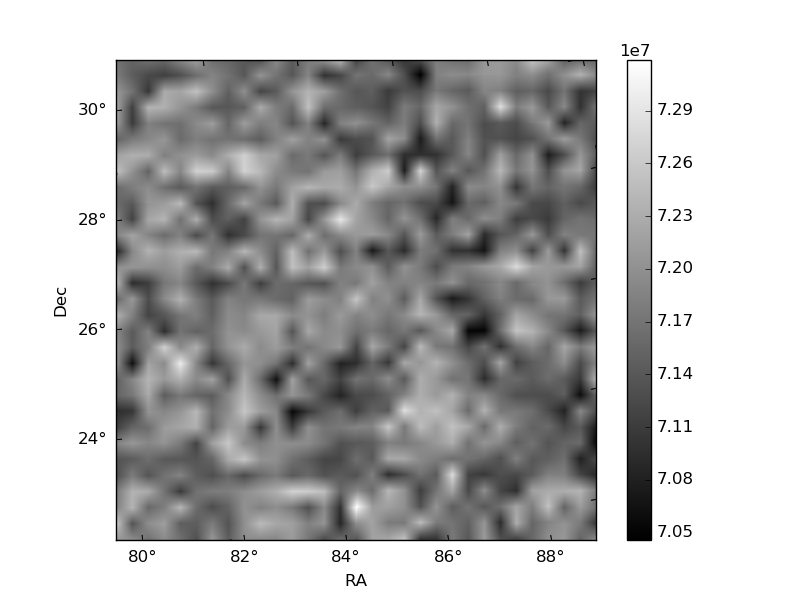
Quadrant B |
|---|---|---|---|
| Quadrant D | 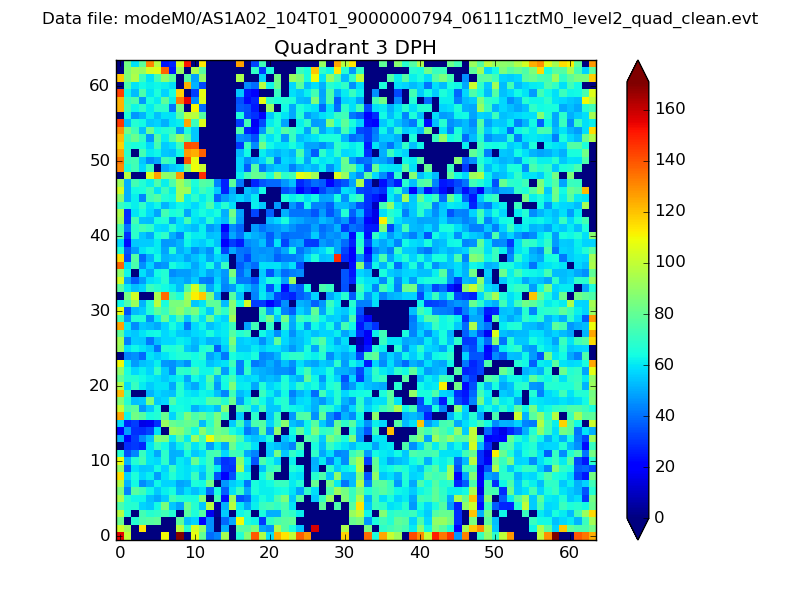 |
 |
Quadrant C |
| Plot type | Count rate plots | Images |
|---|---|---|
| Comparison with Poisson distribution Blue bars denote a histogram of data divided into 1 sec bins. Red curve is a Poisson curve with rate = median count rate of data. |
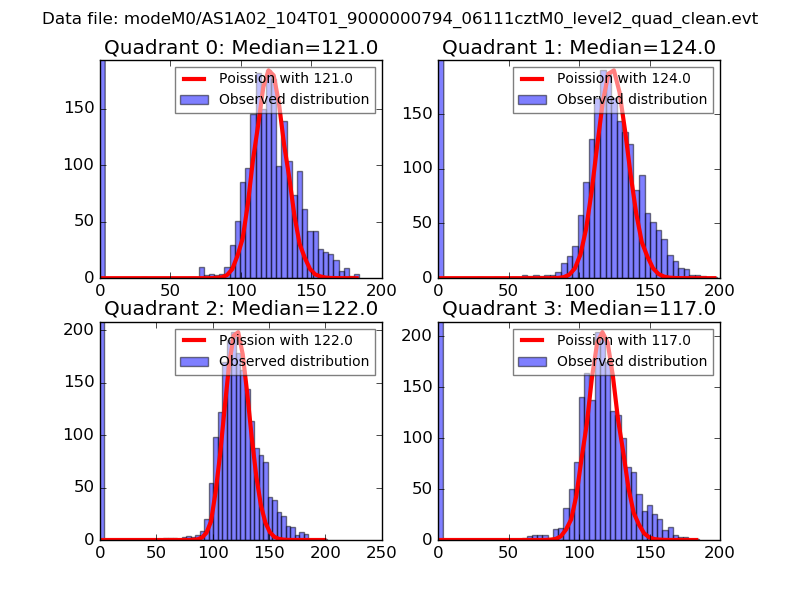 |
 |
| Quadrant-wise count rates Data is divided into 100 sec bins |
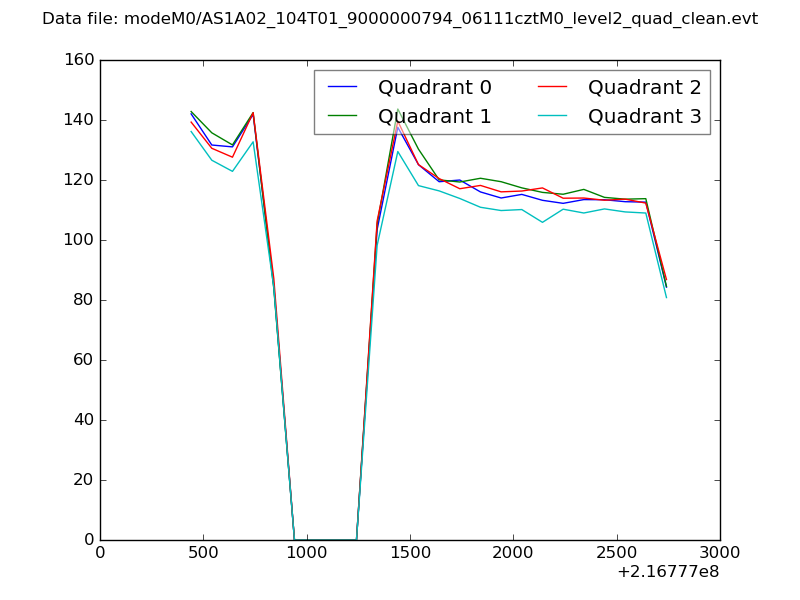 |
|
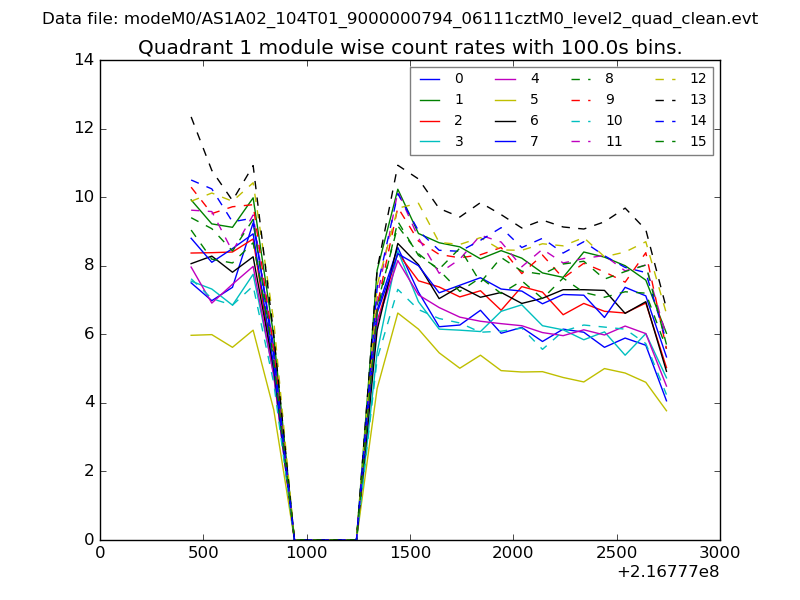
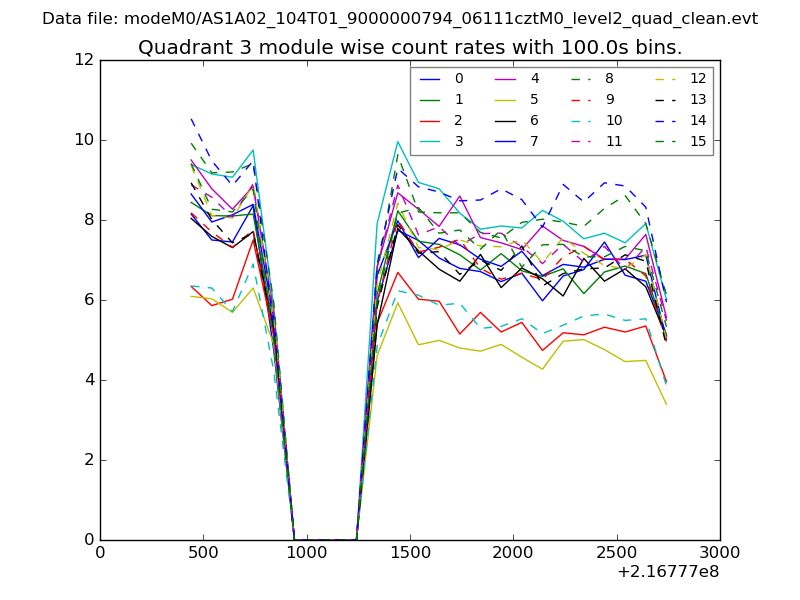
| Module-wise count rates for Quadrant A Data is divided into 100 sec bins |
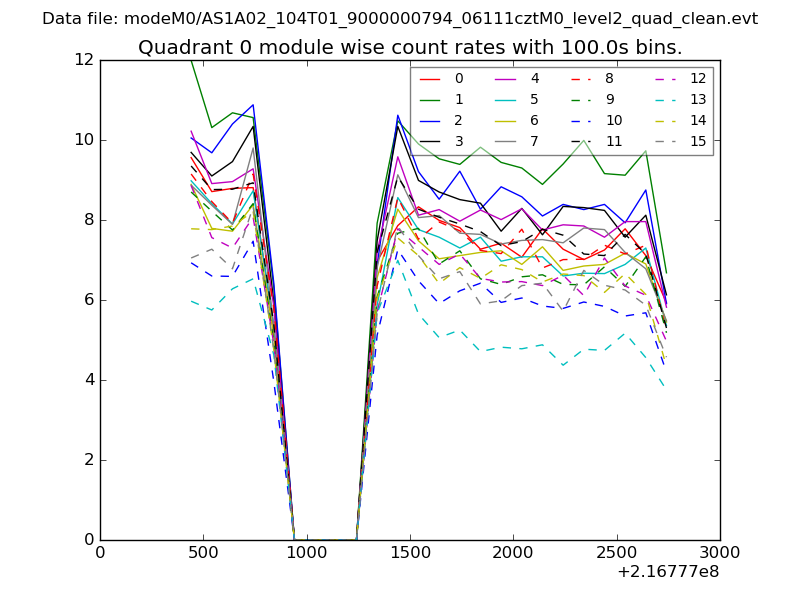 |
 |
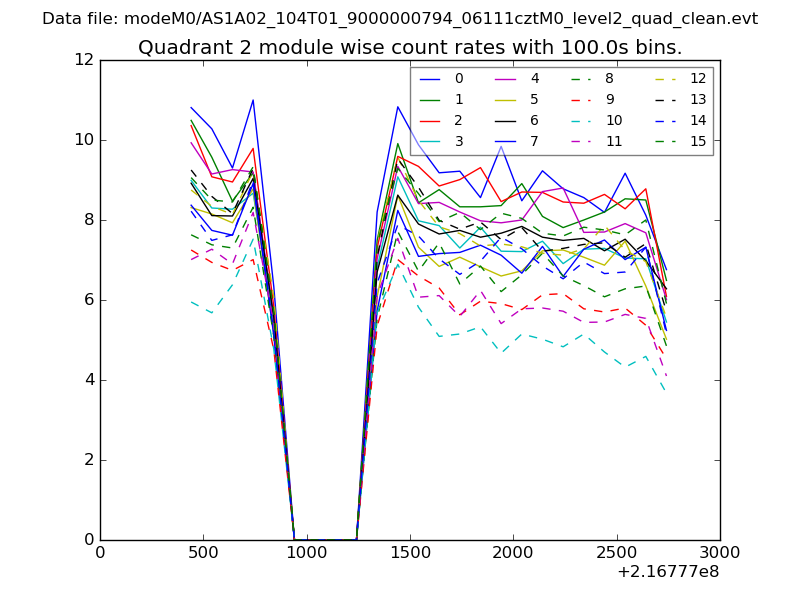
| Module-wise count rates for Quadrant B Data is divided into 100 sec bins |
 |
 |
| Module-wise count rates for Quadrant C Data is divided into 100 sec bins |
 |
 |
| Module-wise count rates for Quadrant D Data is divided into 100 sec bins |
 |
 |
| Parameter | Plot |
|---|---|
| CZT HV Monitor | 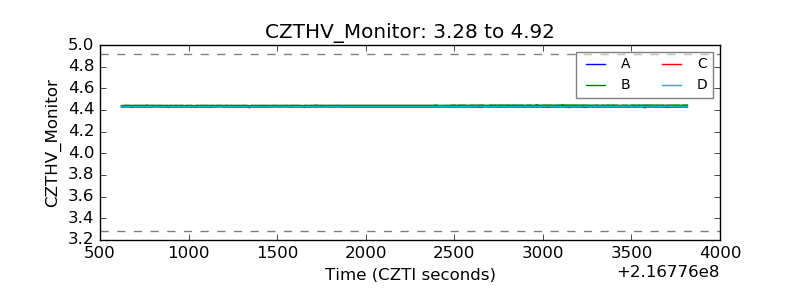 |
| D_VDD | 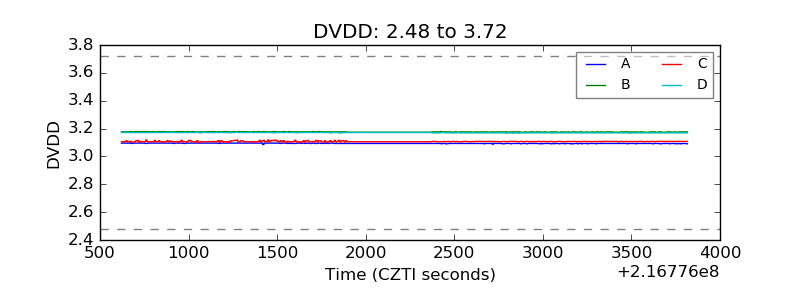 |
| Temperature 1 | 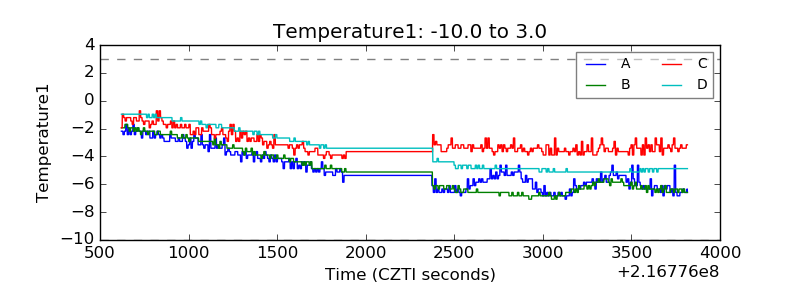 |
| Veto HV Monitor | 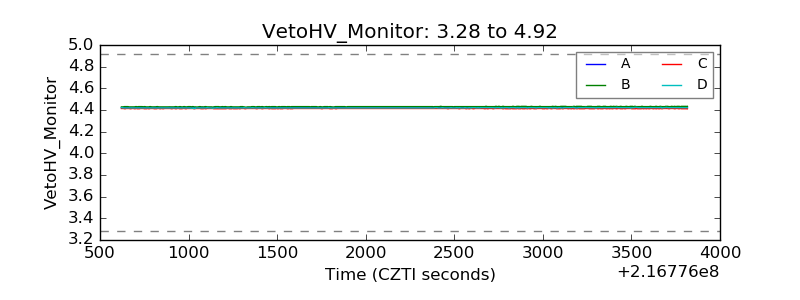 |
| Veto LLD | 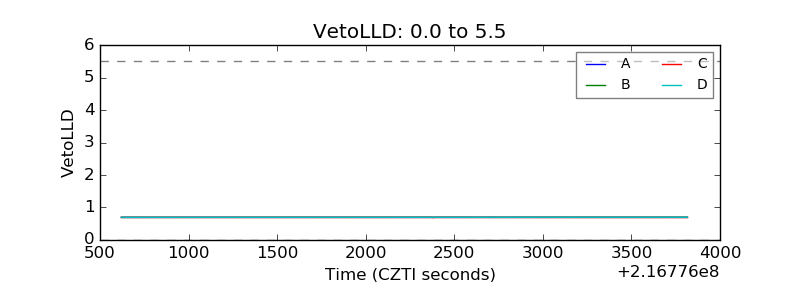 |
| Alpha Counter | 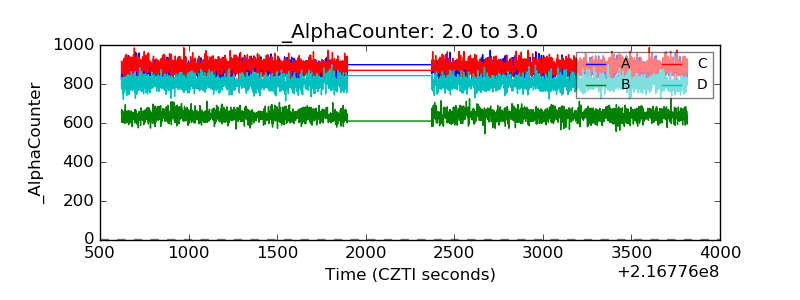 |
| _CPM_Rate | 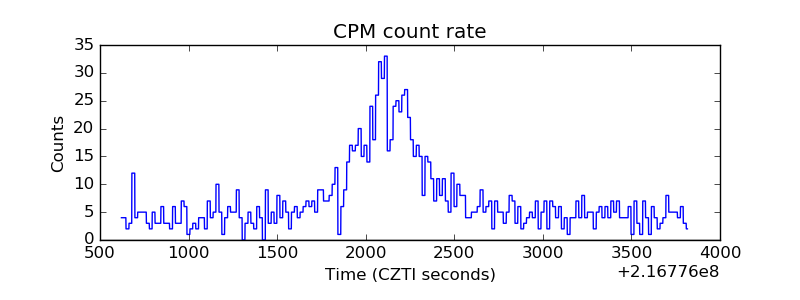 |
| CZT Counter | 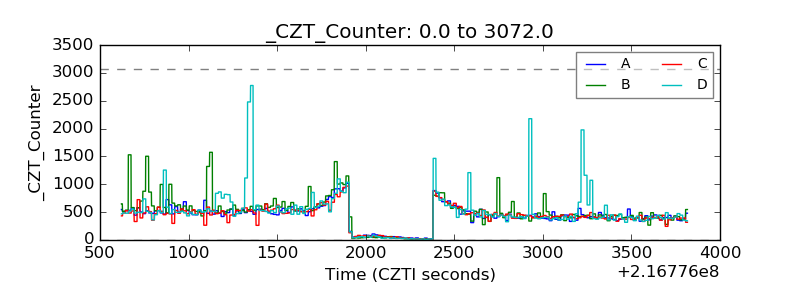 |
| +2.5 Volts monitor | 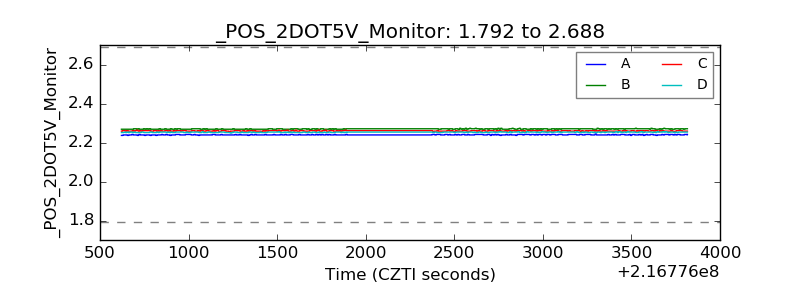 |
| +5 Volts monitor |  |
| _ROLL_ROT | 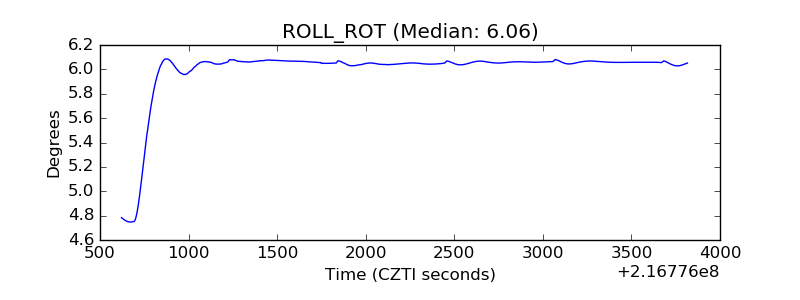 |
| _Roll_DEC | 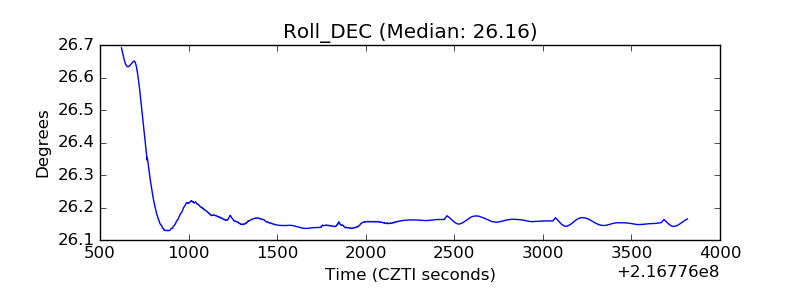 |
| _Roll_RA | 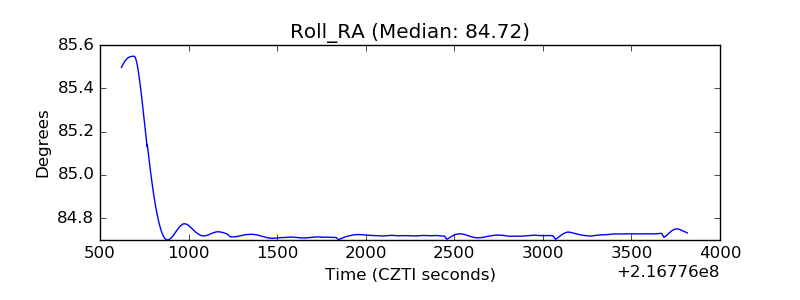 |
| Veto Counter | 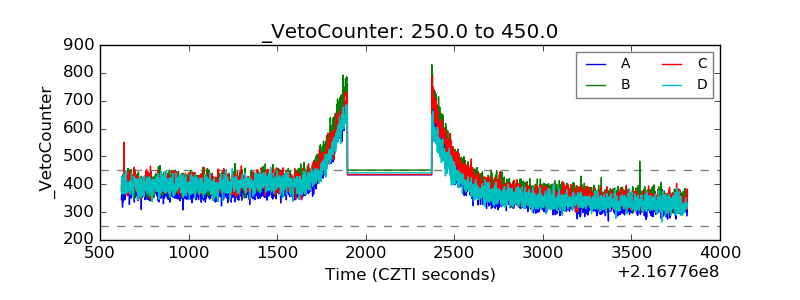 |