| Param | Original file | Final file |
|---|---|---|
| Filename | modeM0/AS1A02_104T01_9000000794_06119cztM0_level2.evt | modeM0/AS1A02_104T01_9000000794_06119cztM0_level2_quad_clean.evt |
| Size (bytes) | 2,487,476,160 | 433,258,560 |
| Size | 2.3 GB | 413.2 MB |
| Events in quadrant A | 18,148,775 | 2,636,746 |
| Events in quadrant B | 19,053,542 | 2,692,750 |
| Events in quadrant C | 17,134,921 | 2,666,062 |
| Events in quadrant D | 18,446,219 | 2,534,684 |
| Mode SS | |||
|---|---|---|---|
| Quadrant | BADHDUFLAG | Total packets | Discarded packets |
| A | 0 | 768 | 0 |
| B | 0 | 768 | 0 |
| C | 0 | 768 | 0 |
| D | 0 | 768 | 0 |
| Mode M0 | |||
|---|---|---|---|
| Quadrant | BADHDUFLAG | Total packets | Discarded packets |
| A | 0 | 79408 | 32 |
| B | 0 | 81719 | 21 |
| C | 0 | 77685 | 15 |
| D | 0 | 81523 | 23 |
| Mode M9 | |||
|---|---|---|---|
| Quadrant | BADHDUFLAG | Total packets | Discarded packets |
| A | 0 | 31 | 0 |
| B | 0 | 30 | 0 |
| C | 0 | 30 | 0 |
| D | 0 | 31 | 0 |
| Quadrant | Total seconds | Saturated seconds | Saturation percentage |
|---|---|---|---|
| A | 37729 | 558 | 1.478968% |
| B | 37728 | 729 | 1.932252% |
| C | 37731 | 238 | 0.630781% |
| D | 37727 | 520 | 1.378323% |
Noise dominated data is calculated using 1-second bins in cleaned event files. If a bin has >2000 counts, and if more than 50% of those come from <1% of pixels, then it is considered to be noise-dominated and hence unusable.
| Quadrant | # 1 sec bins | Bins with >0 counts | Bins with >2000 counts | High rate bins dominated by noise | Noise dominated (total time) | Noise dominated (detector-on time) | Marked lightcurve |
|---|---|---|---|---|---|---|---|
| A | 47307 | 37738 | 15 | 15 | 0.03% | 0.04% | 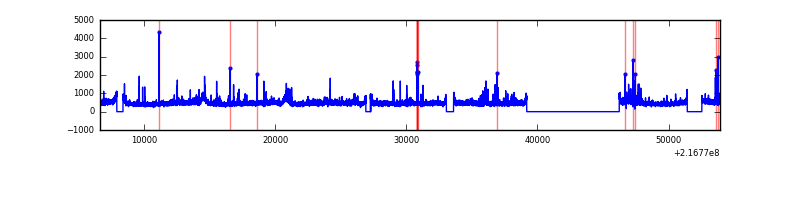 |
| B | 47307 | 37740 | 139 | 139 | 0.29% | 0.37% | 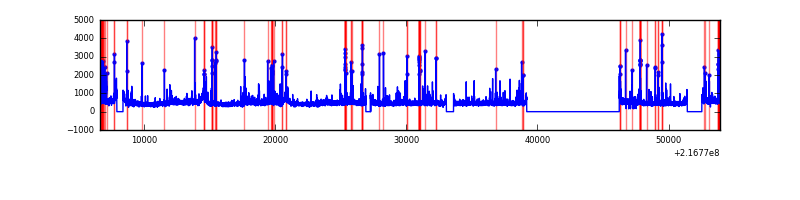 |
| C | 47307 | 37741 | 3 | 3 | 0.01% | 0.01% | 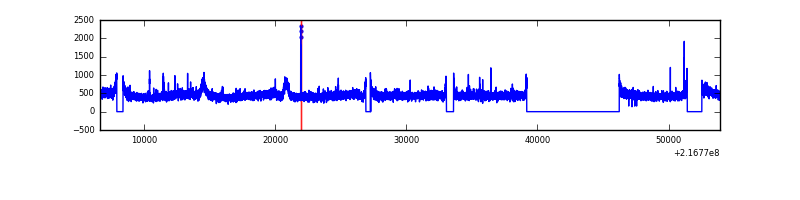 |
| D | 47307 | 37740 | 199 | 199 | 0.42% | 0.53% | 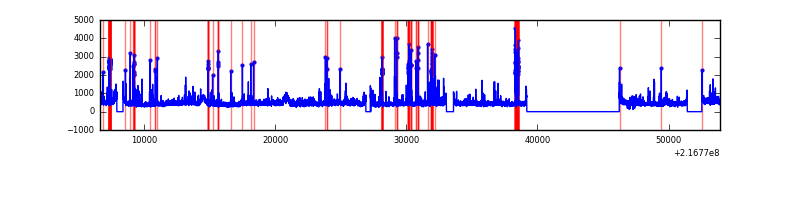 |
Top three noisy pixels from each quadrant. If the there are fewer than three noisy pixels in the level2.evt file, extra rows are filled as -1
| Pixel properties | Quadrant properties | ||||||
|---|---|---|---|---|---|---|---|
| Quadrant | DetID | PixID | Counts | Sigma | Mean | Median | Sigma |
| A | 8 | 15 | 912916 | 991.91 | 4443 | 4332 | 916.0 |
| A | 13 | 251 | 71457 | 73.28 | 4443 | 4332 | 916.0 |
| A | 12 | 194 | 44883 | 44.27 | 4443 | 4332 | 916.0 |
| B | 3 | 64 | 1023171 | 1162.89 | 4492 | 4369 | 876.1 |
| B | 15 | 204 | 196949 | 219.82 | 4492 | 4369 | 876.1 |
| B | 0 | 214 | 138129 | 152.68 | 4492 | 4369 | 876.1 |
| C | 1 | 16 | 147758 | 141.65 | 4330 | 4337 | 1012.5 |
| C | 9 | 54 | 56206 | 51.23 | 4330 | 4337 | 1012.5 |
| C | 13 | 61 | 34802 | 30.09 | 4330 | 4337 | 1012.5 |
| D | 13 | 105 | 571573 | 532.46 | 4317 | 4181 | 1065.6 |
| D | 14 | 173 | 300459 | 278.04 | 4317 | 4181 | 1065.6 |
| D | 2 | 206 | 296718 | 274.53 | 4317 | 4181 | 1065.6 |
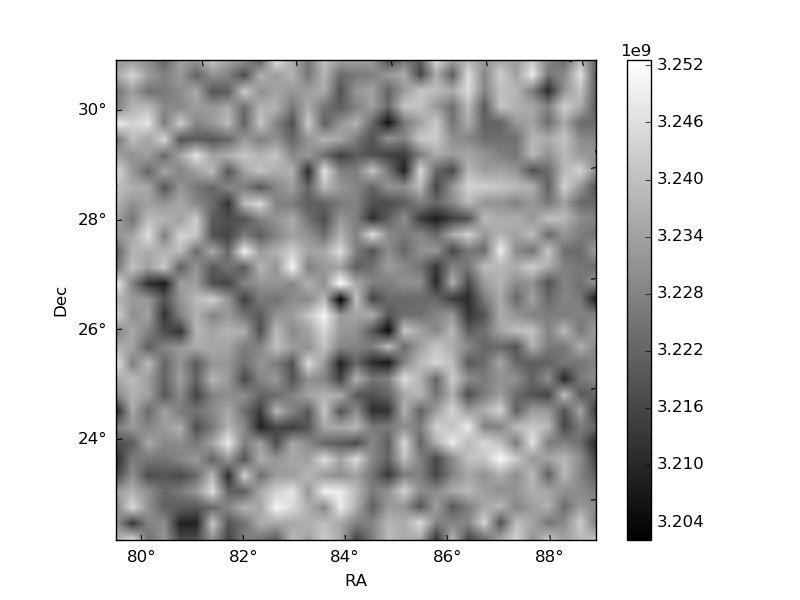
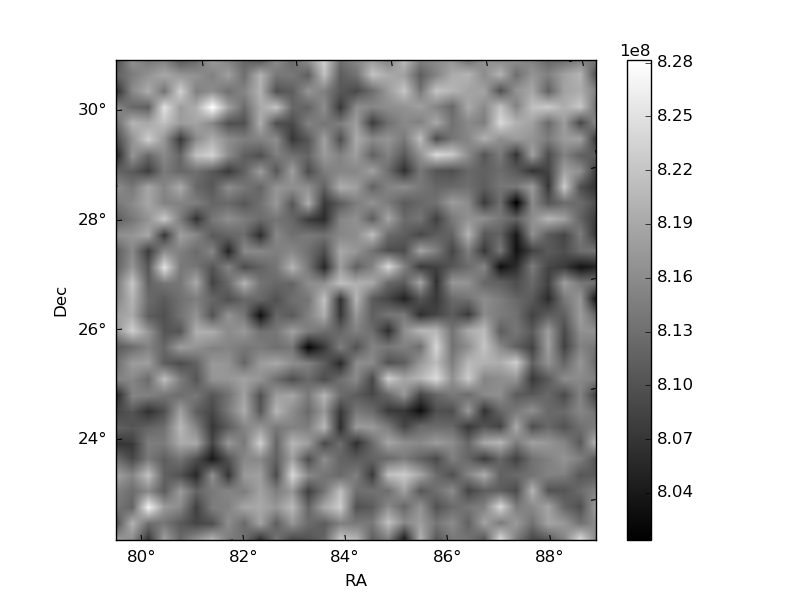
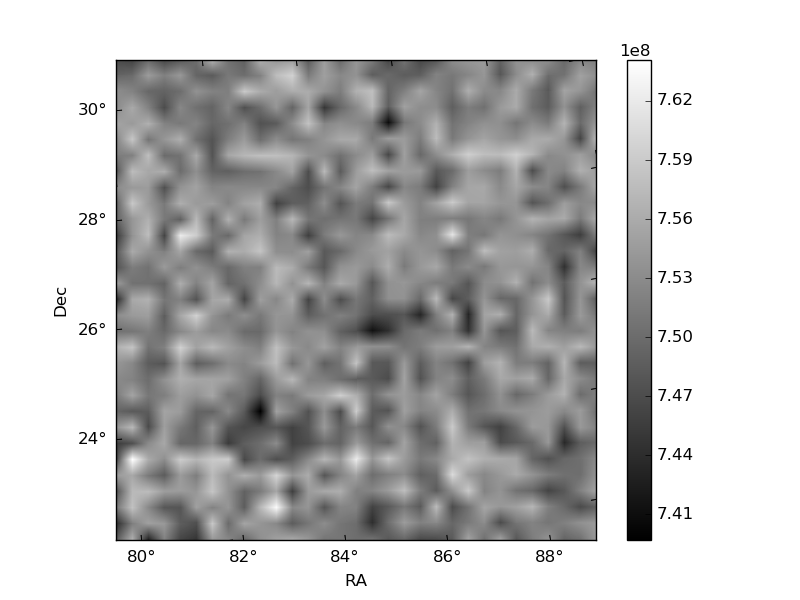
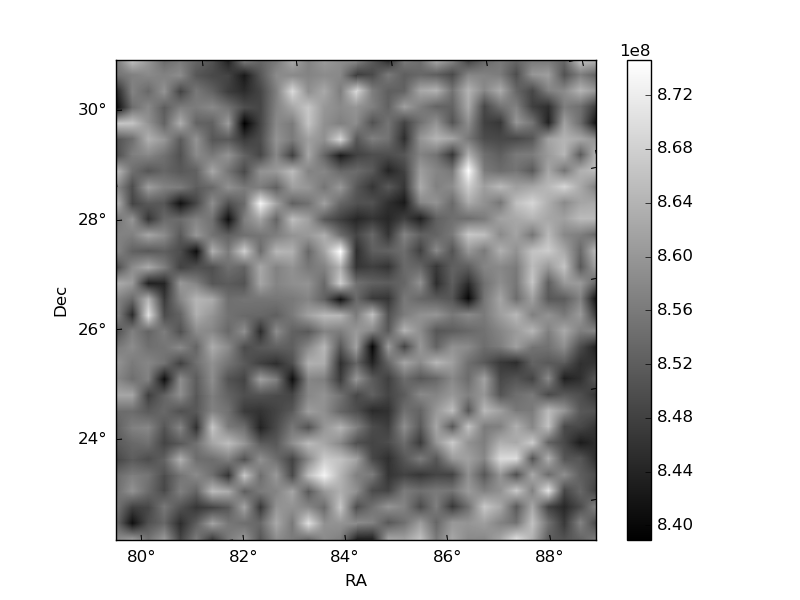
Histogram calculated using DETX and DETY for each event in the final _common_clean file
| Quadrant A | 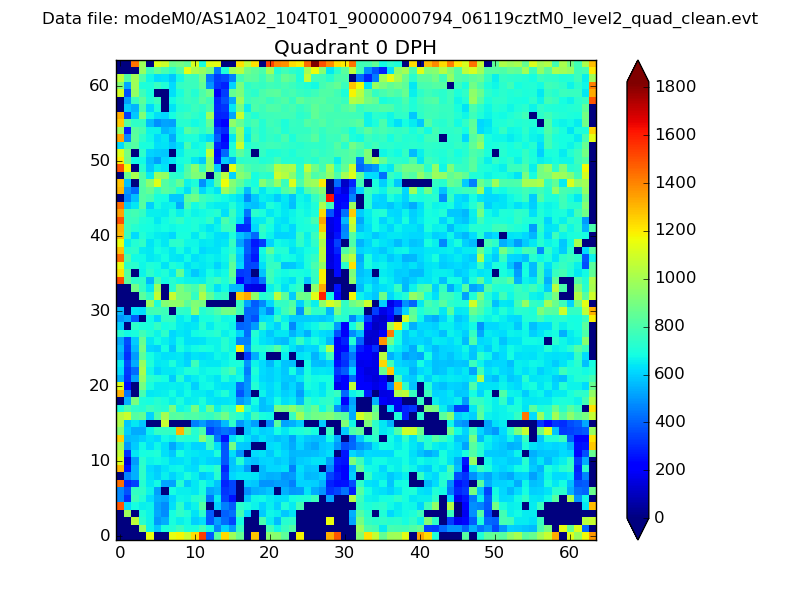 |
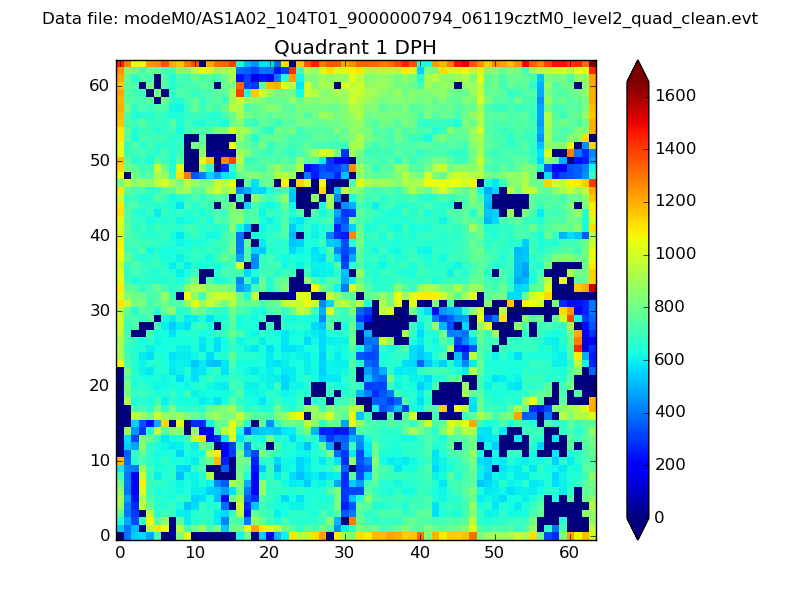 |
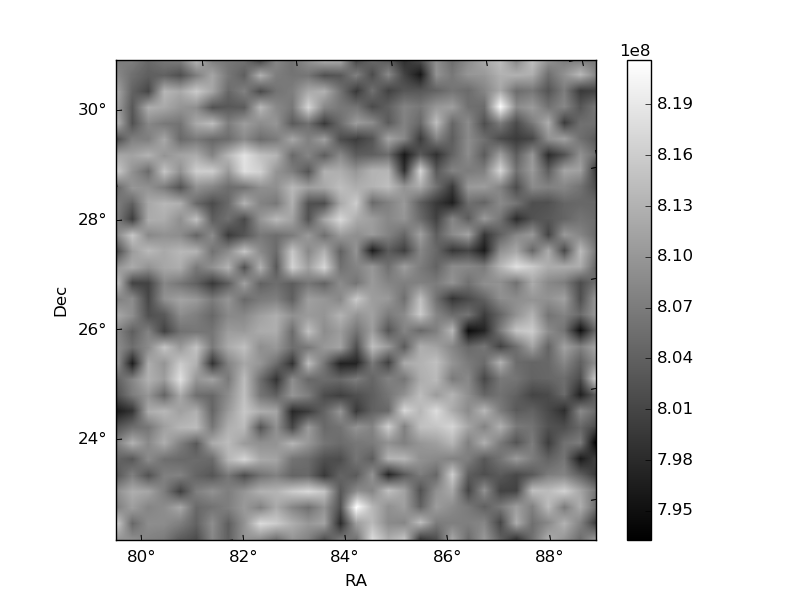
Quadrant B |
|---|---|---|---|
| Quadrant D | 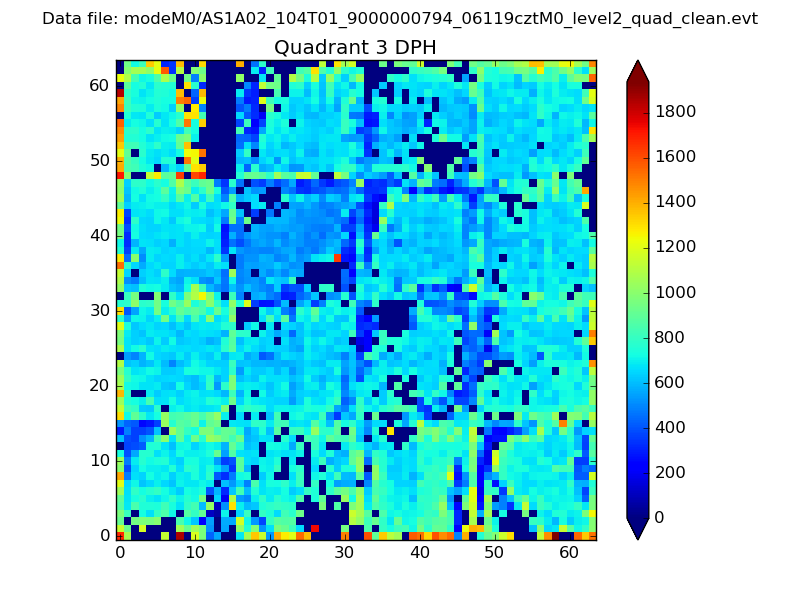 |
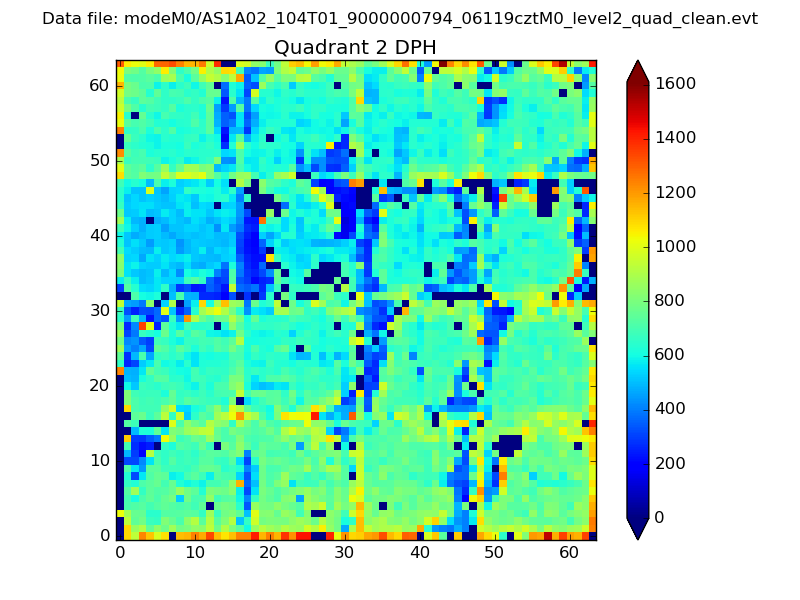 |
Quadrant C |
| Plot type | Count rate plots | Images |
|---|---|---|
| Comparison with Poisson distribution Blue bars denote a histogram of data divided into 1 sec bins. Red curve is a Poisson curve with rate = median count rate of data. |
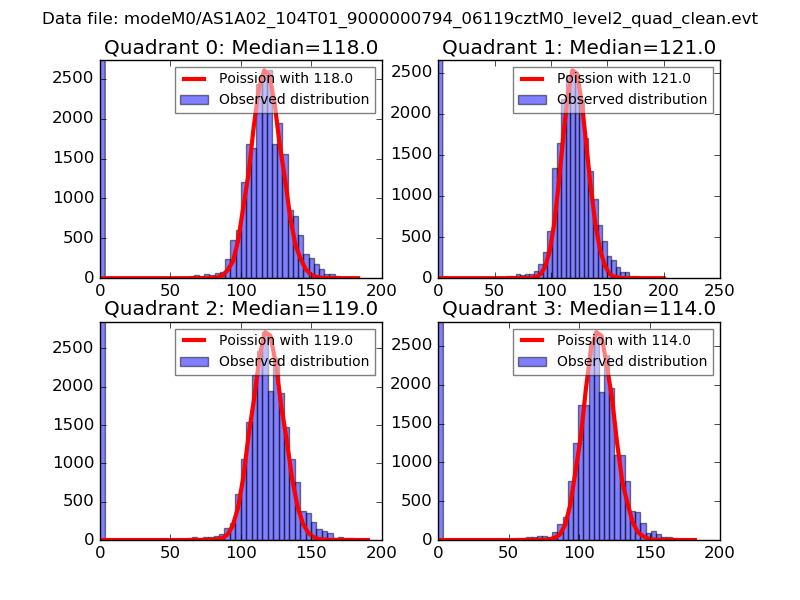 |
 |
| Quadrant-wise count rates Data is divided into 100 sec bins |
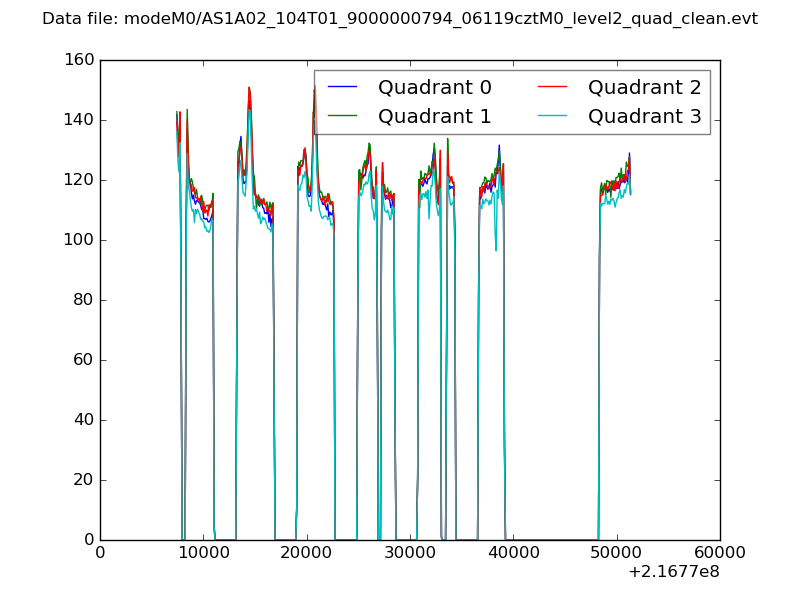 |
|
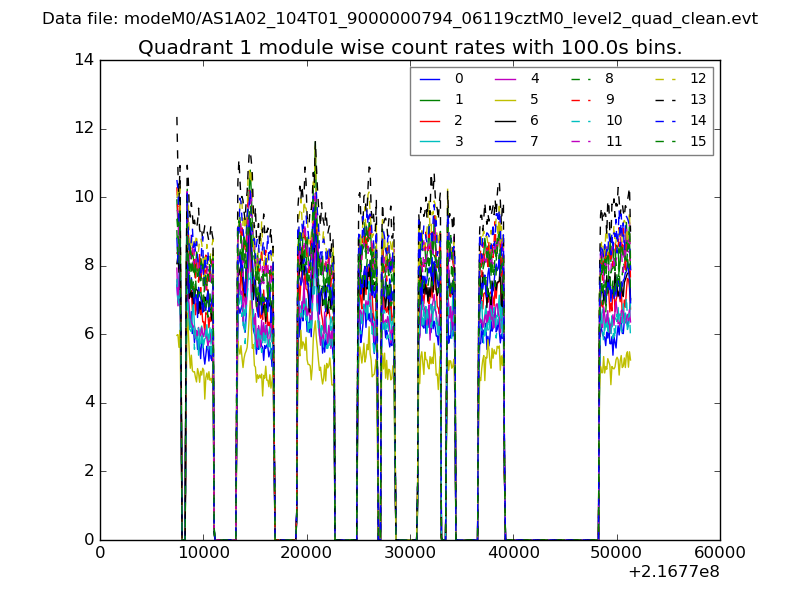
| Module-wise count rates for Quadrant A Data is divided into 100 sec bins |
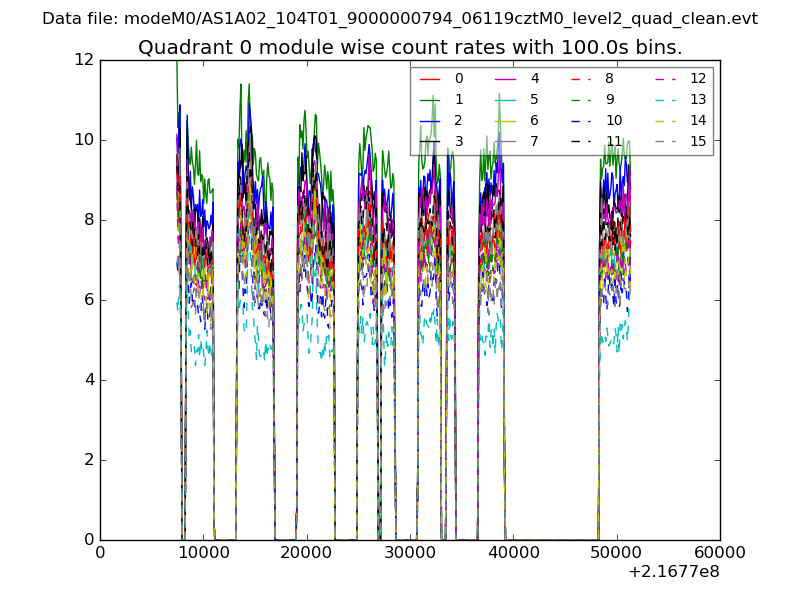 |
 |
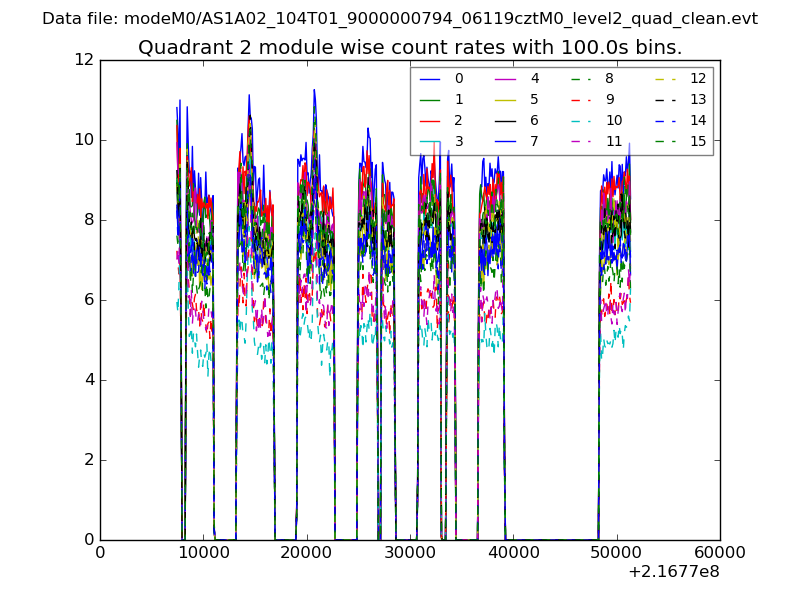
| Module-wise count rates for Quadrant B Data is divided into 100 sec bins |
 |
 |
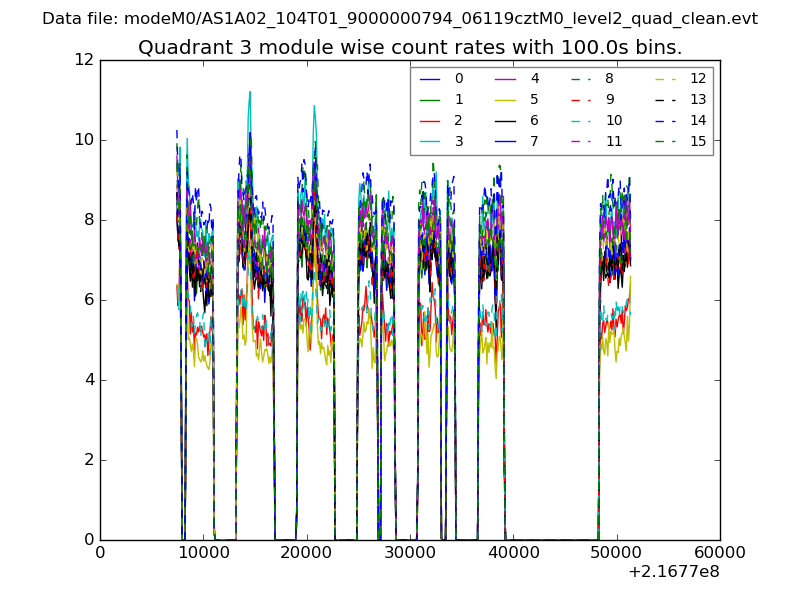
| Module-wise count rates for Quadrant C Data is divided into 100 sec bins |
 |
 |
| Module-wise count rates for Quadrant D Data is divided into 100 sec bins |
 |
 |
| Parameter | Plot |
|---|---|
| CZT HV Monitor | 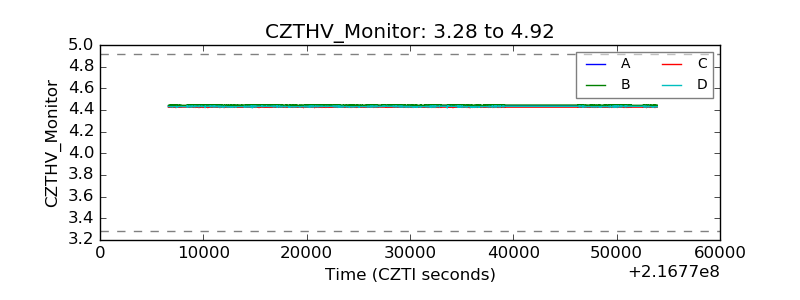 |
| D_VDD | 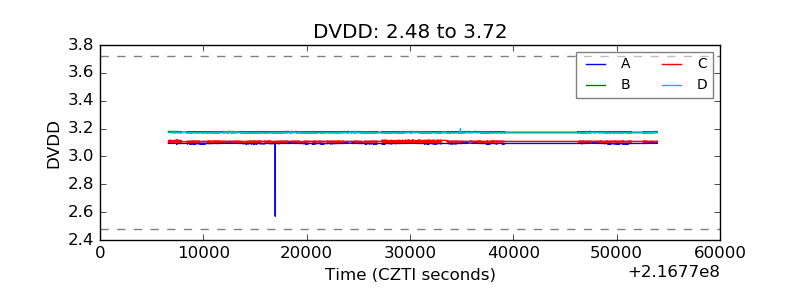 |
| Temperature 1 | 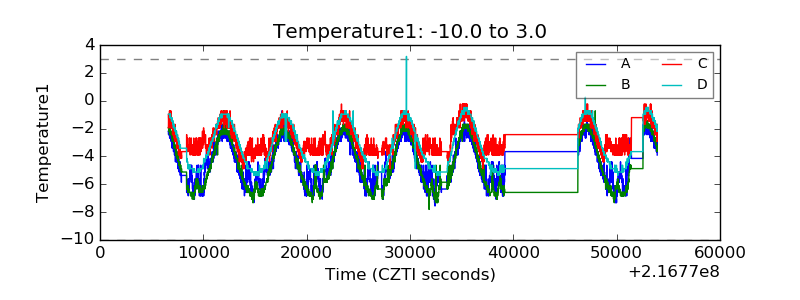 |
| Veto HV Monitor | 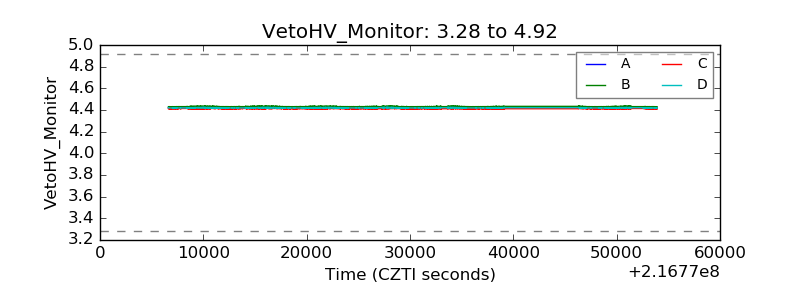 |
| Veto LLD | 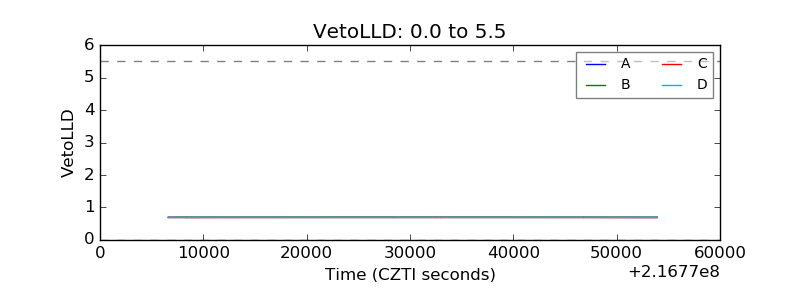 |
| Alpha Counter | 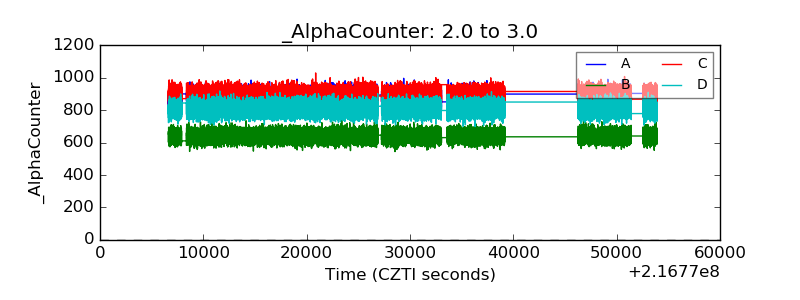 |
| _CPM_Rate | 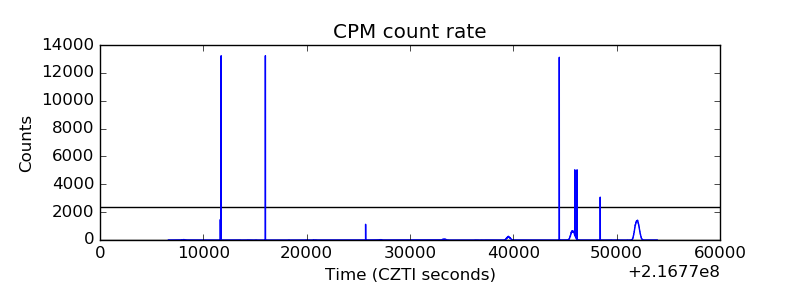 |
| CZT Counter | 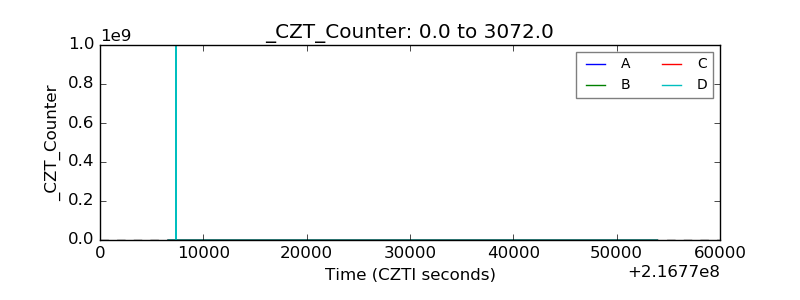 |
| +2.5 Volts monitor |  |
| +5 Volts monitor | 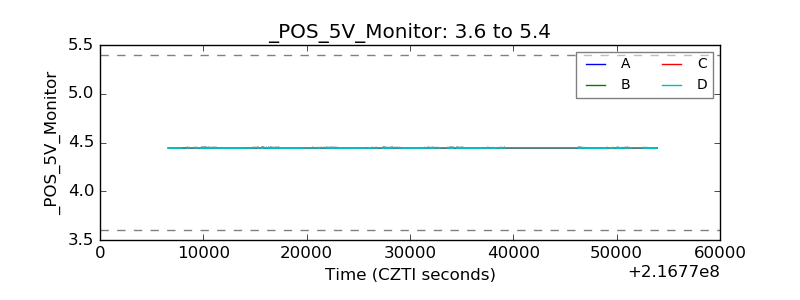 |
| _ROLL_ROT | 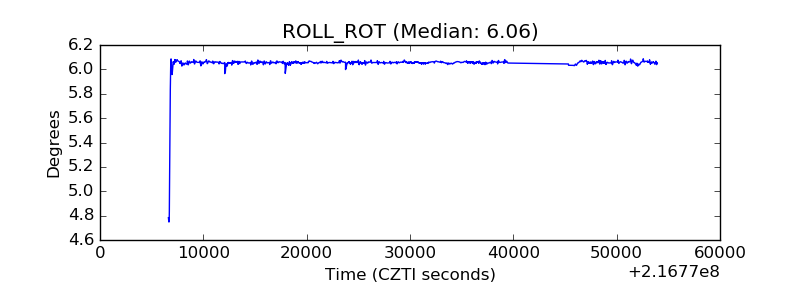 |
| _Roll_DEC | 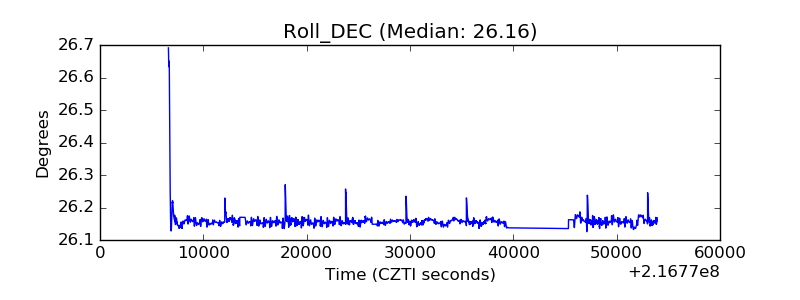 |
| _Roll_RA | 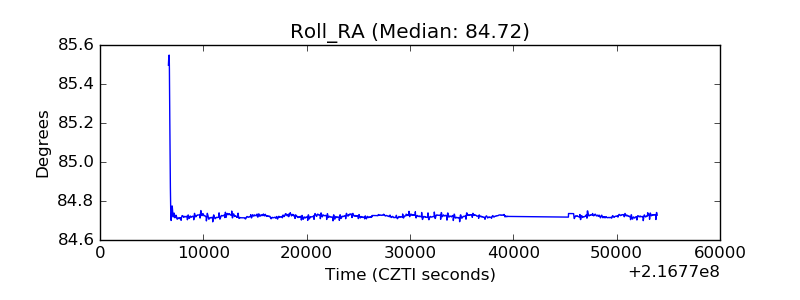 |
| Veto Counter | 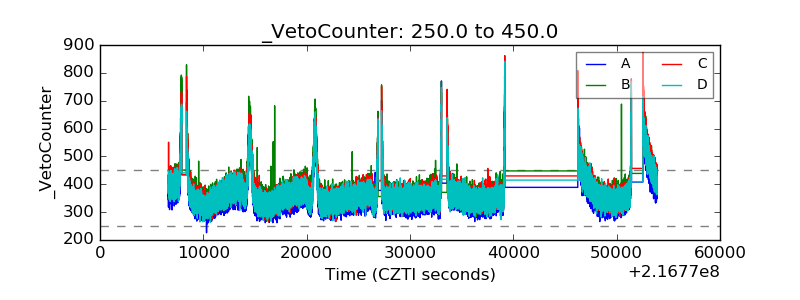 |