| Param | Original file | Final file |
|---|---|---|
| Filename | modeM0/AS1A02_104T01_9000000794_06122cztM0_level2.evt | modeM0/AS1A02_104T01_9000000794_06122cztM0_level2_quad_clean.evt |
| Size (bytes) | 606,271,680 | 90,120,960 |
| Size | 578.2 MB | 85.9 MB |
| Events in quadrant A | 7,630,475 | 547,135 |
| Events in quadrant B | 3,561,940 | 597,590 |
| Events in quadrant C | 3,127,755 | 596,301 |
| Events in quadrant D | 3,623,650 | 557,352 |
| Mode SS | |||
|---|---|---|---|
| Quadrant | BADHDUFLAG | Total packets | Discarded packets |
| A | 0 | 126 | 0 |
| B | 0 | 126 | 0 |
| C | 0 | 126 | 0 |
| D | 0 | 126 | 0 |
| Mode M0 | |||
|---|---|---|---|
| Quadrant | BADHDUFLAG | Total packets | Discarded packets |
| A | 0 | 26954 | 3 |
| B | 0 | 14655 | 2 |
| C | 0 | 13408 | 2 |
| D | 0 | 14955 | 2 |
| Mode M9 | |||
|---|---|---|---|
| Quadrant | BADHDUFLAG | Total packets | Discarded packets |
| A | 0 | 17 | 0 |
| B | 0 | 17 | 0 |
| C | 0 | 17 | 0 |
| D | 0 | 18 | 0 |
| Quadrant | Total seconds | Saturated seconds | Saturation percentage |
|---|---|---|---|
| A | 6168 | 989 | 16.034371% |
| B | 6168 | 142 | 2.302205% |
| C | 6168 | 48 | 0.778210% |
| D | 6168 | 209 | 3.388457% |
Noise dominated data is calculated using 1-second bins in cleaned event files. If a bin has >2000 counts, and if more than 50% of those come from <1% of pixels, then it is considered to be noise-dominated and hence unusable.
| Quadrant | # 1 sec bins | Bins with >0 counts | Bins with >2000 counts | High rate bins dominated by noise | Noise dominated (total time) | Noise dominated (detector-on time) | Marked lightcurve |
|---|---|---|---|---|---|---|---|
| A | 7498 | 6169 | 602 | 602 | 8.03% | 9.76% | 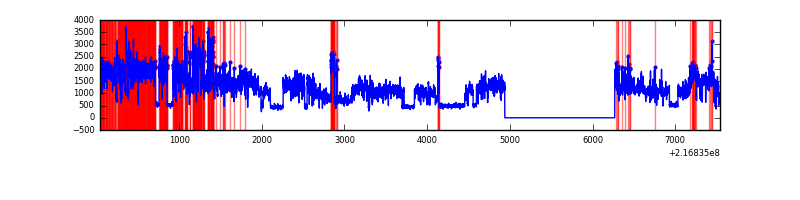 |
| B | 7498 | 6169 | 48 | 48 | 0.64% | 0.78% | 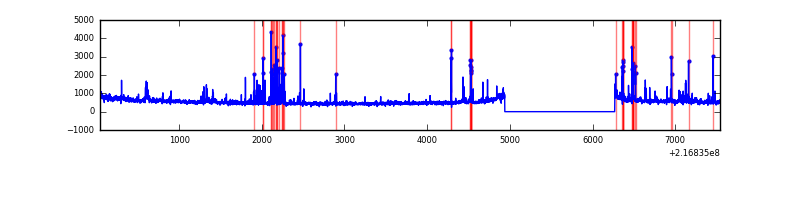 |
| C | 7498 | 6169 | 0 | 0 | 0.00% | 0.00% | 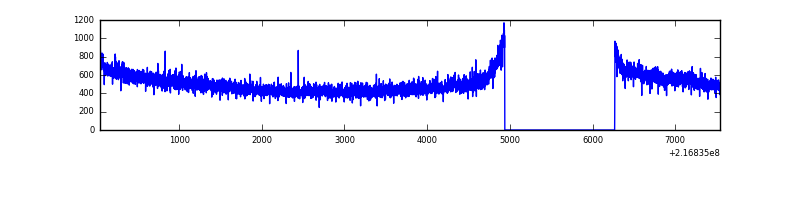 |
| D | 7498 | 6169 | 95 | 95 | 1.27% | 1.54% | 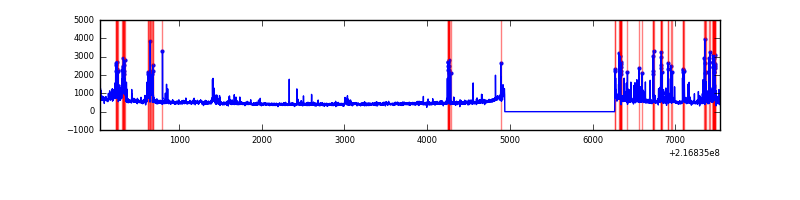 |
Top three noisy pixels from each quadrant. If the there are fewer than three noisy pixels in the level2.evt file, extra rows are filled as -1
| Pixel properties | Quadrant properties | ||||||
|---|---|---|---|---|---|---|---|
| Quadrant | DetID | PixID | Counts | Sigma | Mean | Median | Sigma |
| A | 8 | 15 | 4720744 | 30626.76 | 749 | 735 | 154.1 |
| A | 13 | 251 | 10724 | 64.82 | 749 | 735 | 154.1 |
| A | 0 | 50 | 8411 | 49.81 | 749 | 735 | 154.1 |
| B | 3 | 64 | 351509 | 2281.19 | 795 | 777 | 153.7 |
| B | 15 | 204 | 36053 | 229.44 | 795 | 777 | 153.7 |
| B | 4 | 81 | 34944 | 222.22 | 795 | 777 | 153.7 |
| C | 9 | 68 | 58321 | 317.06 | 780 | 786 | 181.5 |
| C | 9 | 54 | 10667 | 54.45 | 780 | 786 | 181.5 |
| C | 1 | 16 | 10488 | 53.47 | 780 | 786 | 181.5 |
| D | 13 | 169 | 300465 | 1587.24 | 764 | 740 | 188.8 |
| D | 2 | 33 | 269946 | 1425.62 | 764 | 740 | 188.8 |
| D | 8 | 195 | 35380 | 183.44 | 764 | 740 | 188.8 |
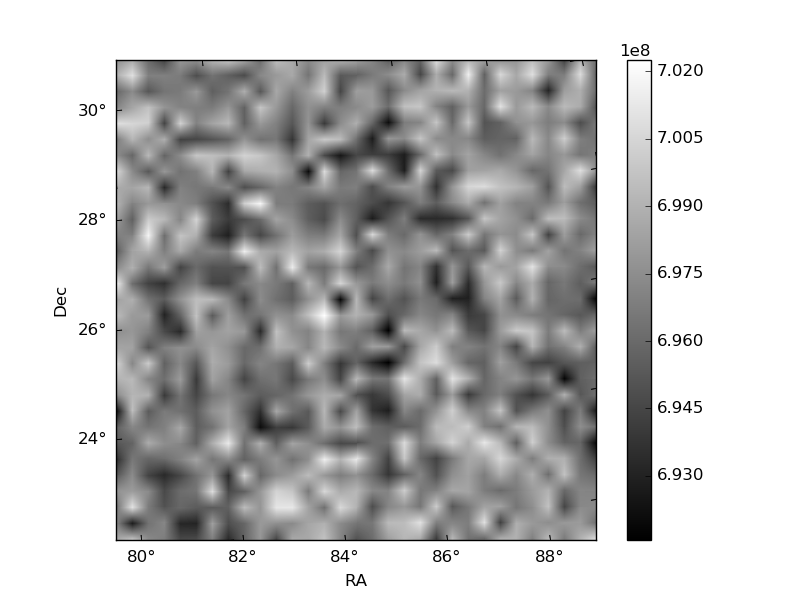
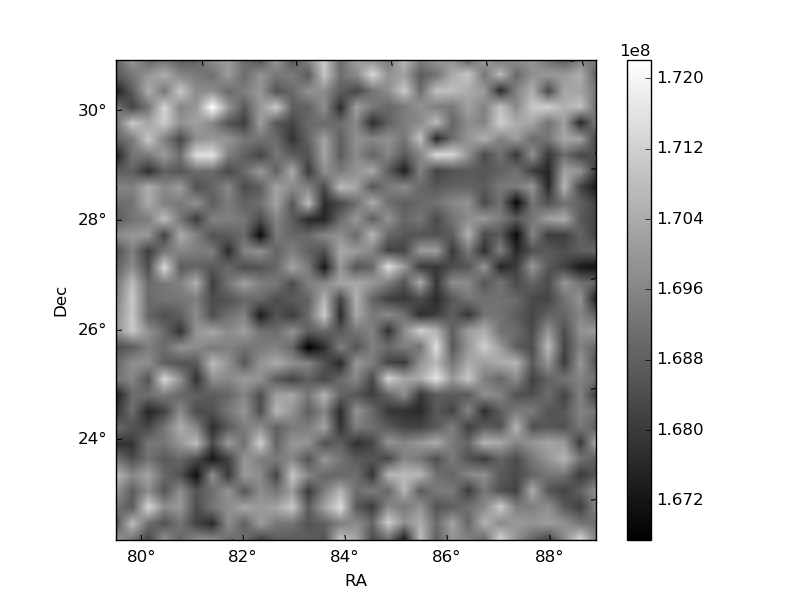
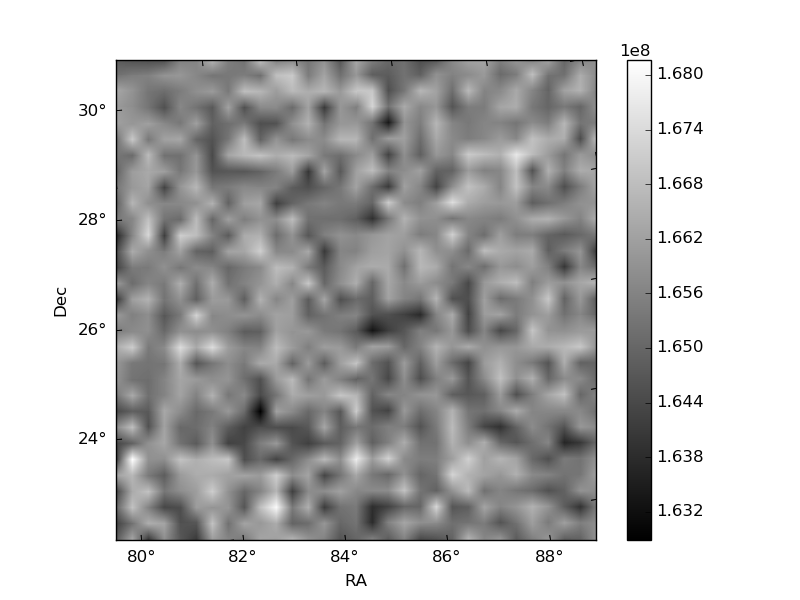
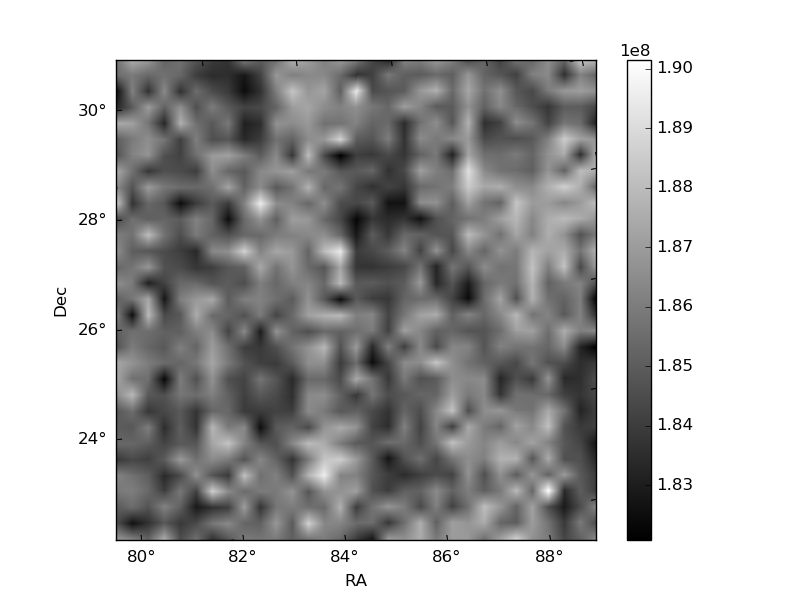
Histogram calculated using DETX and DETY for each event in the final _common_clean file
| Quadrant A | 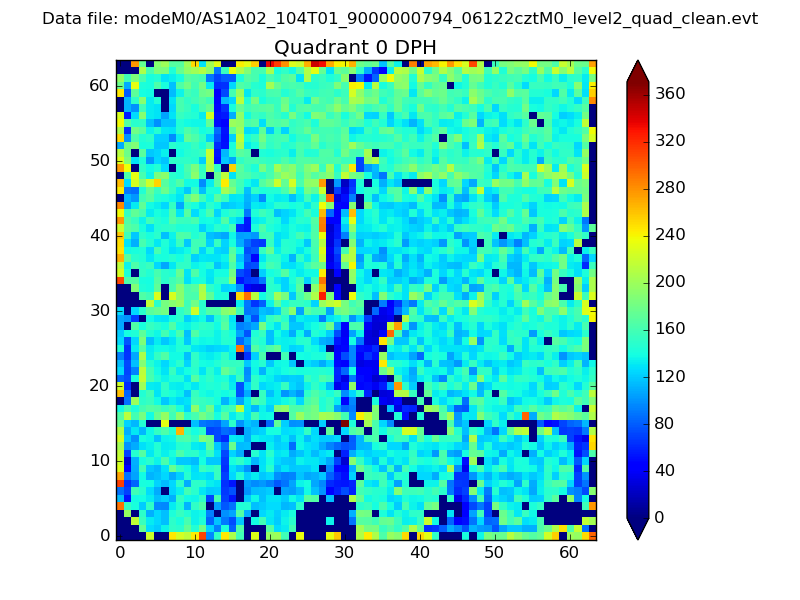 |
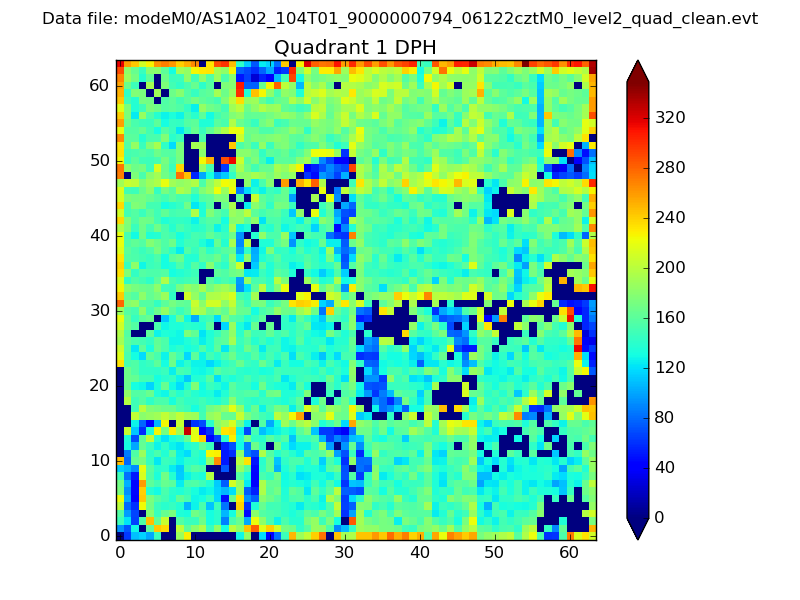 |
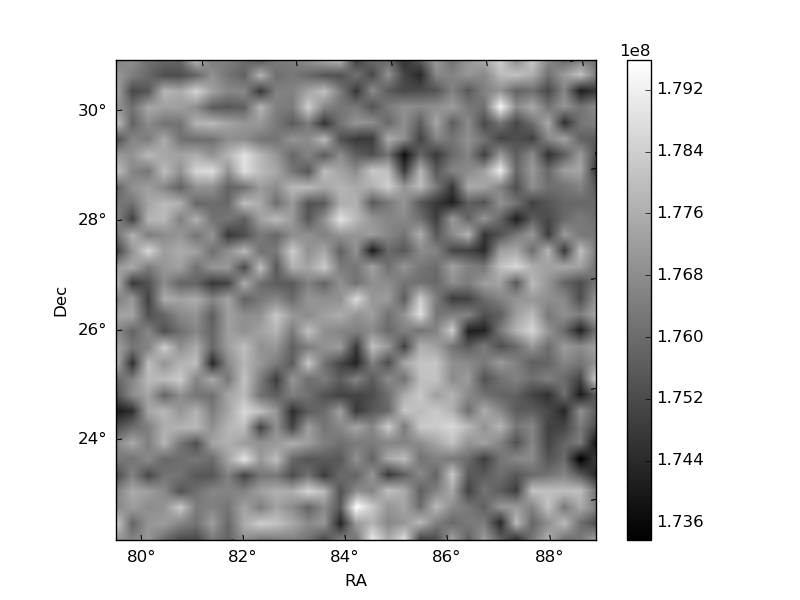
Quadrant B |
|---|---|---|---|
| Quadrant D | 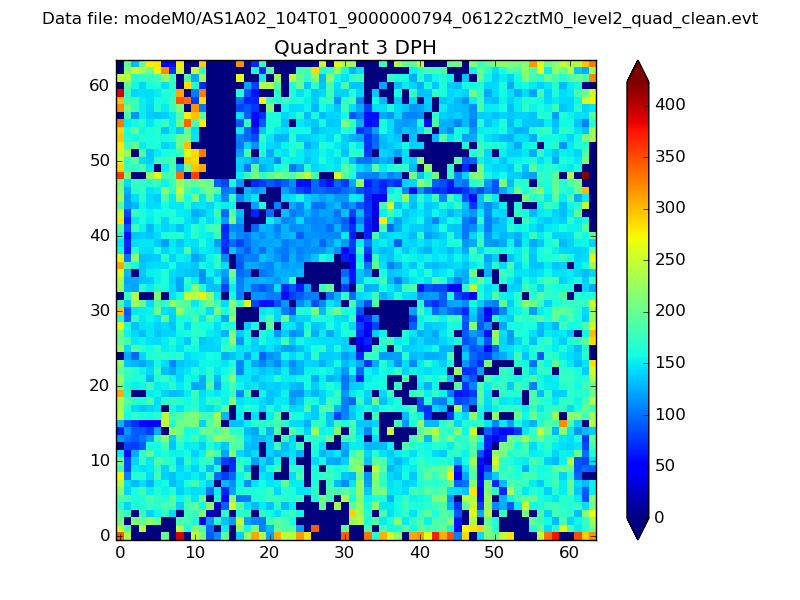 |
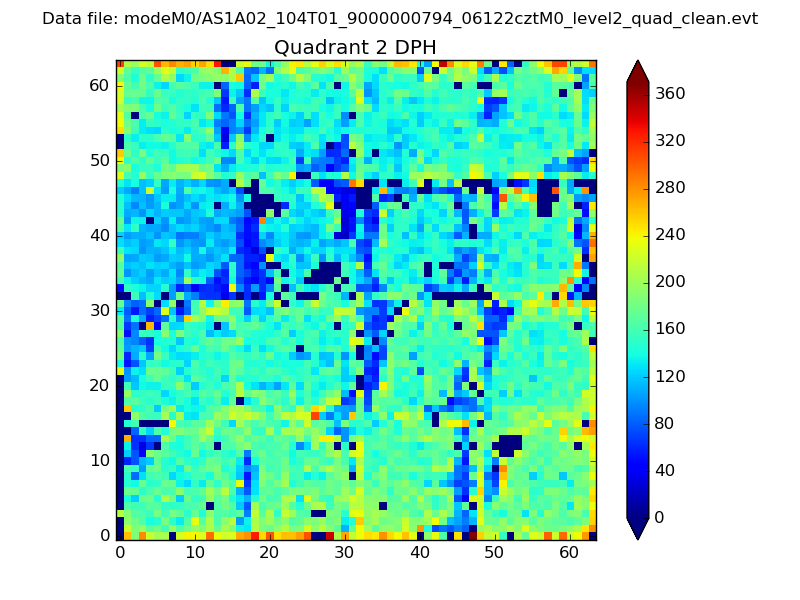 |
Quadrant C |
| Plot type | Count rate plots | Images |
|---|---|---|
| Comparison with Poisson distribution Blue bars denote a histogram of data divided into 1 sec bins. Red curve is a Poisson curve with rate = median count rate of data. |
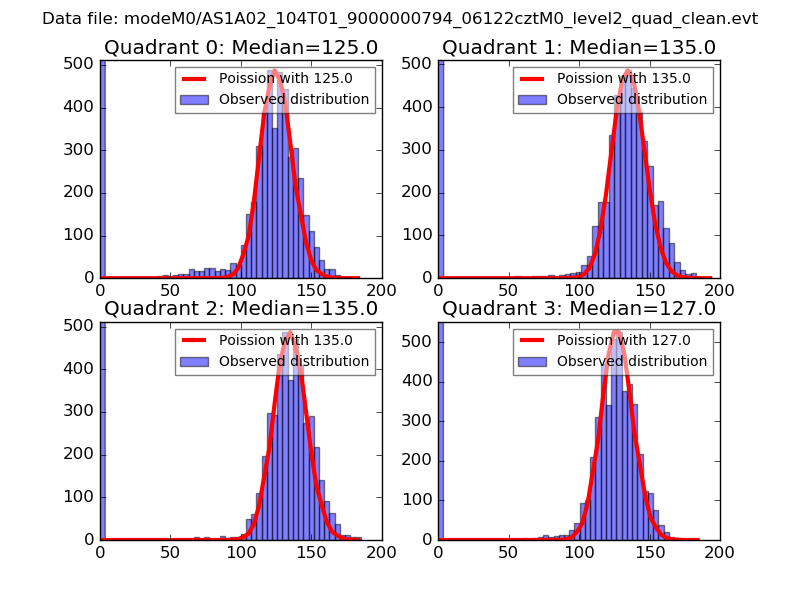 |
 |
| Quadrant-wise count rates Data is divided into 100 sec bins |
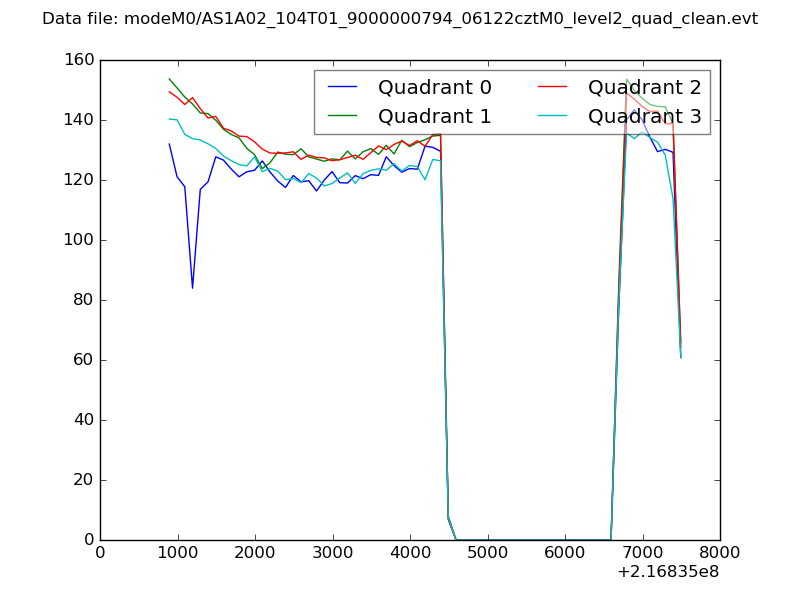 |
|
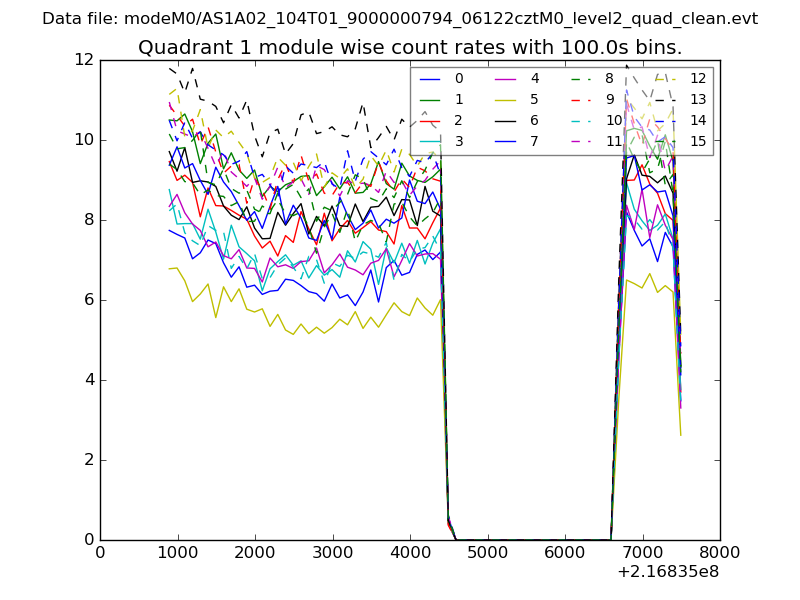
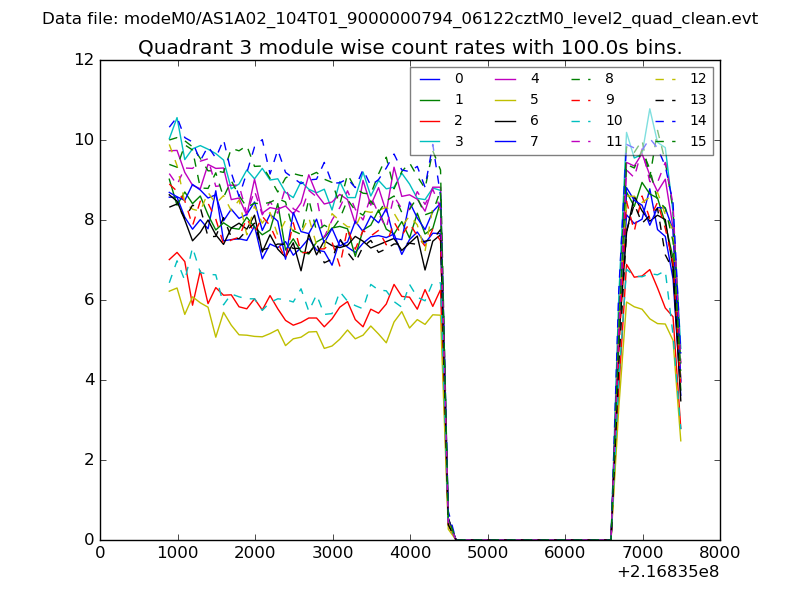
| Module-wise count rates for Quadrant A Data is divided into 100 sec bins |
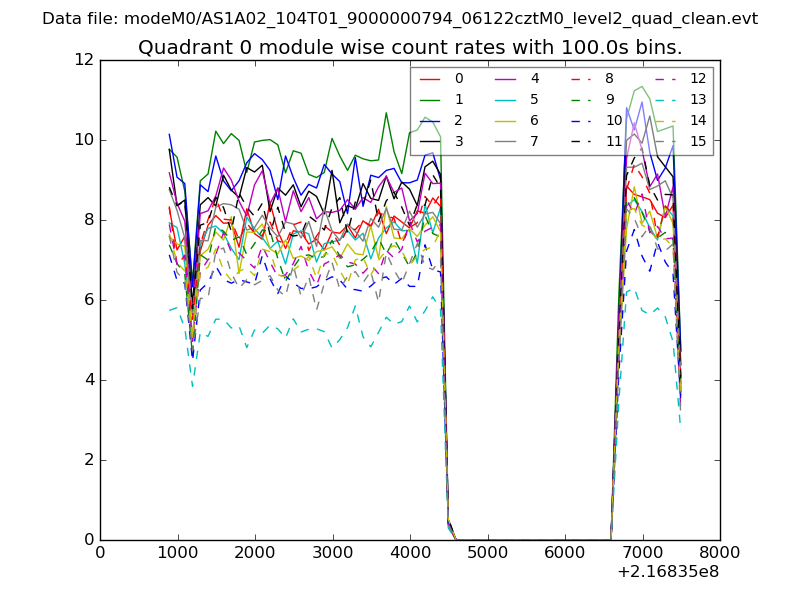 |
 |
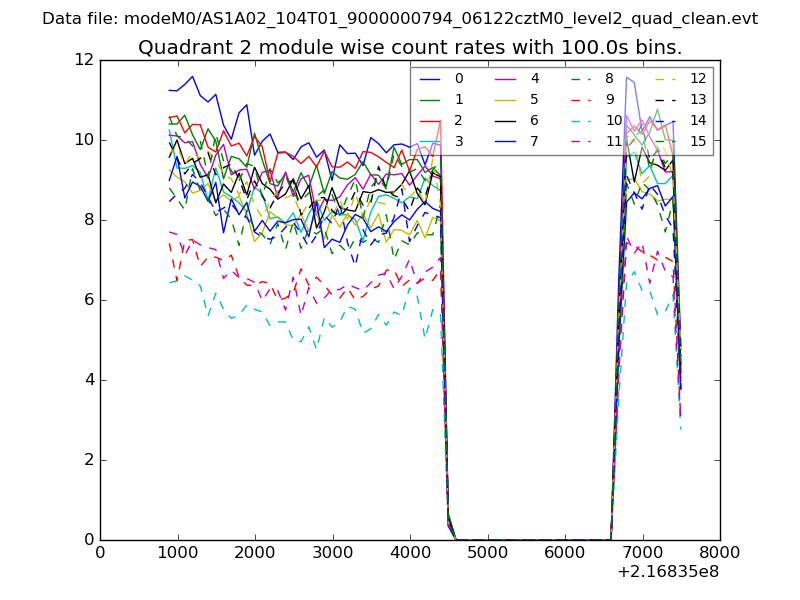
| Module-wise count rates for Quadrant B Data is divided into 100 sec bins |
 |
 |
| Module-wise count rates for Quadrant C Data is divided into 100 sec bins |
 |
 |
| Module-wise count rates for Quadrant D Data is divided into 100 sec bins |
 |
 |
| Parameter | Plot |
|---|---|
| CZT HV Monitor | 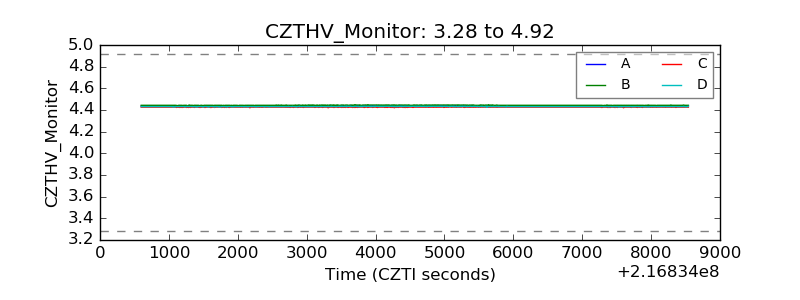 |
| D_VDD | 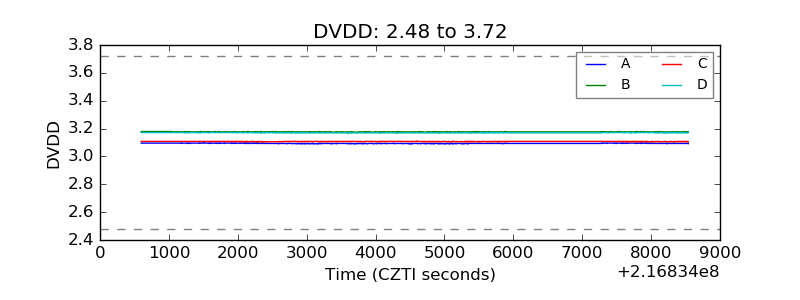 |
| Temperature 1 | 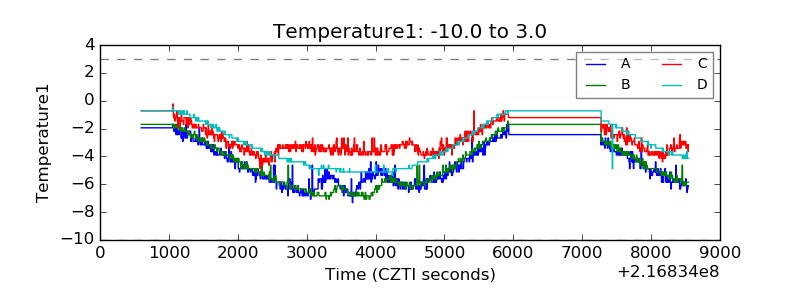 |
| Veto HV Monitor | 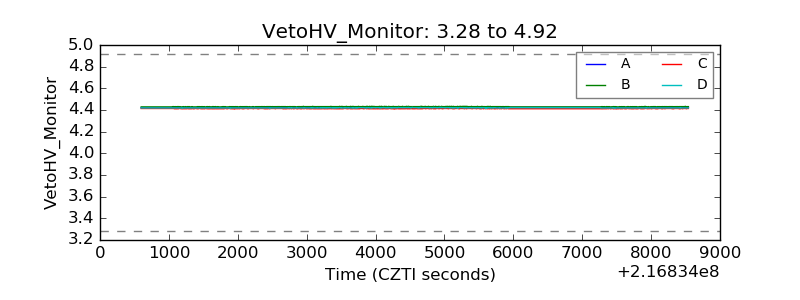 |
| Veto LLD | 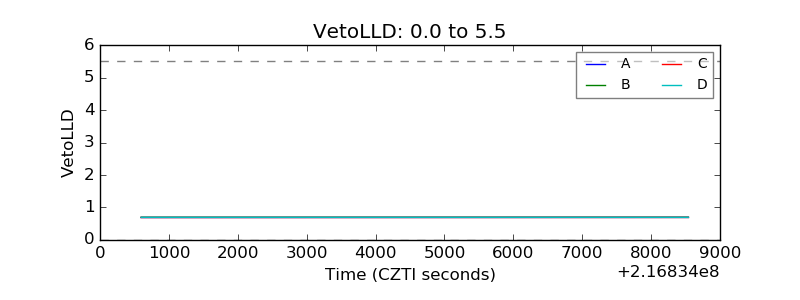 |
| Alpha Counter | 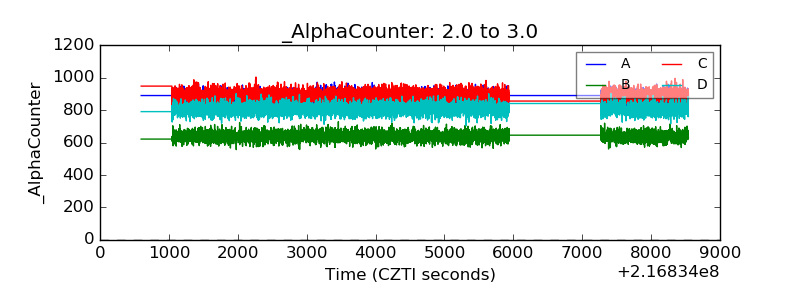 |
| _CPM_Rate | 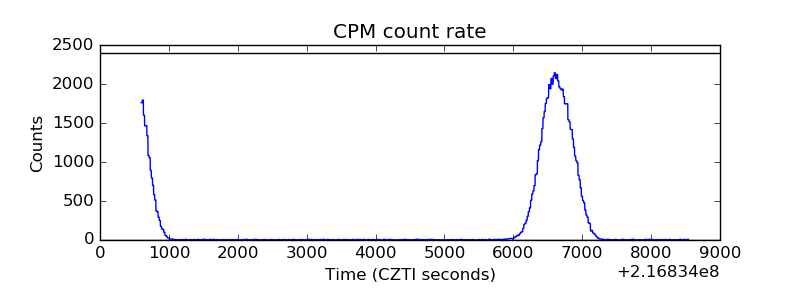 |
| CZT Counter | 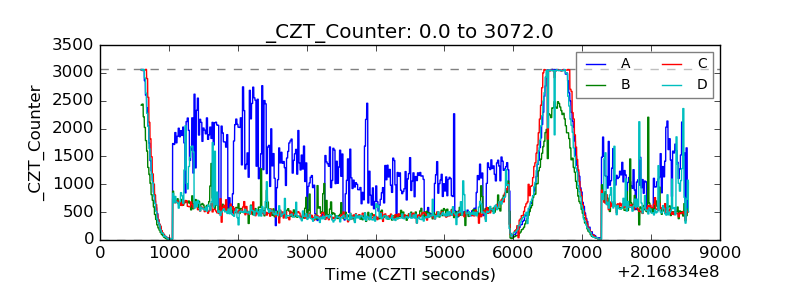 |
| +2.5 Volts monitor |  |
| +5 Volts monitor | 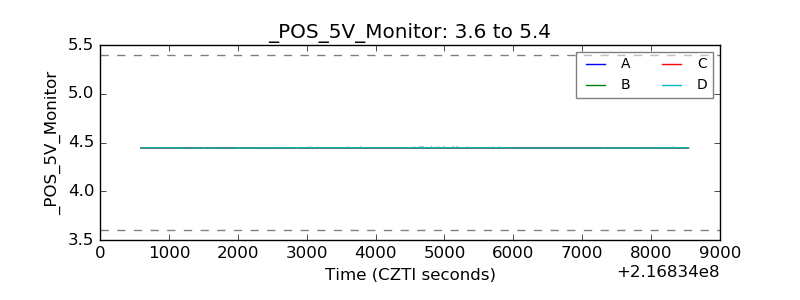 |
| _ROLL_ROT | 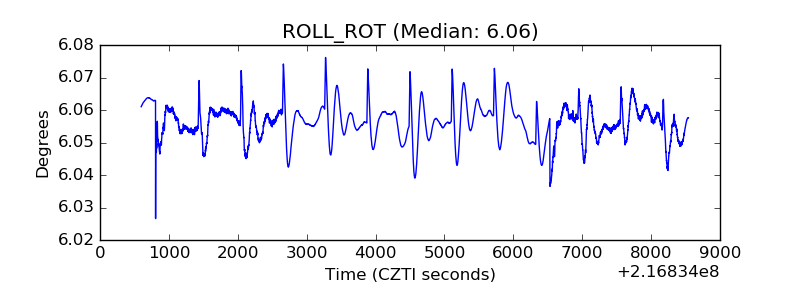 |
| _Roll_DEC | 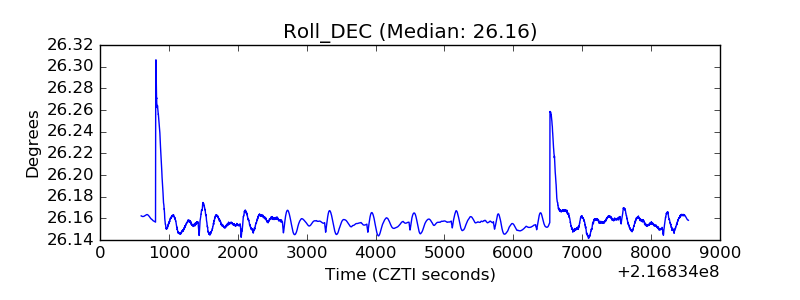 |
| _Roll_RA | 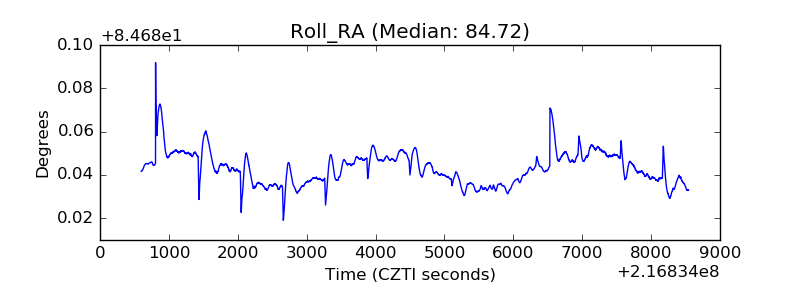 |
| Veto Counter | 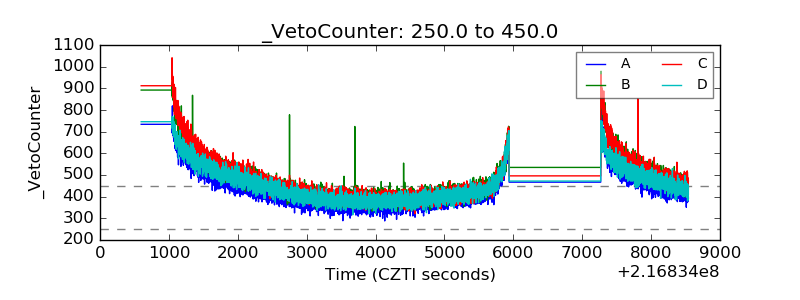 |