| Param | Original file | Final file |
|---|---|---|
| Filename | modeM0/AS1A02_104T01_9000000794_06123cztM0_level2.evt | modeM0/AS1A02_104T01_9000000794_06123cztM0_level2_quad_clean.evt |
| Size (bytes) | 683,167,680 | 95,581,440 |
| Size | 651.5 MB | 91.2 MB |
| Events in quadrant A | 9,487,534 | 568,673 |
| Events in quadrant B | 3,669,254 | 640,346 |
| Events in quadrant C | 3,331,152 | 632,443 |
| Events in quadrant D | 3,754,041 | 590,905 |
| Mode SS | |||
|---|---|---|---|
| Quadrant | BADHDUFLAG | Total packets | Discarded packets |
| A | 0 | 138 | 0 |
| B | 0 | 138 | 0 |
| C | 0 | 138 | 0 |
| D | 0 | 138 | 0 |
| Mode M0 | |||
|---|---|---|---|
| Quadrant | BADHDUFLAG | Total packets | Discarded packets |
| A | 0 | 32805 | 10 |
| B | 0 | 15275 | 2 |
| C | 0 | 14287 | 4 |
| D | 0 | 15783 | 2 |
| Mode M9 | |||
|---|---|---|---|
| Quadrant | BADHDUFLAG | Total packets | Discarded packets |
| A | 0 | 26 | 0 |
| B | 0 | 26 | 0 |
| C | 0 | 26 | 0 |
| D | 0 | 26 | 0 |
| Quadrant | Total seconds | Saturated seconds | Saturation percentage |
|---|---|---|---|
| A | 6617 | 1693 | 25.585613% |
| B | 6618 | 181 | 2.734965% |
| C | 6617 | 65 | 0.982318% |
| D | 6618 | 196 | 2.961620% |
Noise dominated data is calculated using 1-second bins in cleaned event files. If a bin has >2000 counts, and if more than 50% of those come from <1% of pixels, then it is considered to be noise-dominated and hence unusable.
| Quadrant | # 1 sec bins | Bins with >0 counts | Bins with >2000 counts | High rate bins dominated by noise | Noise dominated (total time) | Noise dominated (detector-on time) | Marked lightcurve |
|---|---|---|---|---|---|---|---|
| A | 9263 | 6619 | 1218 | 1218 | 13.15% | 18.40% | 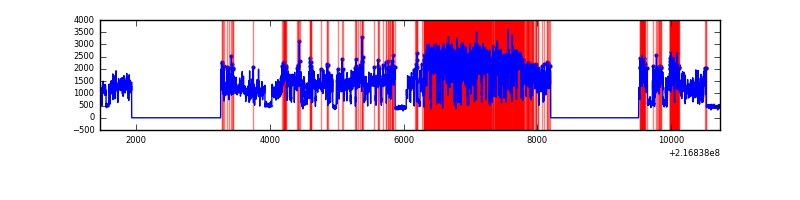 |
| B | 9263 | 6620 | 48 | 48 | 0.52% | 0.73% | 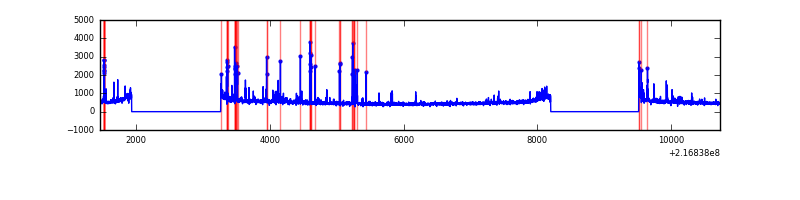 |
| C | 9263 | 6620 | 0 | 0 | 0.00% | 0.00% | 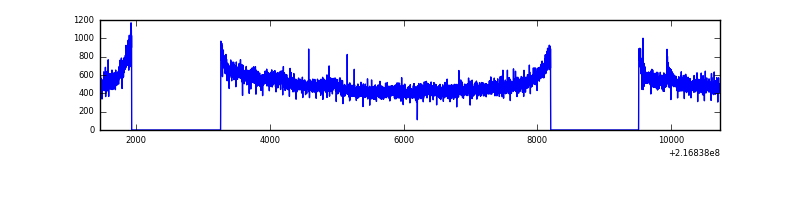 |
| D | 9263 | 6620 | 107 | 107 | 1.16% | 1.62% | 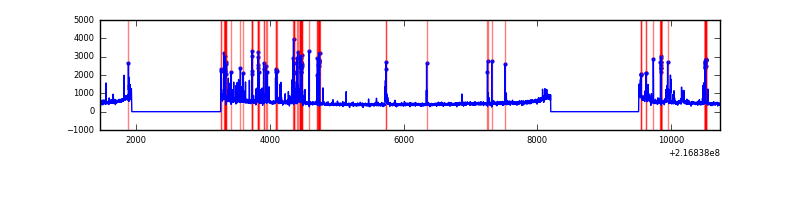 |
Top three noisy pixels from each quadrant. If the there are fewer than three noisy pixels in the level2.evt file, extra rows are filled as -1
| Pixel properties | Quadrant properties | ||||||
|---|---|---|---|---|---|---|---|
| Quadrant | DetID | PixID | Counts | Sigma | Mean | Median | Sigma |
| A | 8 | 15 | 6454549 | 39786.35 | 782 | 765 | 162.2 |
| A | 3 | 1 | 9830 | 55.88 | 782 | 765 | 162.2 |
| A | 0 | 226 | 7580 | 42.01 | 782 | 765 | 162.2 |
| B | 3 | 64 | 292153 | 1784.93 | 843 | 822 | 163.2 |
| B | 4 | 48 | 33572 | 200.65 | 843 | 822 | 163.2 |
| B | 4 | 81 | 19870 | 116.7 | 843 | 822 | 163.2 |
| C | 9 | 68 | 99348 | 510.94 | 822 | 826 | 192.8 |
| C | 9 | 54 | 6741 | 30.68 | 822 | 826 | 192.8 |
| C | 13 | 61 | 6504 | 29.45 | 822 | 826 | 192.8 |
| D | 13 | 169 | 286504 | 1436.45 | 806 | 780 | 198.9 |
| D | 2 | 14 | 93141 | 464.34 | 806 | 780 | 198.9 |
| D | 2 | 33 | 77310 | 384.75 | 806 | 780 | 198.9 |
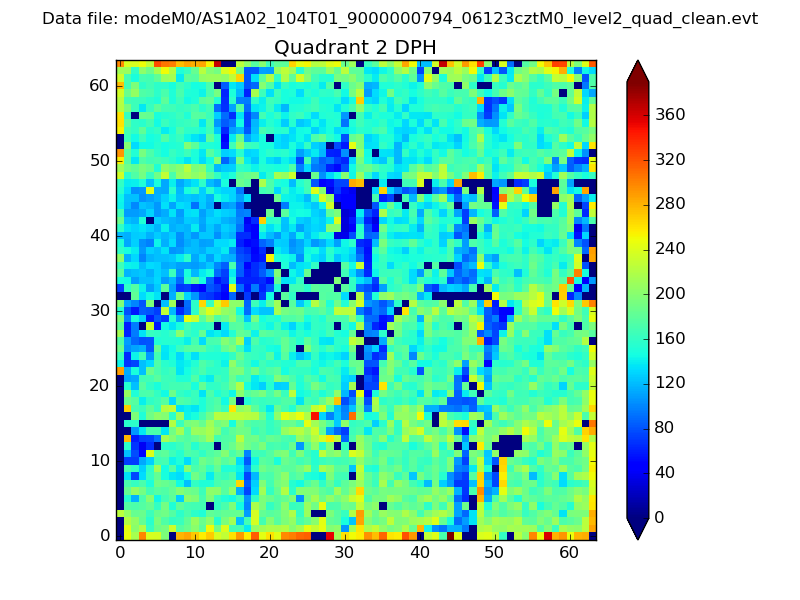
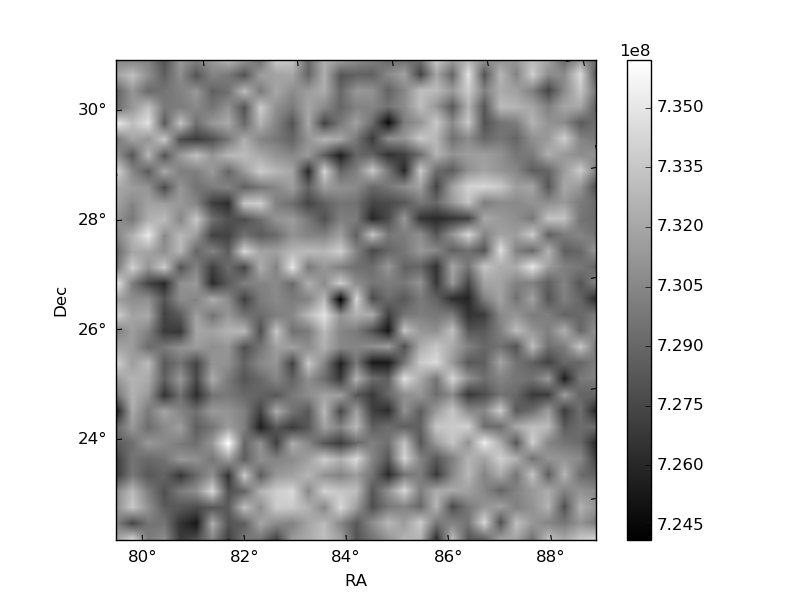
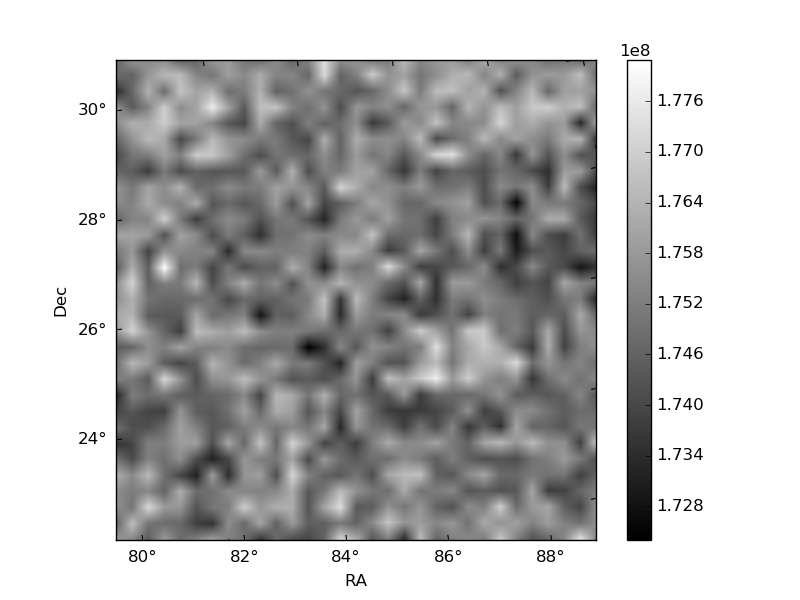
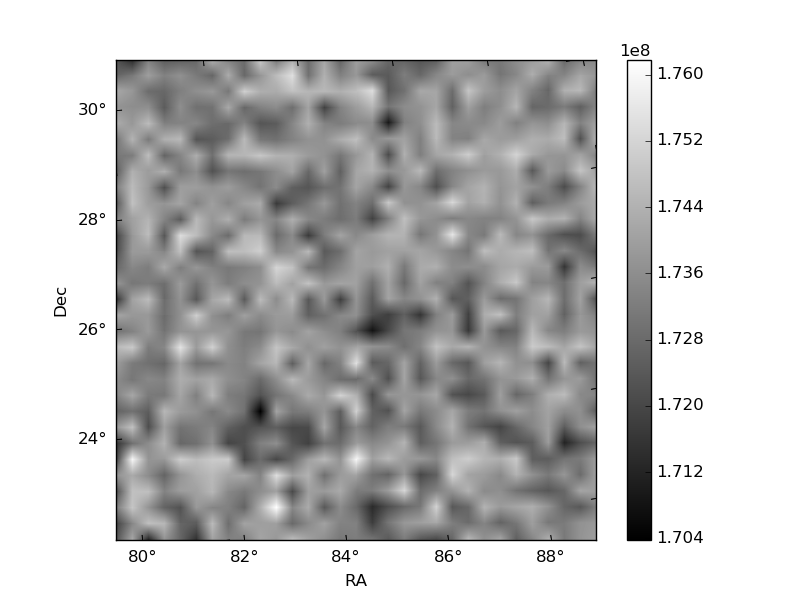
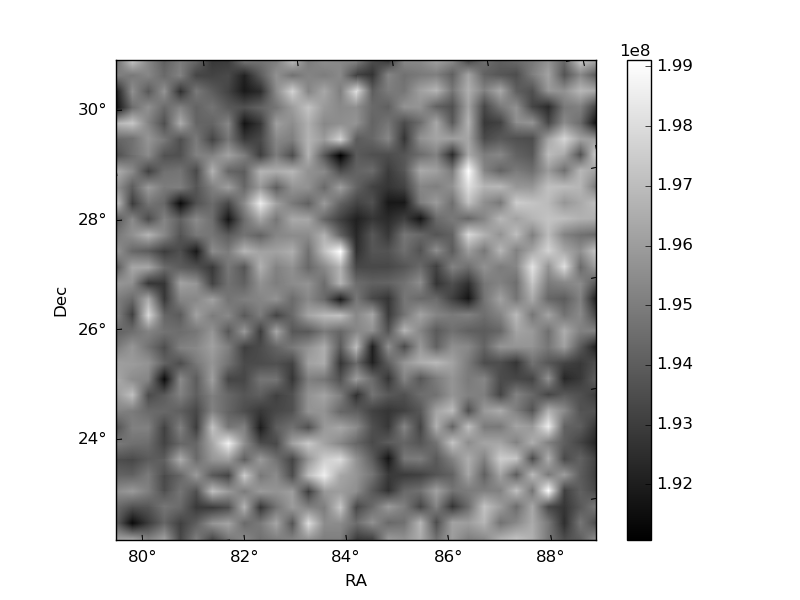
Histogram calculated using DETX and DETY for each event in the final _common_clean file
| Quadrant A | 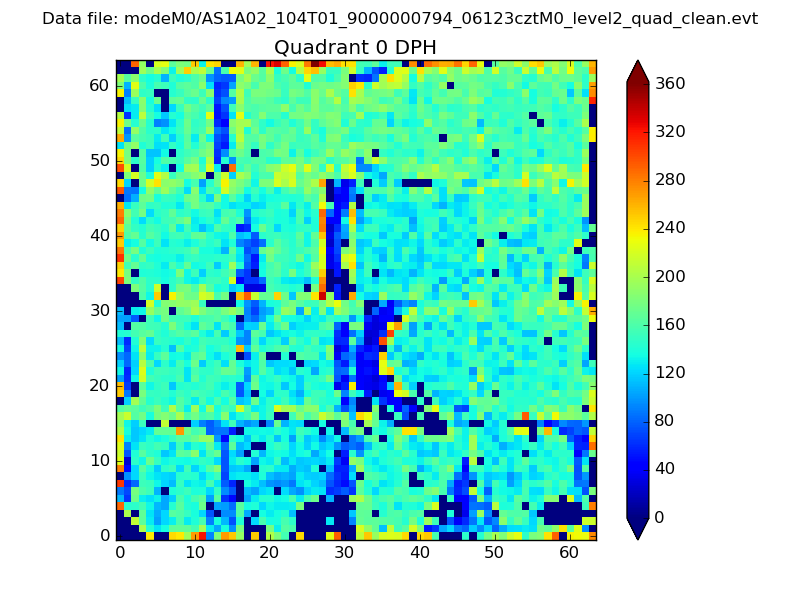 |
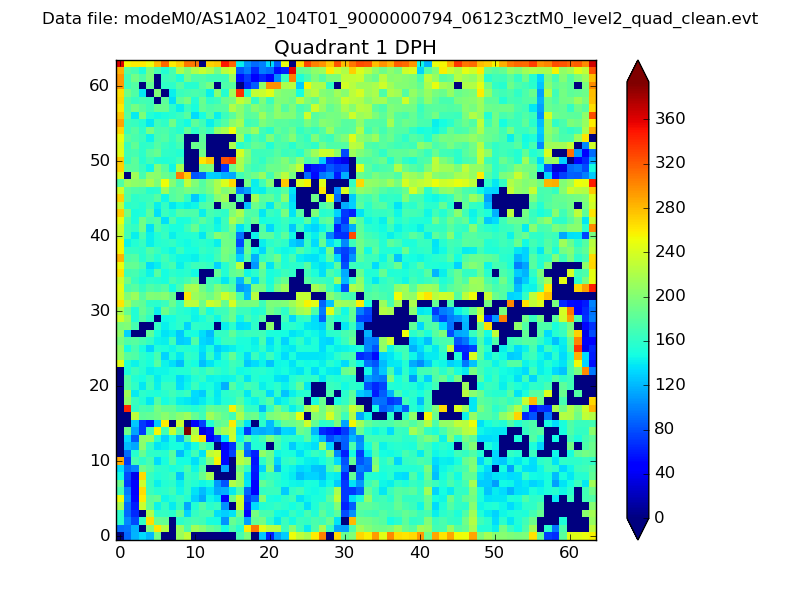 |
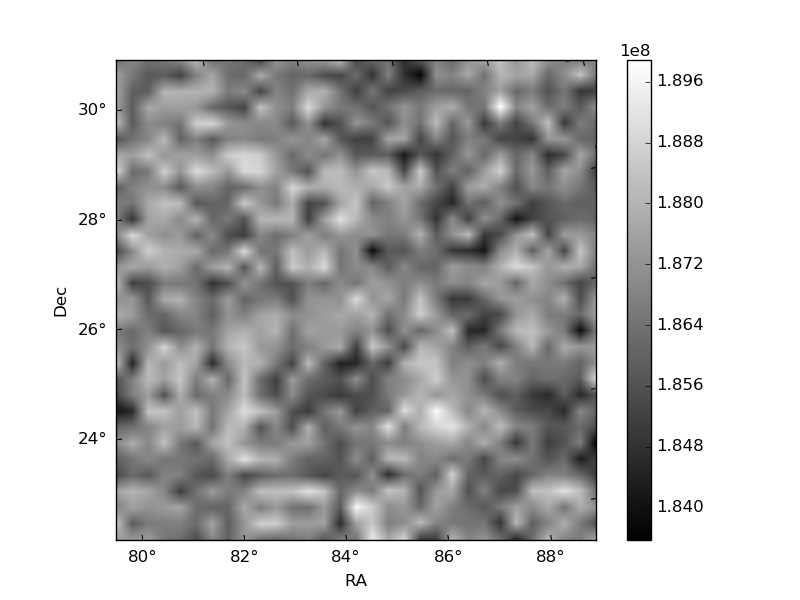
Quadrant B |
|---|---|---|---|
| Quadrant D | 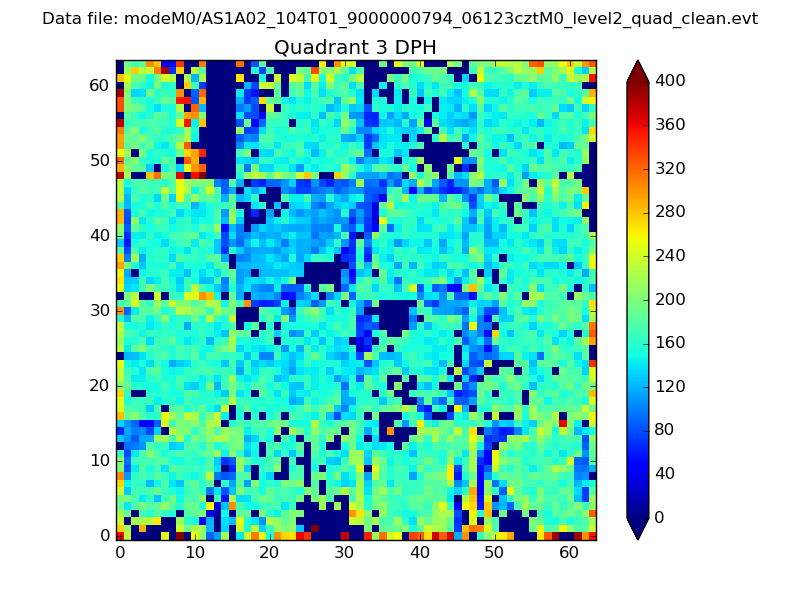 |
 |
Quadrant C |
| Plot type | Count rate plots | Images |
|---|---|---|
| Comparison with Poisson distribution Blue bars denote a histogram of data divided into 1 sec bins. Red curve is a Poisson curve with rate = median count rate of data. |
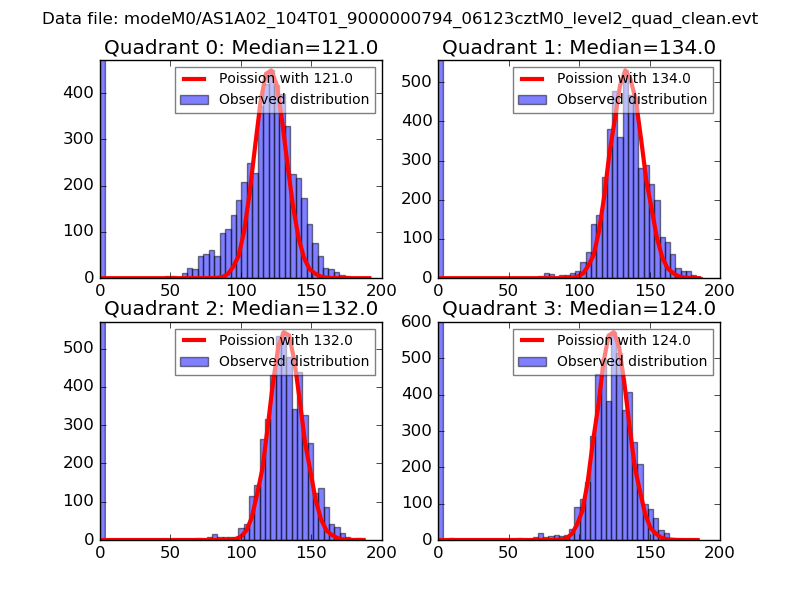 |
 |
| Quadrant-wise count rates Data is divided into 100 sec bins |
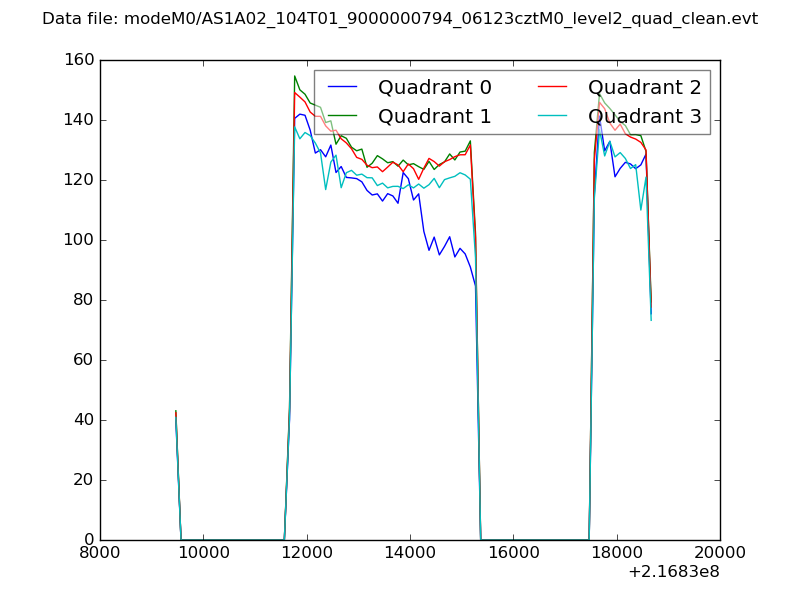 |
|
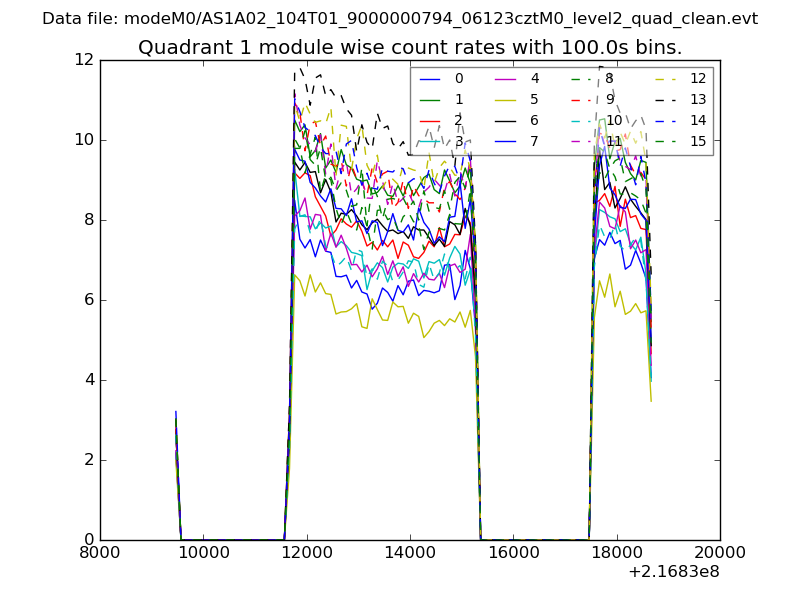
| Module-wise count rates for Quadrant A Data is divided into 100 sec bins |
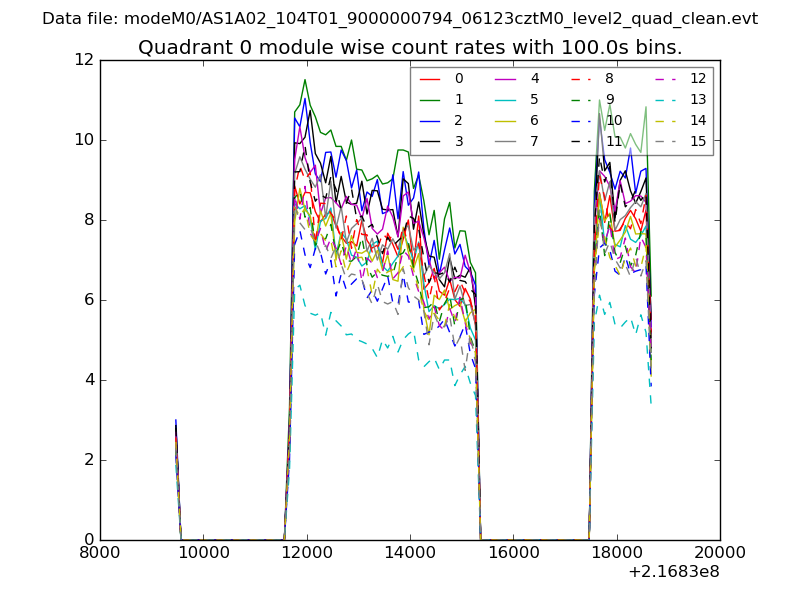 |
 |
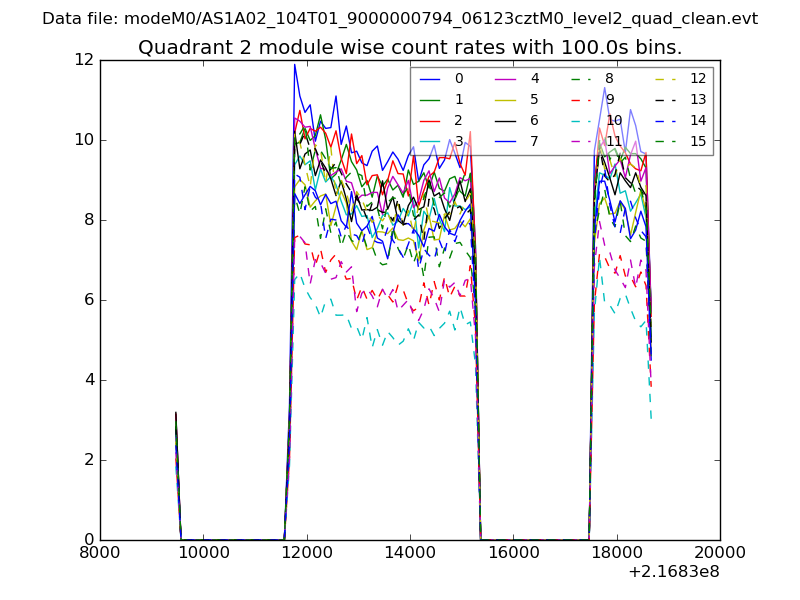
| Module-wise count rates for Quadrant B Data is divided into 100 sec bins |
 |
 |
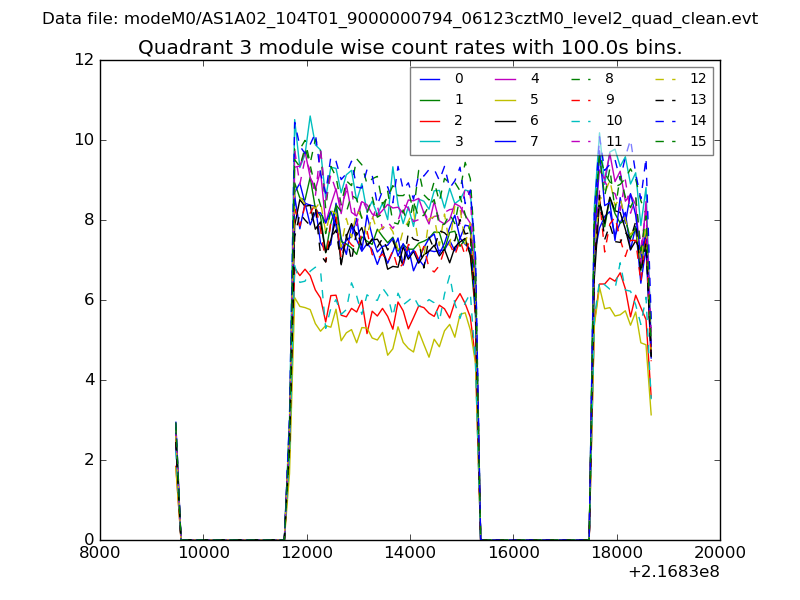
| Module-wise count rates for Quadrant C Data is divided into 100 sec bins |
 |
 |
| Module-wise count rates for Quadrant D Data is divided into 100 sec bins |
 |
 |
| Parameter | Plot |
|---|---|
| CZT HV Monitor | 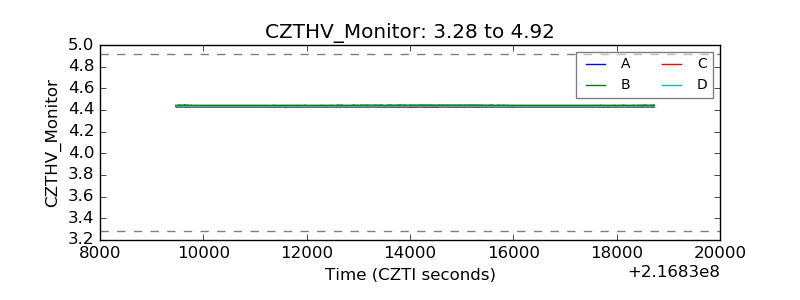 |
| D_VDD | 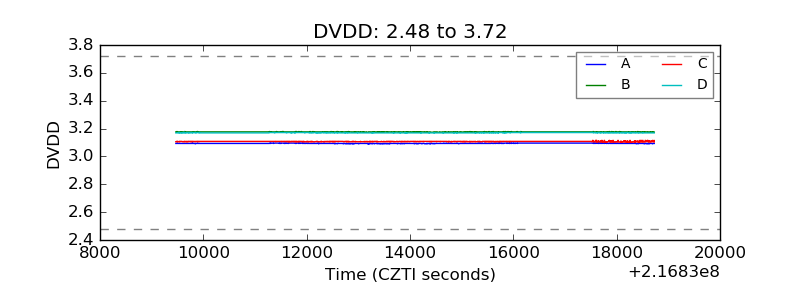 |
| Temperature 1 | 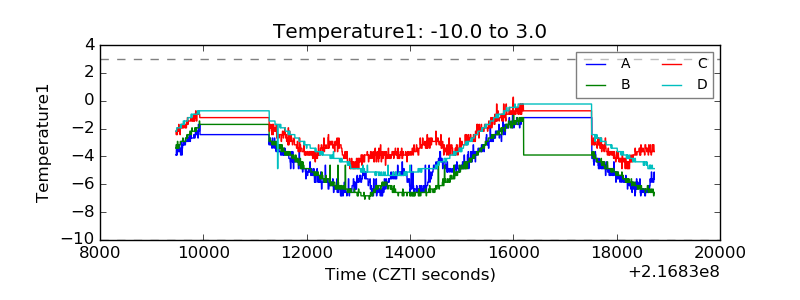 |
| Veto HV Monitor | 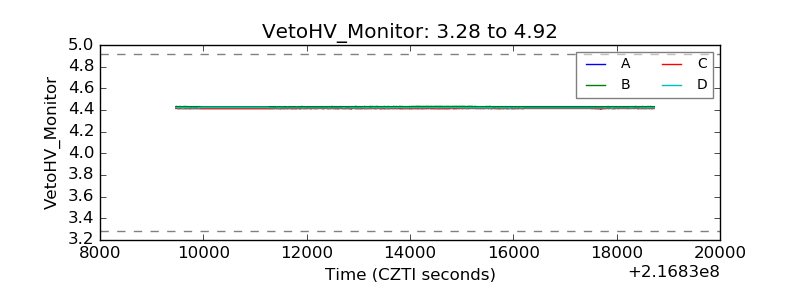 |
| Veto LLD | 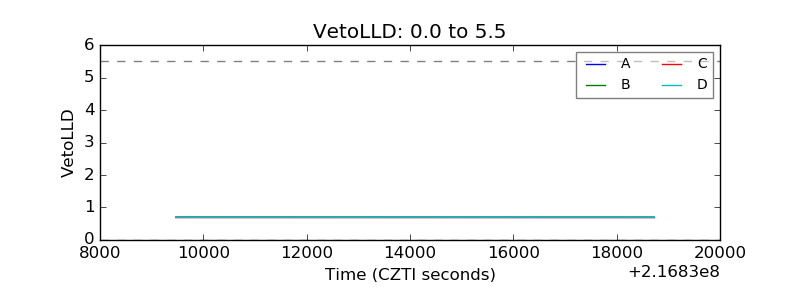 |
| Alpha Counter | 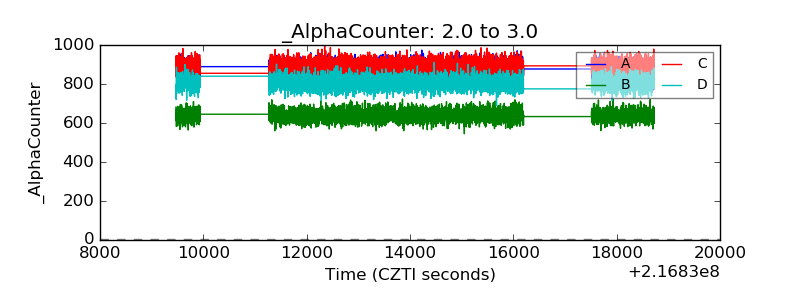 |
| _CPM_Rate | 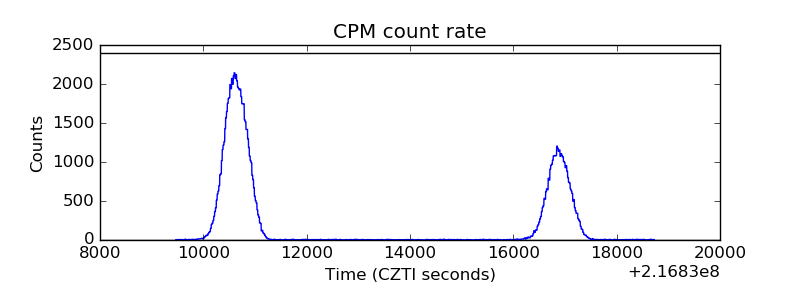 |
| CZT Counter | 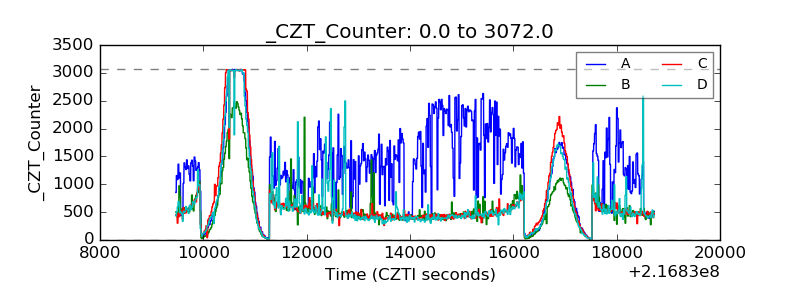 |
| +2.5 Volts monitor | 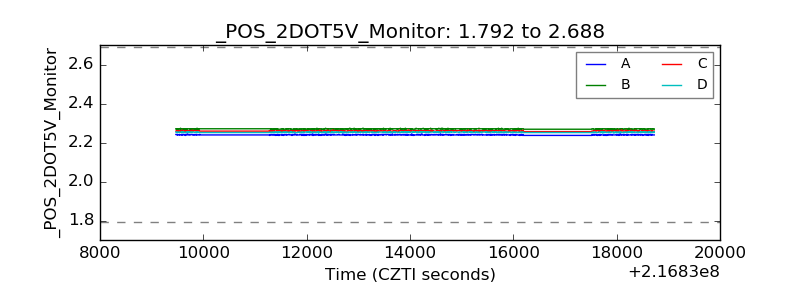 |
| +5 Volts monitor | 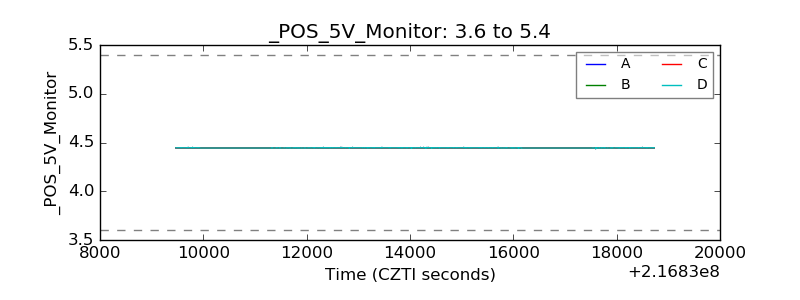 |
| _ROLL_ROT | 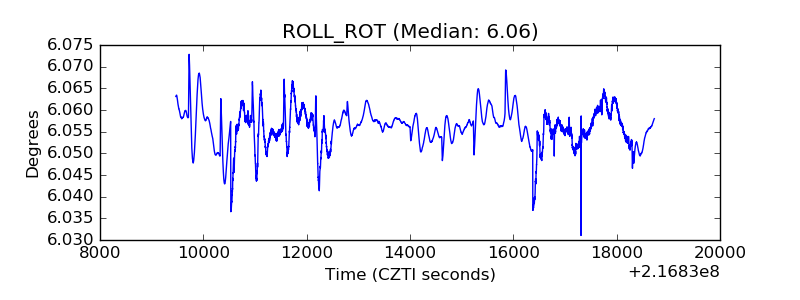 |
| _Roll_DEC | 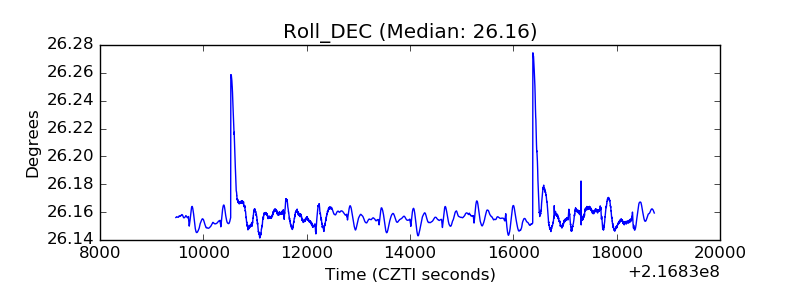 |
| _Roll_RA | 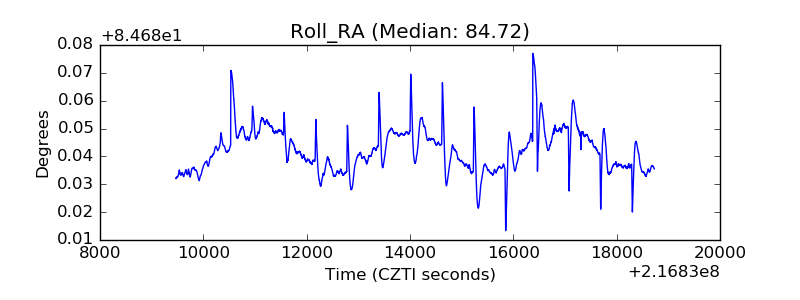 |
| Veto Counter | 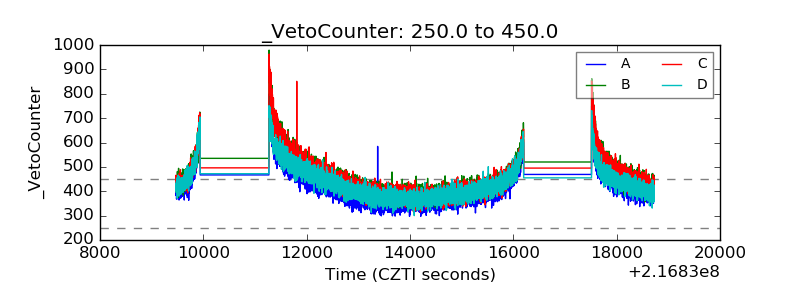 |