| Param | Original file | Final file |
|---|---|---|
| Filename | modeM0/AS1G06_019T01_9000000796cztM0_level2.fits | modeM0/AS1G06_019T01_9000000796cztM0_level2_quad_clean.evt |
| Size (bytes) | 592,367,040 | 575,159,040 |
| Size | 564.9 MB | 548.5 MB |
| Events in quadrant A | 3,531,407 | 3,354,837 |
| Events in quadrant B | 3,417,268 | 3,332,054 |
| Events in quadrant C | 3,517,502 | 3,285,482 |
| Events in quadrant D | 3,062,386 | 3,038,252 |
| Mode M9 | |||
|---|---|---|---|
| Quadrant | BADHDUFLAG | Total packets | Discarded packets |
| A | 0 | 104 | 0 |
| B | 0 | 104 | 0 |
| C | 0 | 103 | 0 |
| D | 0 | 104 | 0 |
| Mode M0 | |||
|---|---|---|---|
| Quadrant | BADHDUFLAG | Total packets | Discarded packets |
| A | 0 | 159217 | 0 |
| B | 0 | 151633 | 0 |
| C | 0 | 132445 | 0 |
| D | 0 | 138292 | 0 |
| Mode SS | |||
|---|---|---|---|
| Quadrant | BADHDUFLAG | Total packets | Discarded packets |
| A | 0 | 1322 | 0 |
| B | 0 | 1312 | 0 |
| C | 0 | 1338 | 0 |
| D | 0 | 1318 | 0 |
| Quadrant | Total seconds | Saturated seconds | Saturation percentage |
|---|---|---|---|
| A | 64248 | 2020 | 3.144067% |
| B | 64018 | 2699 | 4.216002% |
| C | 64277 | 550 | 0.855672% |
| D | 64271 | 893 | 1.389429% |
Noise dominated data is calculated using 1-second bins in cleaned event files. If a bin has >2000 counts, and if more than 50% of those come from <1% of pixels, then it is considered to be noise-dominated and hence unusable.
| Quadrant | # 1 sec bins | Bins with >0 counts | Bins with >2000 counts | High rate bins dominated by noise | Noise dominated (total time) | Noise dominated (detector-on time) | Marked lightcurve |
|---|---|---|---|---|---|---|---|
| A | 79498 | 65713 | 0 | 0 | 0.00% | 0.00% |  |
| B | 79498 | 65609 | 0 | 0 | 0.00% | 0.00% |  |
| C | 79498 | 65817 | 0 | 0 | 0.00% | 0.00% |  |
| D | 79498 | 65692 | 0 | 0 | 0.00% | 0.00% |  |
Top three noisy pixels from each quadrant. If the there are fewer than three noisy pixels in the level2.evt file, extra rows are filled as -1
| Pixel properties | Quadrant properties | ||||||
|---|---|---|---|---|---|---|---|
| Quadrant | DetID | PixID | Counts | Sigma | Mean | Median | Sigma |
| A | 0 | 29 | 3377 | 10.58 | 918 | 852 | 238.8 |
| A | 7 | 110 | 3027 | 9.11 | 918 | 852 | 238.8 |
| A | 0 | 30 | 2610 | 7.36 | 918 | 852 | 238.8 |
| B | 2 | 9 | 3004 | 11.64 | 901 | 854 | 184.7 |
| B | 12 | 226 | 2362 | 8.16 | 901 | 854 | 184.7 |
| B | 14 | 254 | 2311 | 7.89 | 901 | 854 | 184.7 |
| C | 1 | 81 | 2553 | 6.78 | 930 | 856 | 250.3 |
| C | 1 | 80 | 2518 | 6.64 | 930 | 856 | 250.3 |
| C | 9 | 233 | 2406 | 6.19 | 930 | 856 | 250.3 |
| D | 3 | 14 | 2387 | 6.72 | 872 | 787 | 238.1 |
| D | 6 | 231 | 2215 | 6.0 | 872 | 787 | 238.1 |
| D | 1 | 3 | 2188 | 5.88 | 872 | 787 | 238.1 |
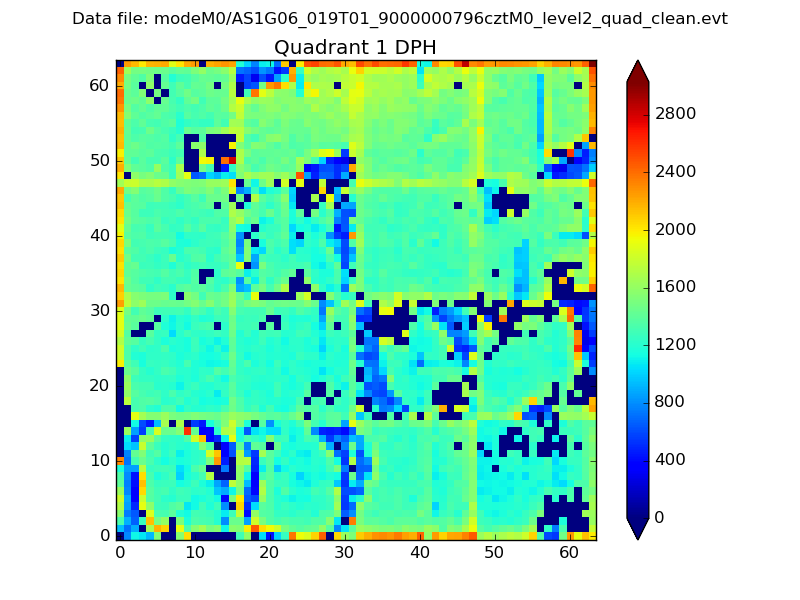
Histogram calculated using DETX and DETY for each event in the final _common_clean file
| Quadrant A |  |
 |
Quadrant B |
|---|---|---|---|
| Quadrant D |  |
 |
Quadrant C |
| Plot type | Count rate plots | Images |
|---|---|---|
| Comparison with Poisson distribution Blue bars denote a histogram of data divided into 1 sec bins. Red curve is a Poisson curve with rate = median count rate of data. |
 |
 |
| Quadrant-wise count rates Data is divided into 100 sec bins |
 |
|
| Module-wise count rates for Quadrant A Data is divided into 100 sec bins |
 |
 |
| Module-wise count rates for Quadrant B Data is divided into 100 sec bins |
 |
 |
| Module-wise count rates for Quadrant C Data is divided into 100 sec bins |
 |
 |
| Module-wise count rates for Quadrant D Data is divided into 100 sec bins |
 |
 |
| Parameter | Plot |
|---|---|
| CZT HV Monitor |  |
| D_VDD | 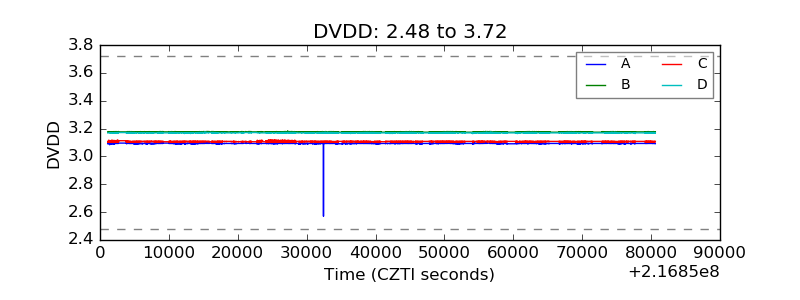 |
| Temperature 1 |  |
| Veto HV Monitor | 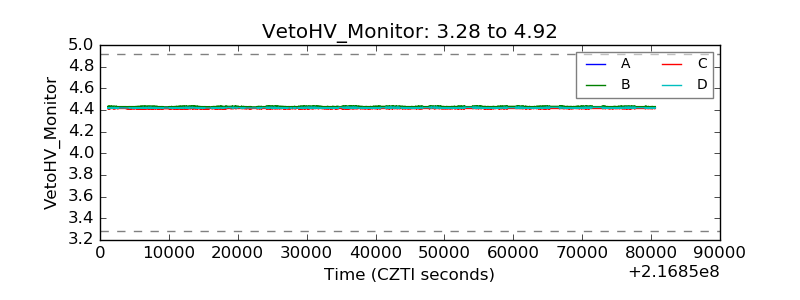 |
| Veto LLD |  |
| Alpha Counter |  |
| _CPM_Rate |  |
| CZT Counter |  |
| +2.5 Volts monitor |  |
| +5 Volts monitor |  |
| _ROLL_ROT | 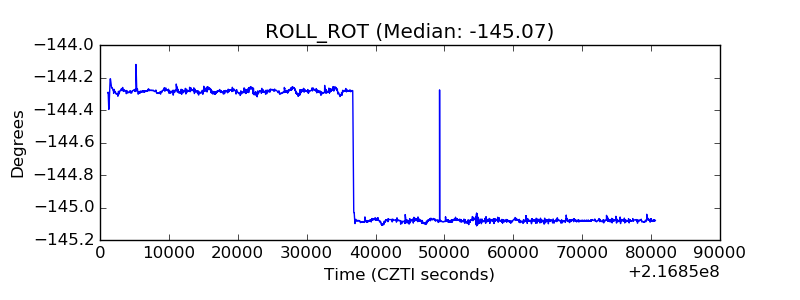 |
| _Roll_DEC |  |
| _Roll_RA |  |
| Veto Counter |  |