| Param | Original file | Final file |
|---|---|---|
| Filename | modeM0/AS1G06_019T01_9000000796_06124cztM0_level2.evt | modeM0/AS1G06_019T01_9000000796_06124cztM0_level2_quad_clean.evt |
| Size (bytes) | 230,693,760 | 37,290,240 |
| Size | 220.0 MB | 35.6 MB |
| Events in quadrant A | 2,216,595 | 223,979 |
| Events in quadrant B | 1,545,098 | 236,945 |
| Events in quadrant C | 1,484,663 | 234,233 |
| Events in quadrant D | 1,539,715 | 224,978 |
| Mode M9 | |||
|---|---|---|---|
| Quadrant | BADHDUFLAG | Total packets | Discarded packets |
| A | 0 | 11 | 0 |
| B | 0 | 11 | 0 |
| C | 0 | 11 | 0 |
| D | 0 | 11 | 0 |
| Mode M0 | |||
|---|---|---|---|
| Quadrant | BADHDUFLAG | Total packets | Discarded packets |
| A | 0 | 8544 | 2 |
| B | 0 | 6484 | 3 |
| C | 0 | 6326 | 1 |
| D | 0 | 6542 | 5 |
| Mode SS | |||
|---|---|---|---|
| Quadrant | BADHDUFLAG | Total packets | Discarded packets |
| A | 0 | 60 | 0 |
| B | 0 | 60 | 0 |
| C | 0 | 60 | 0 |
| D | 0 | 60 | 0 |
| Quadrant | Total seconds | Saturated seconds | Saturation percentage |
|---|---|---|---|
| A | 2927 | 151 | 5.158866% |
| B | 2926 | 94 | 3.212577% |
| C | 2927 | 51 | 1.742398% |
| D | 2926 | 46 | 1.572112% |
Noise dominated data is calculated using 1-second bins in cleaned event files. If a bin has >2000 counts, and if more than 50% of those come from <1% of pixels, then it is considered to be noise-dominated and hence unusable.
| Quadrant | # 1 sec bins | Bins with >0 counts | Bins with >2000 counts | High rate bins dominated by noise | Noise dominated (total time) | Noise dominated (detector-on time) | Marked lightcurve |
|---|---|---|---|---|---|---|---|
| A | 4002 | 2927 | 13 | 13 | 0.32% | 0.44% | 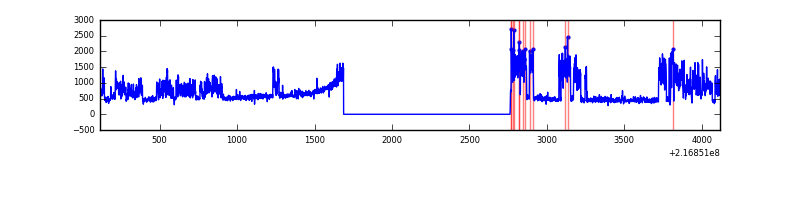 |
| B | 4002 | 2928 | 0 | 0 | 0.00% | 0.00% | 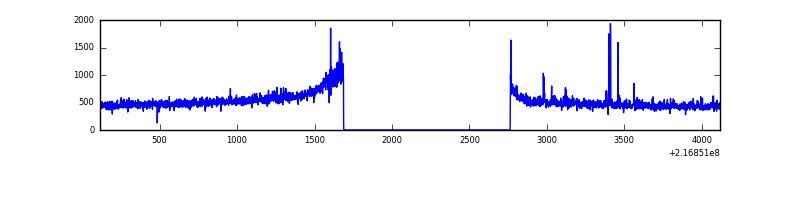 |
| C | 4002 | 2928 | 0 | 0 | 0.00% | 0.00% |  |
| D | 4002 | 2928 | 5 | 5 | 0.12% | 0.17% | 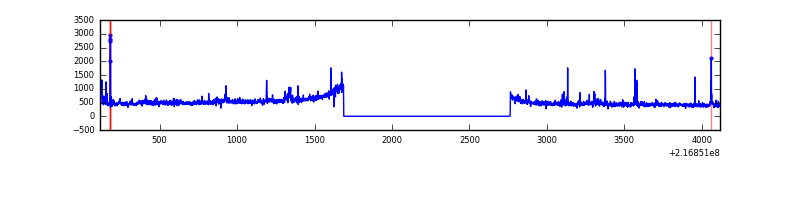 |
Top three noisy pixels from each quadrant. If the there are fewer than three noisy pixels in the level2.evt file, extra rows are filled as -1
| Pixel properties | Quadrant properties | ||||||
|---|---|---|---|---|---|---|---|
| Quadrant | DetID | PixID | Counts | Sigma | Mean | Median | Sigma |
| A | 8 | 15 | 762042 | 9608.12 | 376 | 368 | 79.3 |
| A | 15 | 234 | 3879 | 44.29 | 376 | 368 | 79.3 |
| A | 0 | 226 | 3617 | 40.98 | 376 | 368 | 79.3 |
| B | 3 | 64 | 21022 | 264.99 | 385 | 376 | 77.9 |
| B | 15 | 204 | 17566 | 220.63 | 385 | 376 | 77.9 |
| B | 12 | 111 | 7406 | 90.23 | 385 | 376 | 77.9 |
| C | 9 | 68 | 23412 | 261.14 | 370 | 373 | 88.2 |
| C | 1 | 16 | 6830 | 73.19 | 370 | 373 | 88.2 |
| C | 8 | 128 | 4721 | 49.28 | 370 | 373 | 88.2 |
| D | 11 | 241 | 44907 | 478.76 | 369 | 357 | 93.1 |
| D | 8 | 195 | 18937 | 199.67 | 369 | 357 | 93.1 |
| D | 2 | 14 | 18390 | 193.79 | 369 | 357 | 93.1 |
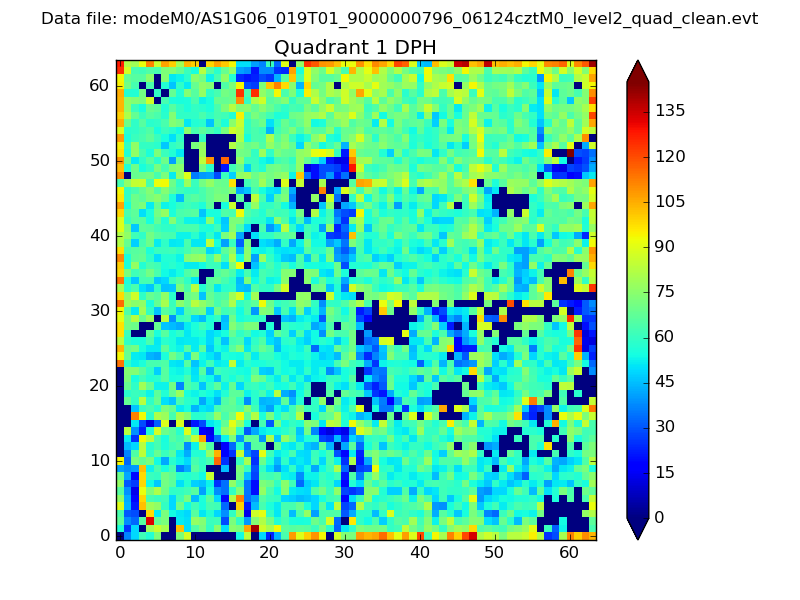
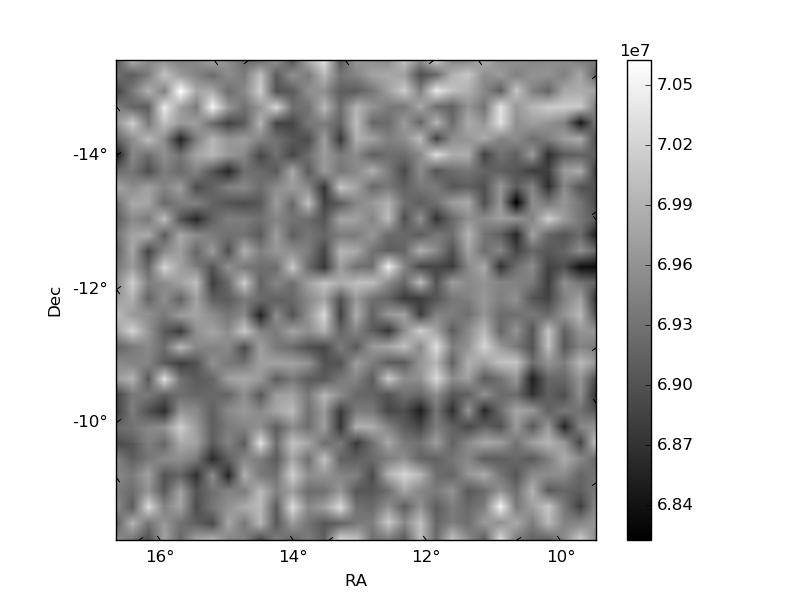
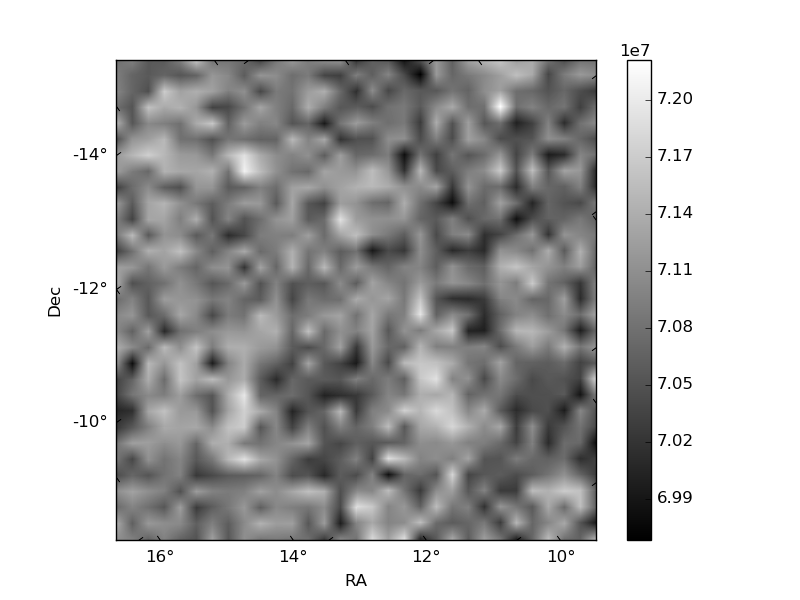
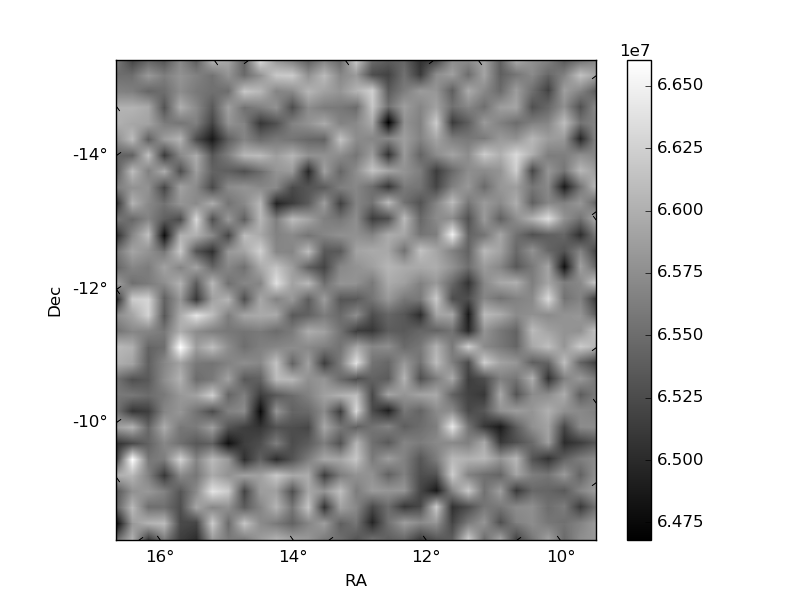
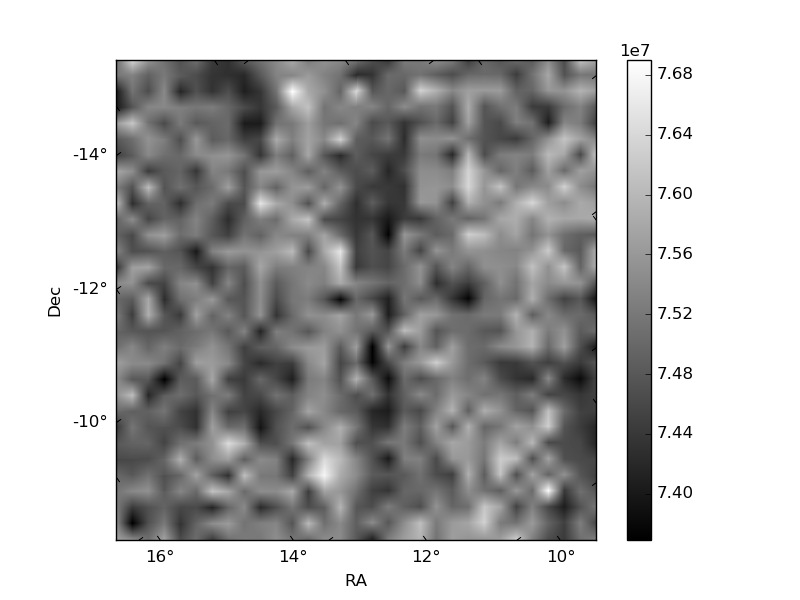
Histogram calculated using DETX and DETY for each event in the final _common_clean file
| Quadrant A | 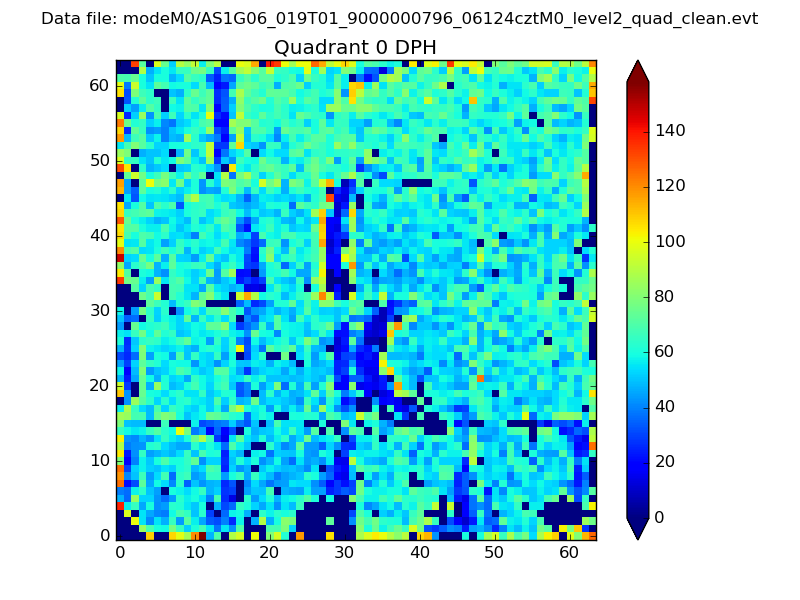 |
 |
Quadrant B |
|---|---|---|---|
| Quadrant D | 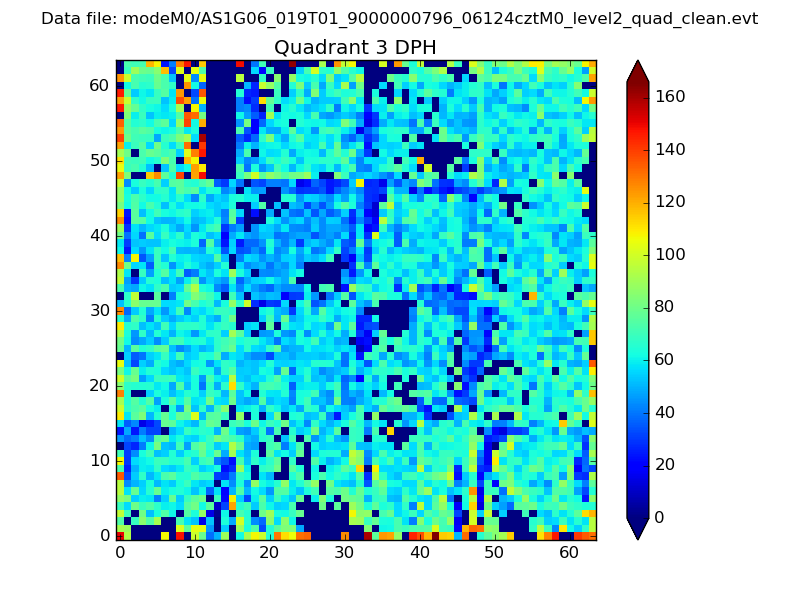 |
 |
Quadrant C |
| Plot type | Count rate plots | Images |
|---|---|---|
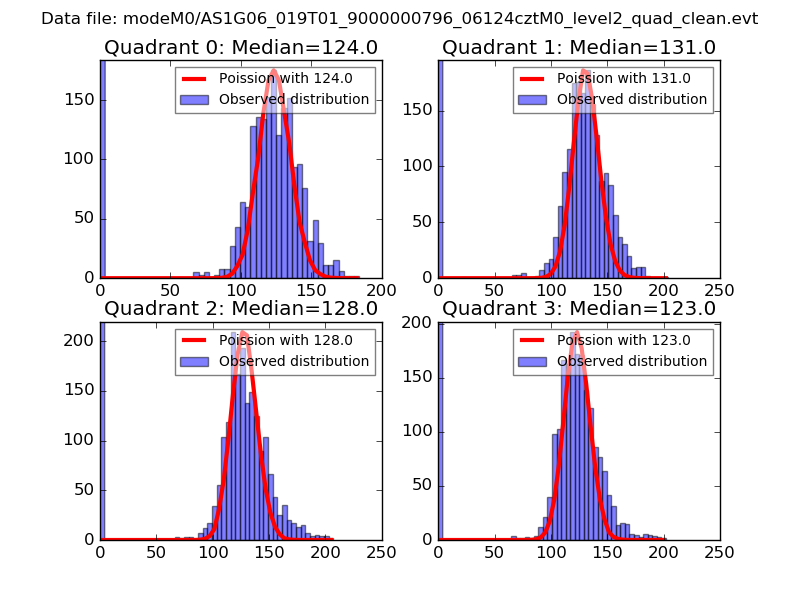
| Comparison with Poisson distribution Blue bars denote a histogram of data divided into 1 sec bins. Red curve is a Poisson curve with rate = median count rate of data. |
 |
 |
| Quadrant-wise count rates Data is divided into 100 sec bins |
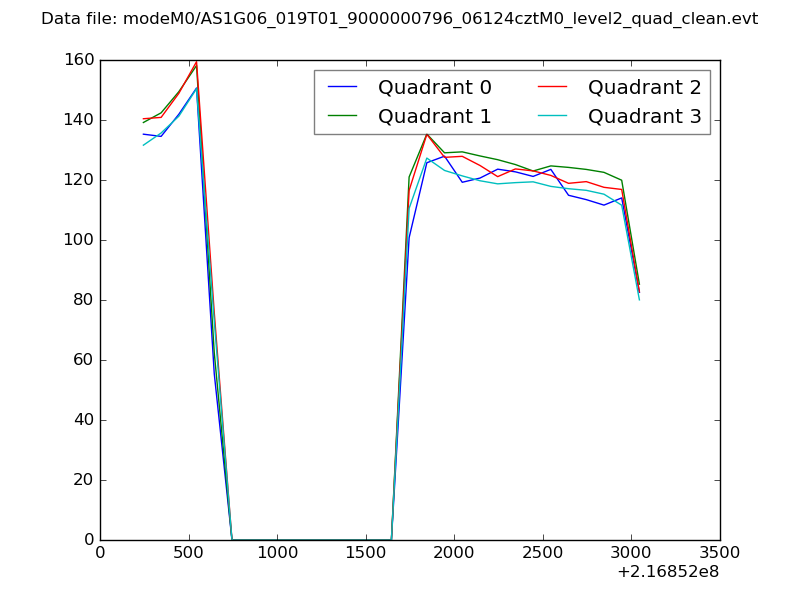 |
|
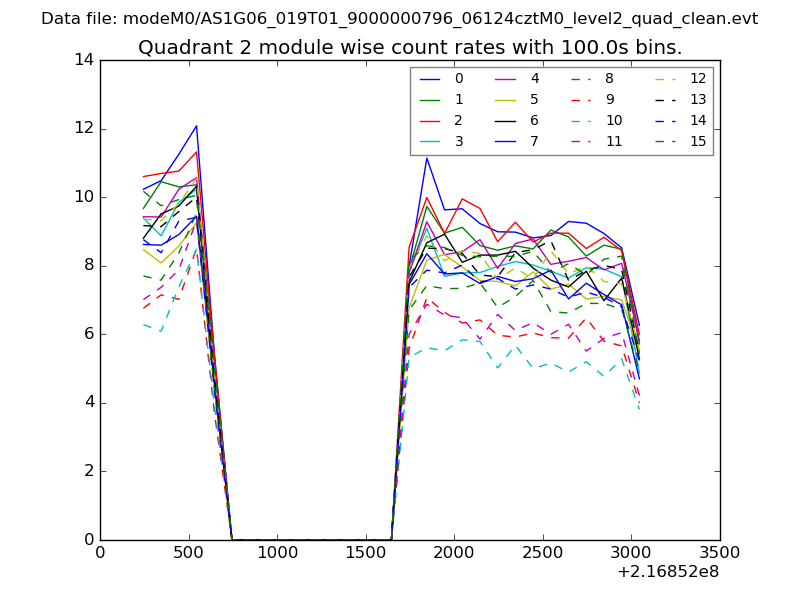
| Module-wise count rates for Quadrant A Data is divided into 100 sec bins |
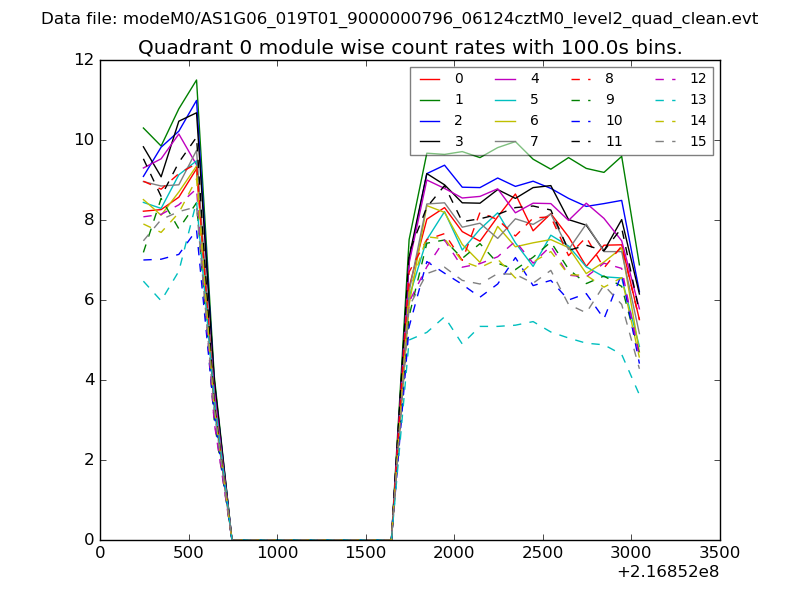 |
 |
| Module-wise count rates for Quadrant B Data is divided into 100 sec bins |
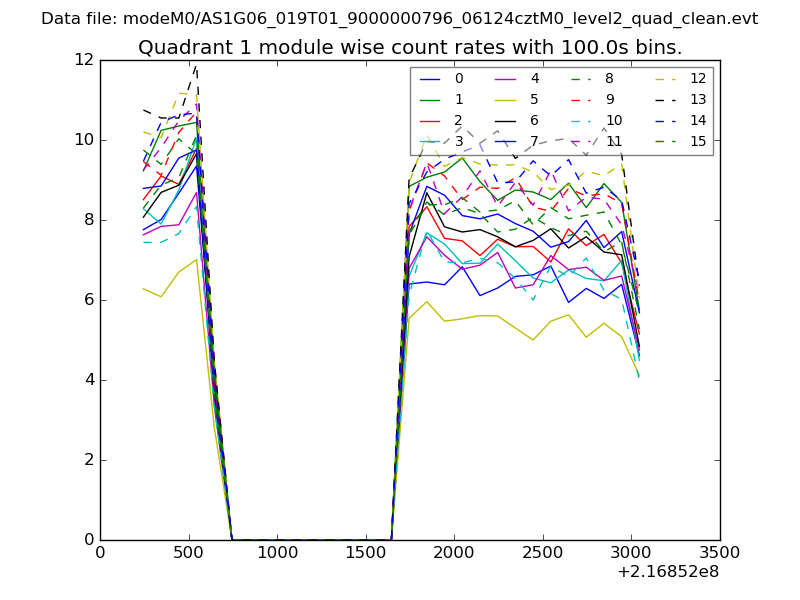 |
 |
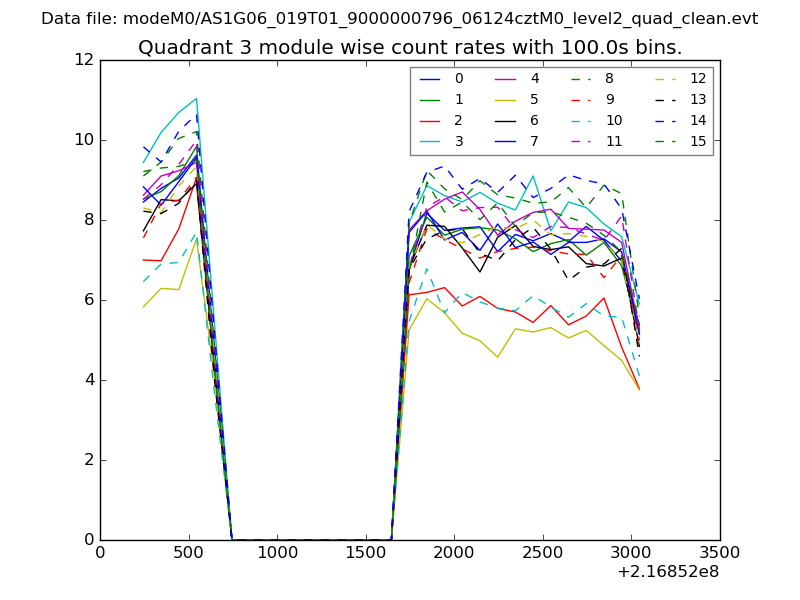
| Module-wise count rates for Quadrant C Data is divided into 100 sec bins |
 |
 |
| Module-wise count rates for Quadrant D Data is divided into 100 sec bins |
 |
 |
| Parameter | Plot |
|---|---|
| CZT HV Monitor | 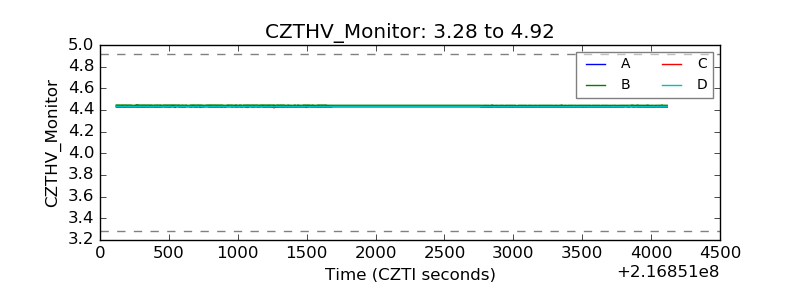 |
| D_VDD | 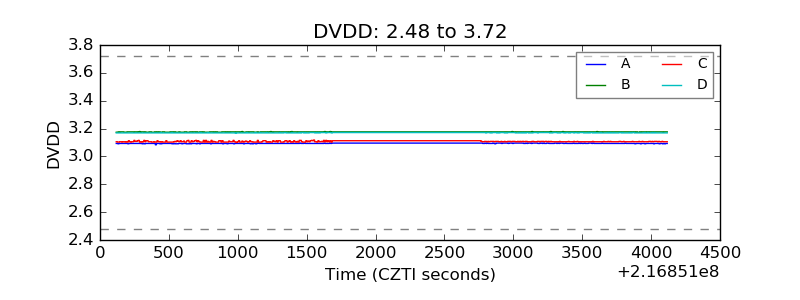 |
| Temperature 1 | 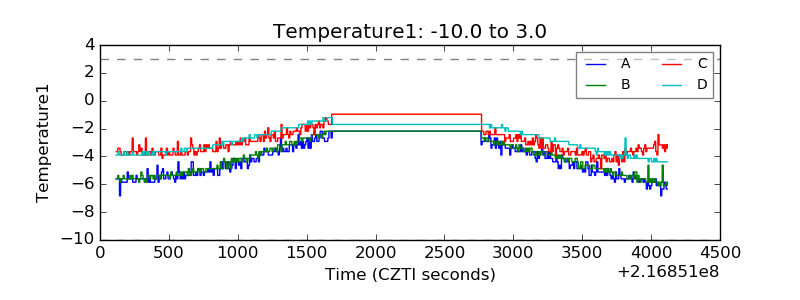 |
| Veto HV Monitor | 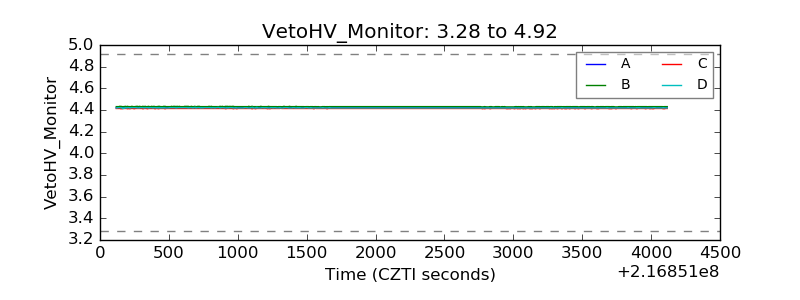 |
| Veto LLD | 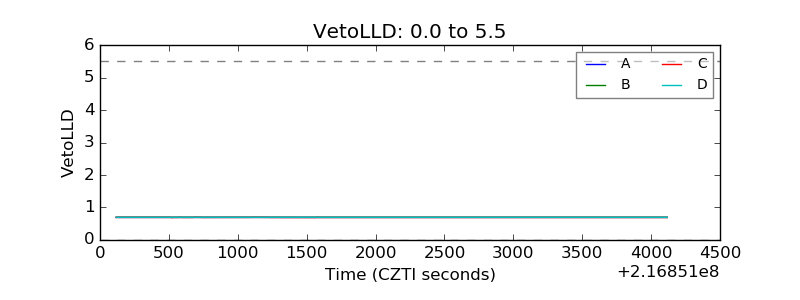 |
| Alpha Counter | 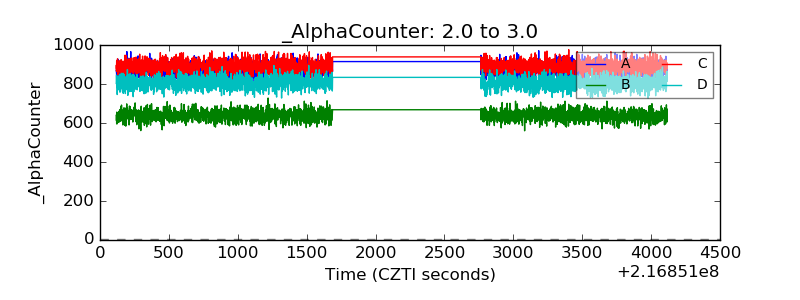 |
| _CPM_Rate | 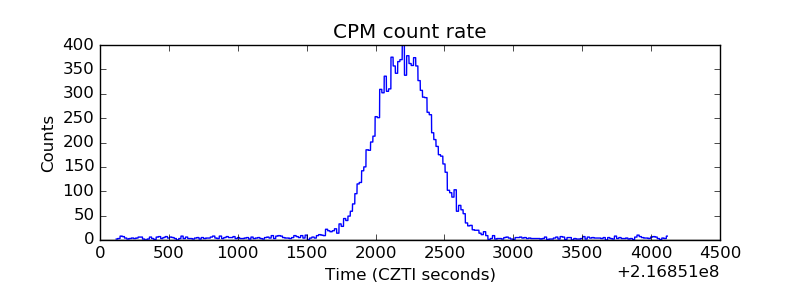 |
| CZT Counter | 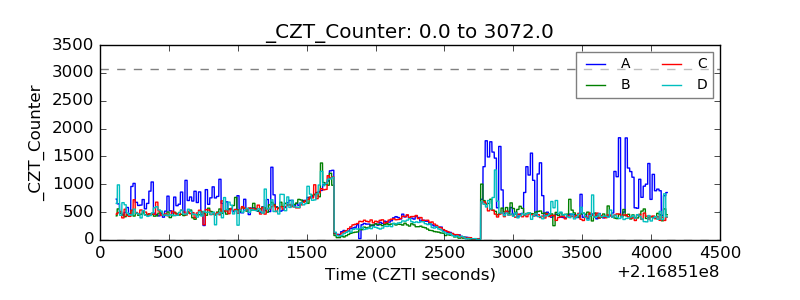 |
| +2.5 Volts monitor |  |
| +5 Volts monitor | 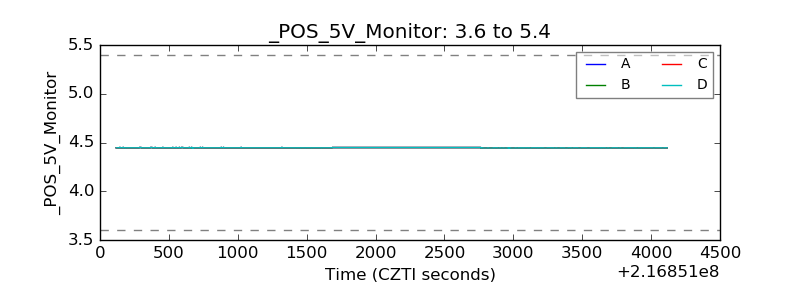 |
| _ROLL_ROT | 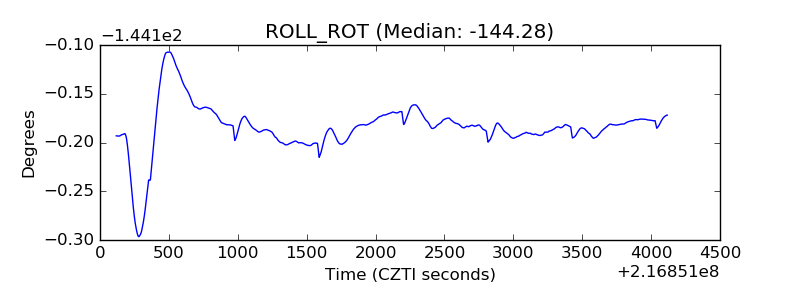 |
| _Roll_DEC | 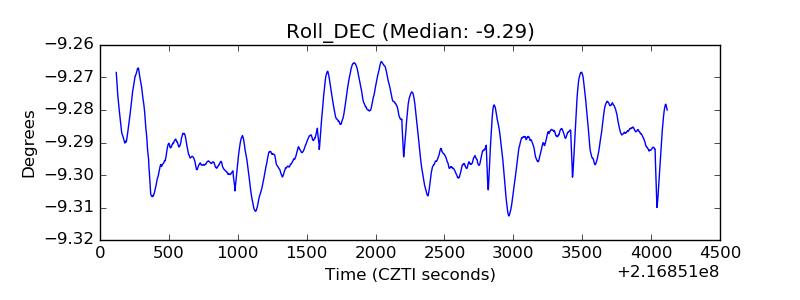 |
| _Roll_RA | 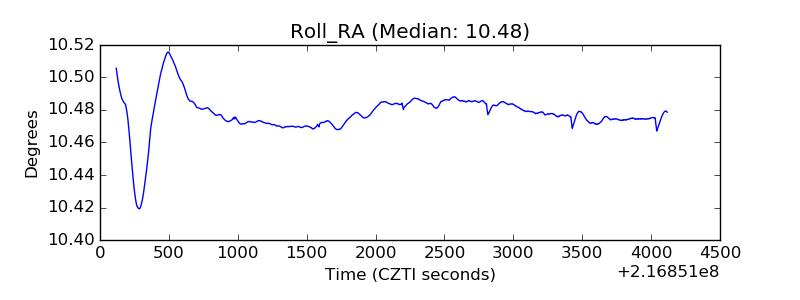 |
| Veto Counter | 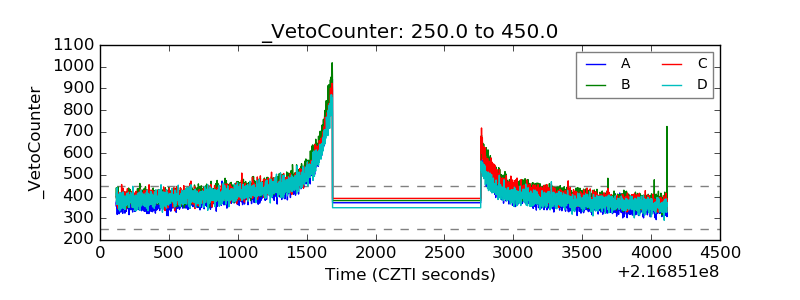 |