| Param | Original file | Final file |
|---|---|---|
| Filename | modeM0/AS1G06_019T01_9000000796_06125cztM0_level2.evt | modeM0/AS1G06_019T01_9000000796_06125cztM0_level2_quad_clean.evt |
| Size (bytes) | 617,310,720 | 93,110,400 |
| Size | 588.7 MB | 88.8 MB |
| Events in quadrant A | 8,219,997 | 549,026 |
| Events in quadrant B | 3,400,794 | 604,588 |
| Events in quadrant C | 3,217,448 | 594,795 |
| Events in quadrant D | 3,369,372 | 569,526 |
| Mode M9 | |||
|---|---|---|---|
| Quadrant | BADHDUFLAG | Total packets | Discarded packets |
| A | 0 | 11 | 0 |
| B | 0 | 11 | 0 |
| C | 0 | 11 | 0 |
| D | 0 | 12 | 0 |
| Mode M0 | |||
|---|---|---|---|
| Quadrant | BADHDUFLAG | Total packets | Discarded packets |
| A | 0 | 29338 | 3 |
| B | 0 | 15030 | 2 |
| C | 0 | 14675 | 2 |
| D | 0 | 15219 | 2 |
| Mode SS | |||
|---|---|---|---|
| Quadrant | BADHDUFLAG | Total packets | Discarded packets |
| A | 0 | 146 | 0 |
| B | 0 | 146 | 0 |
| C | 0 | 146 | 0 |
| D | 0 | 146 | 0 |
| Quadrant | Total seconds | Saturated seconds | Saturation percentage |
|---|---|---|---|
| A | 7202 | 850 | 11.802277% |
| B | 7202 | 28 | 0.388781% |
| C | 7202 | 8 | 0.111080% |
| D | 7202 | 37 | 0.513746% |
Noise dominated data is calculated using 1-second bins in cleaned event files. If a bin has >2000 counts, and if more than 50% of those come from <1% of pixels, then it is considered to be noise-dominated and hence unusable.
| Quadrant | # 1 sec bins | Bins with >0 counts | Bins with >2000 counts | High rate bins dominated by noise | Noise dominated (total time) | Noise dominated (detector-on time) | Marked lightcurve |
|---|---|---|---|---|---|---|---|
| A | 7967 | 7202 | 566 | 566 | 7.10% | 7.86% | 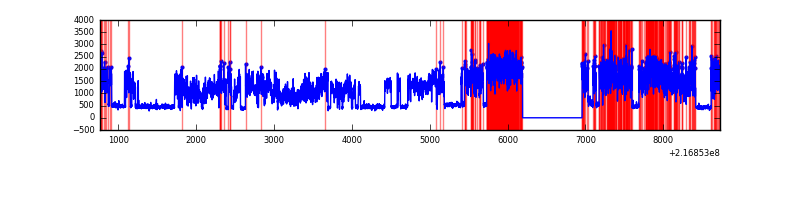 |
| B | 7967 | 7203 | 1 | 1 | 0.01% | 0.01% | 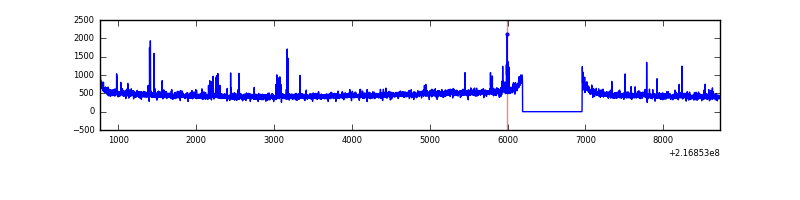 |
| C | 7967 | 7203 | 0 | 0 | 0.00% | 0.00% | 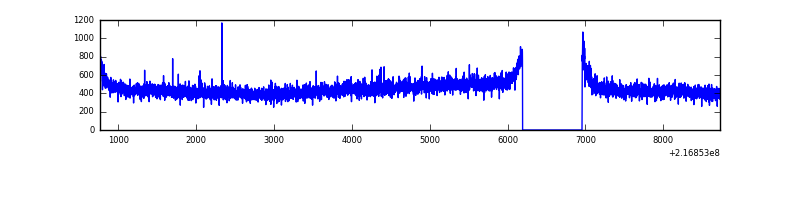 |
| D | 7967 | 7203 | 17 | 17 | 0.21% | 0.24% | 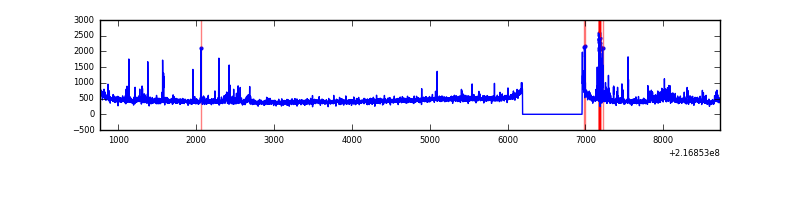 |
Top three noisy pixels from each quadrant. If the there are fewer than three noisy pixels in the level2.evt file, extra rows are filled as -1
| Pixel properties | Quadrant properties | ||||||
|---|---|---|---|---|---|---|---|
| Quadrant | DetID | PixID | Counts | Sigma | Mean | Median | Sigma |
| A | 8 | 15 | 5132000 | 31300.05 | 800 | 781 | 163.9 |
| A | 12 | 194 | 7654 | 41.92 | 800 | 781 | 163.9 |
| A | 0 | 226 | 7480 | 40.86 | 800 | 781 | 163.9 |
| B | 3 | 64 | 50860 | 306.37 | 841 | 819 | 163.3 |
| B | 15 | 204 | 29433 | 175.18 | 841 | 819 | 163.3 |
| B | 4 | 48 | 28390 | 168.8 | 841 | 819 | 163.3 |
| C | 1 | 16 | 44554 | 231.29 | 809 | 814 | 189.1 |
| C | 9 | 68 | 14677 | 73.3 | 809 | 814 | 189.1 |
| C | 13 | 61 | 6357 | 29.31 | 809 | 814 | 189.1 |
| D | 13 | 169 | 146324 | 732.95 | 803 | 777 | 198.6 |
| D | 11 | 241 | 68084 | 338.95 | 803 | 777 | 198.6 |
| D | 2 | 33 | 38571 | 190.32 | 803 | 777 | 198.6 |
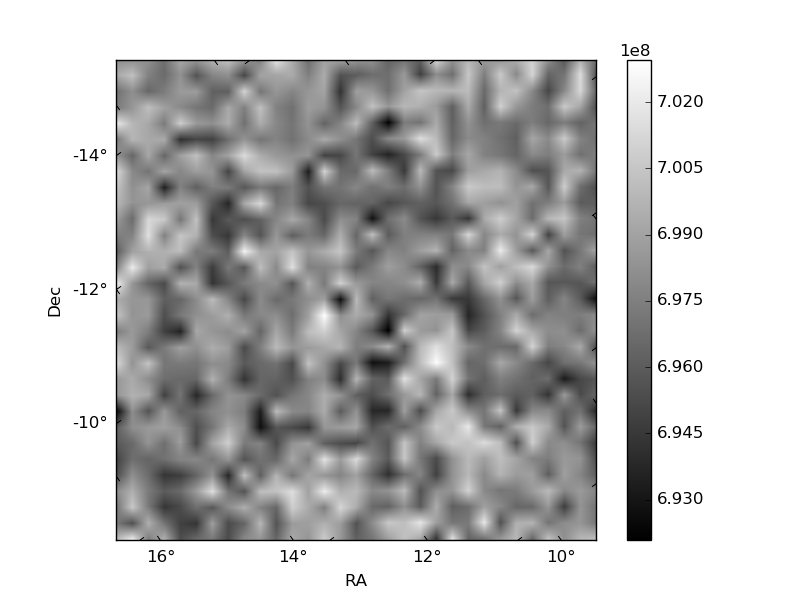
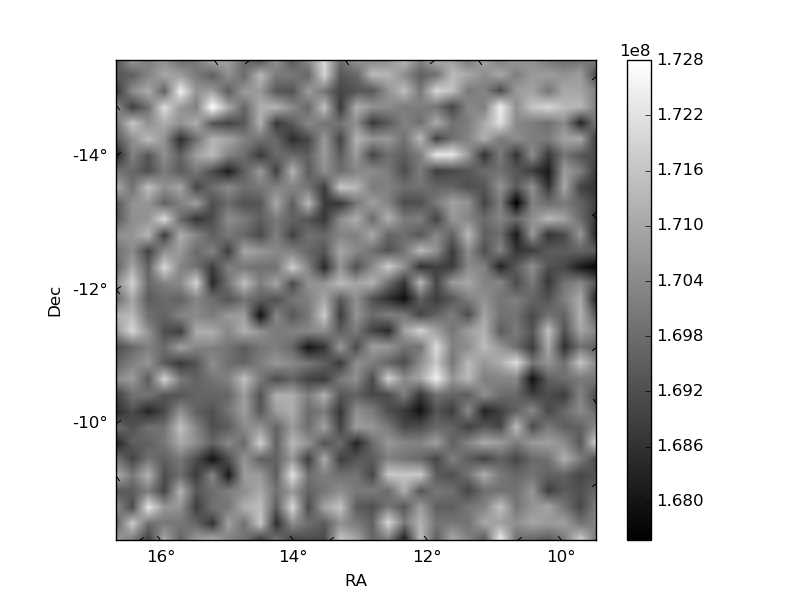
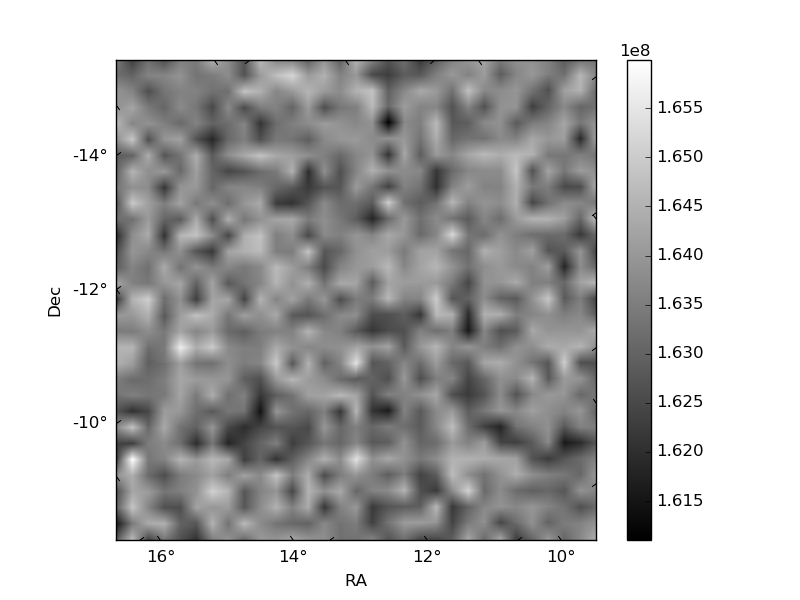
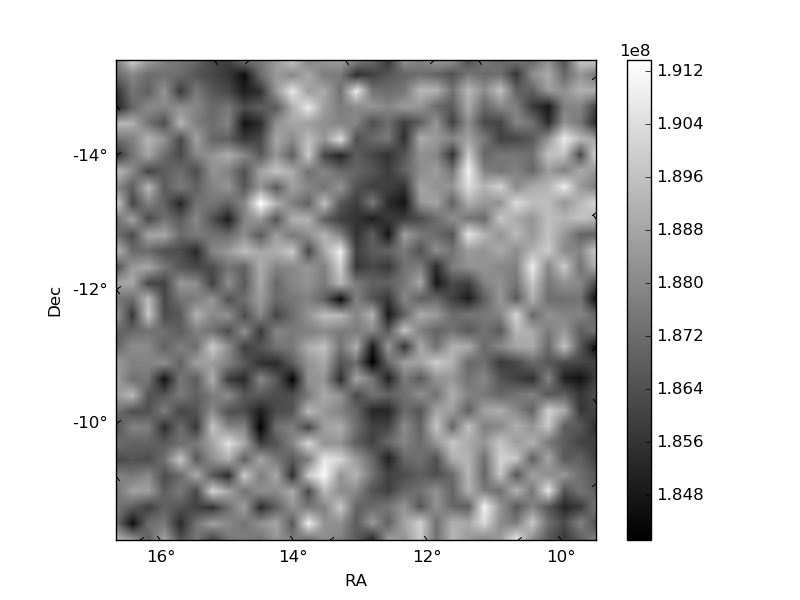
Histogram calculated using DETX and DETY for each event in the final _common_clean file
| Quadrant A | 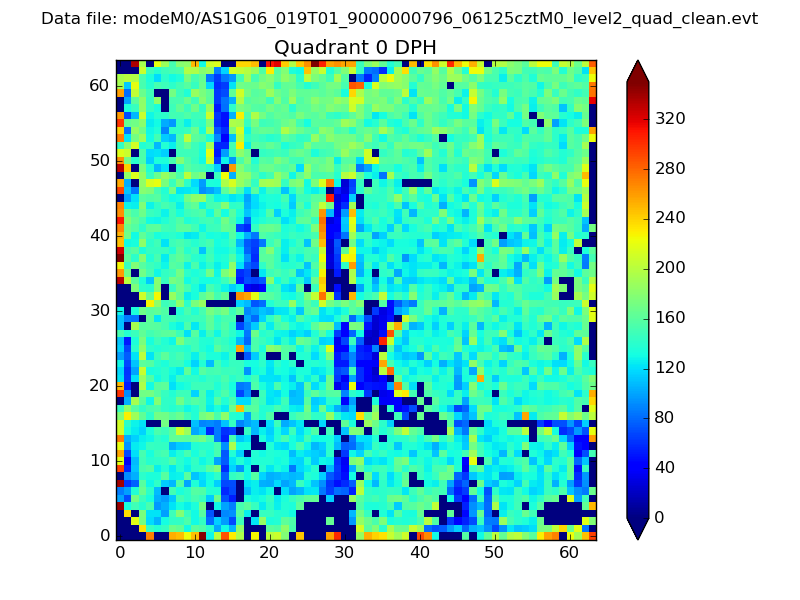 |
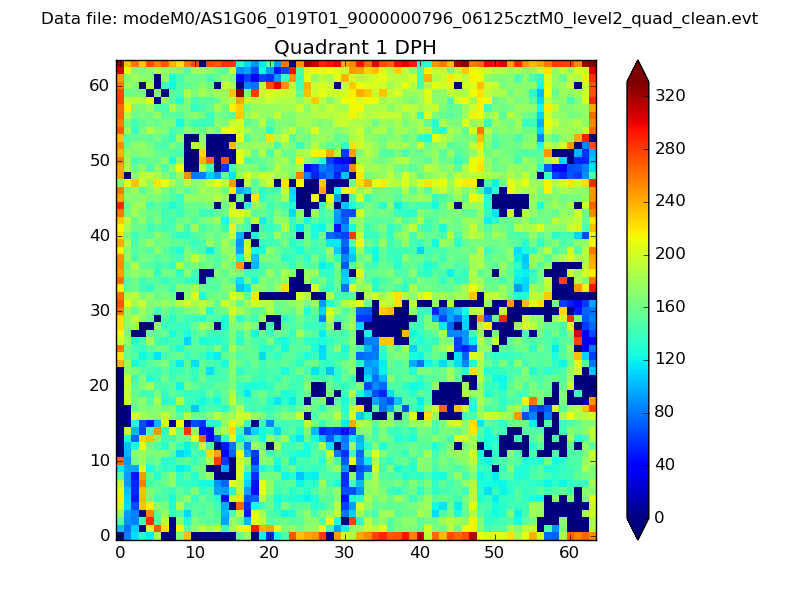 |
Quadrant B |
|---|---|---|---|
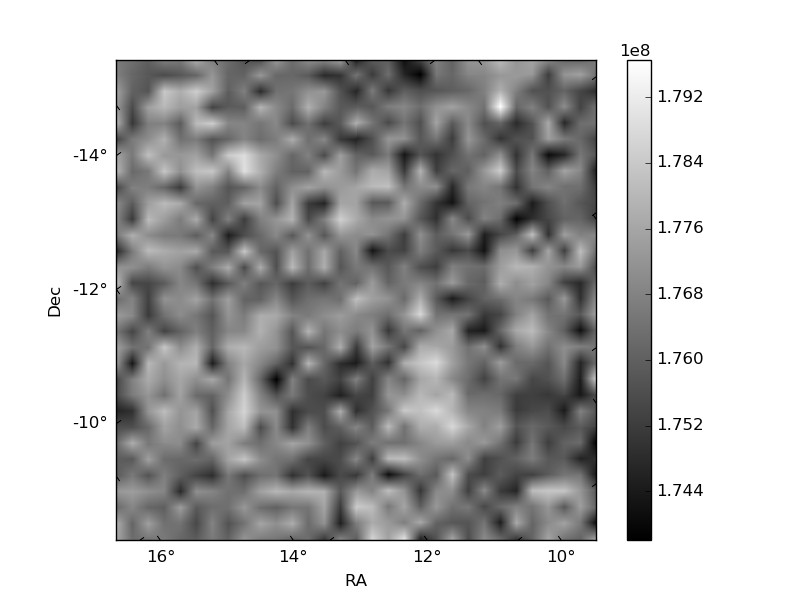
| Quadrant D | 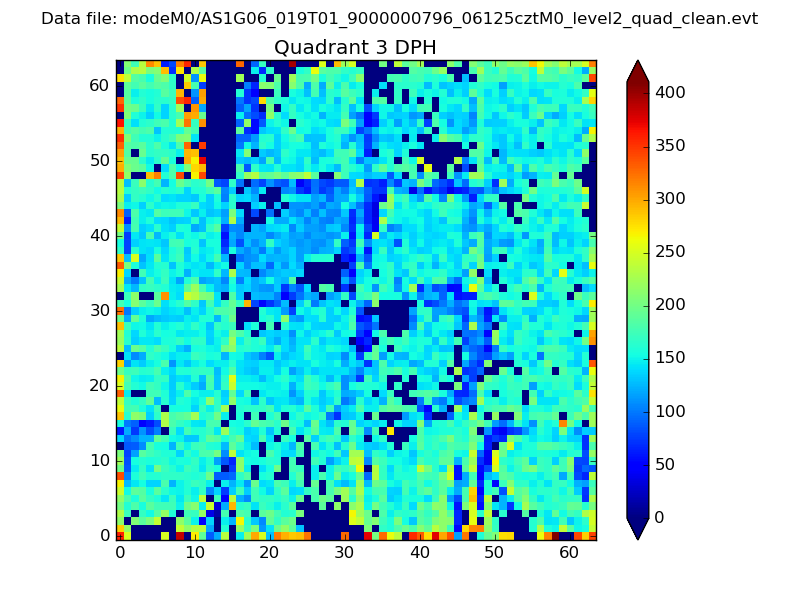 |
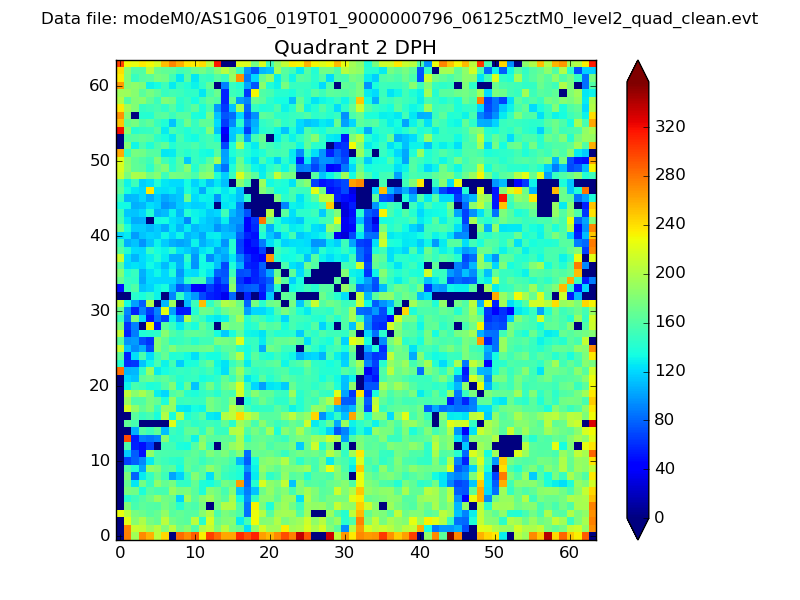 |
Quadrant C |
| Plot type | Count rate plots | Images |
|---|---|---|
| Comparison with Poisson distribution Blue bars denote a histogram of data divided into 1 sec bins. Red curve is a Poisson curve with rate = median count rate of data. |
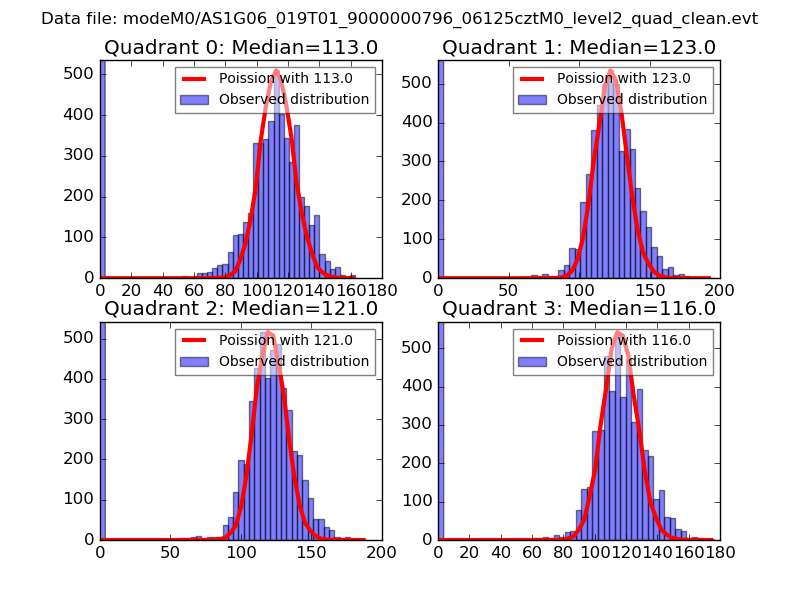 |
 |
| Quadrant-wise count rates Data is divided into 100 sec bins |
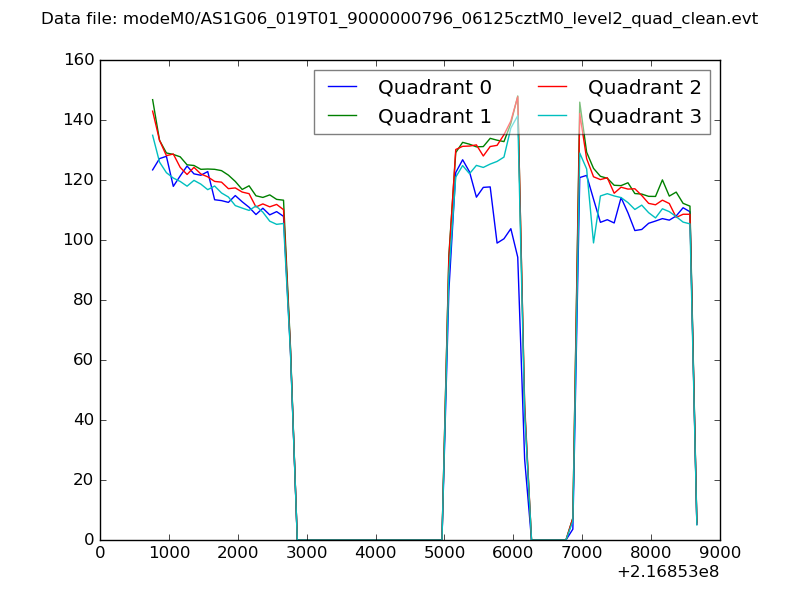 |
|
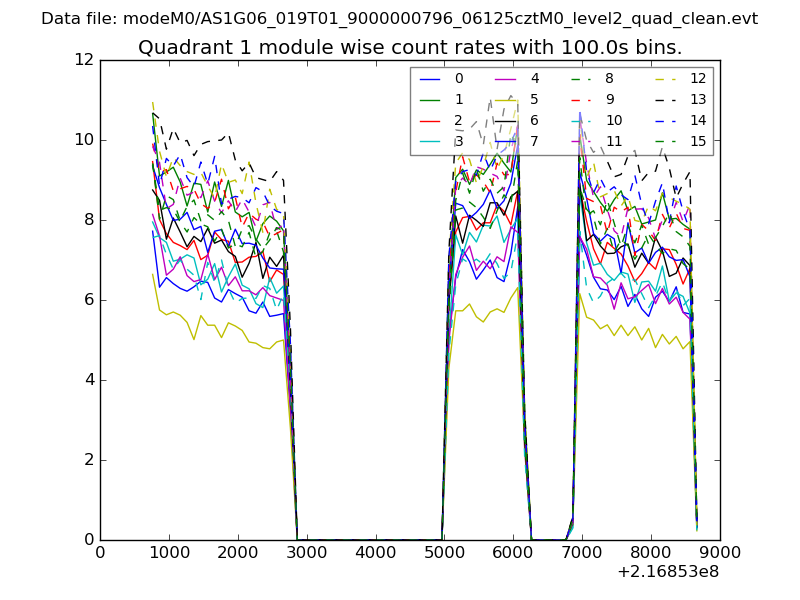
| Module-wise count rates for Quadrant A Data is divided into 100 sec bins |
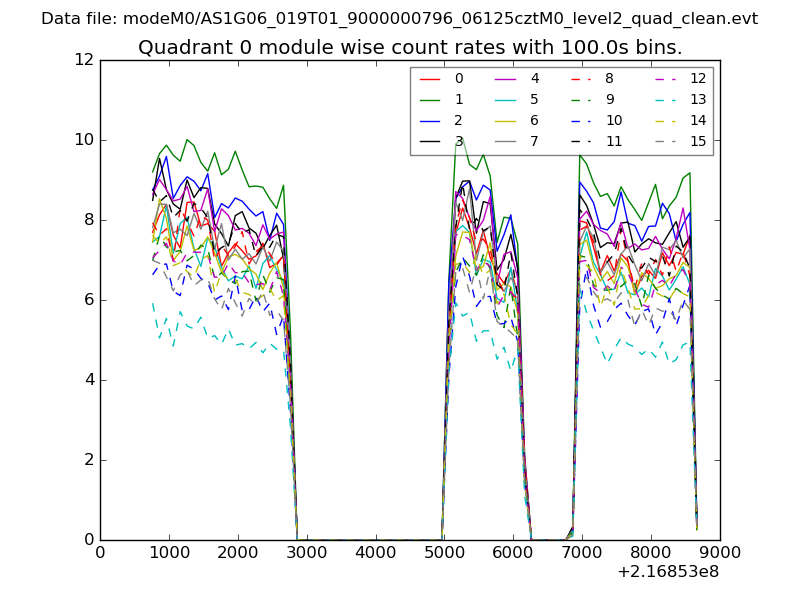 |
 |
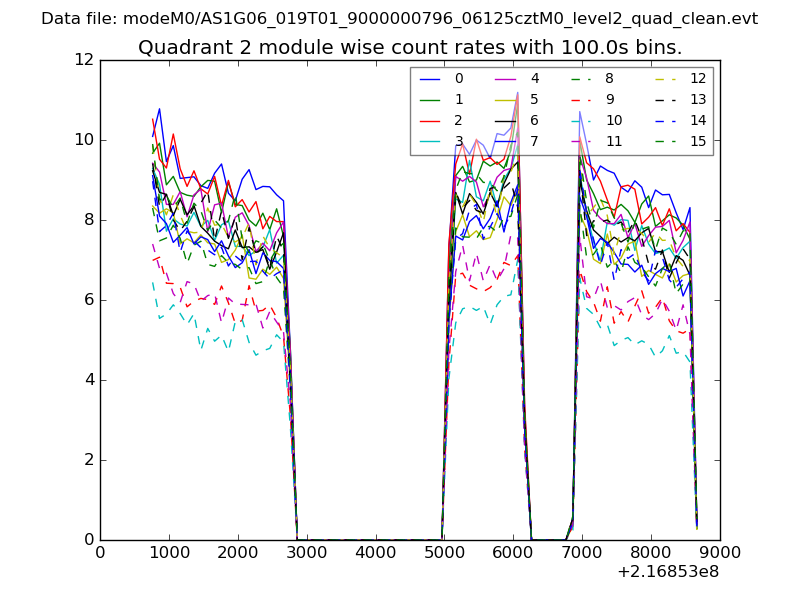
| Module-wise count rates for Quadrant B Data is divided into 100 sec bins |
 |
 |
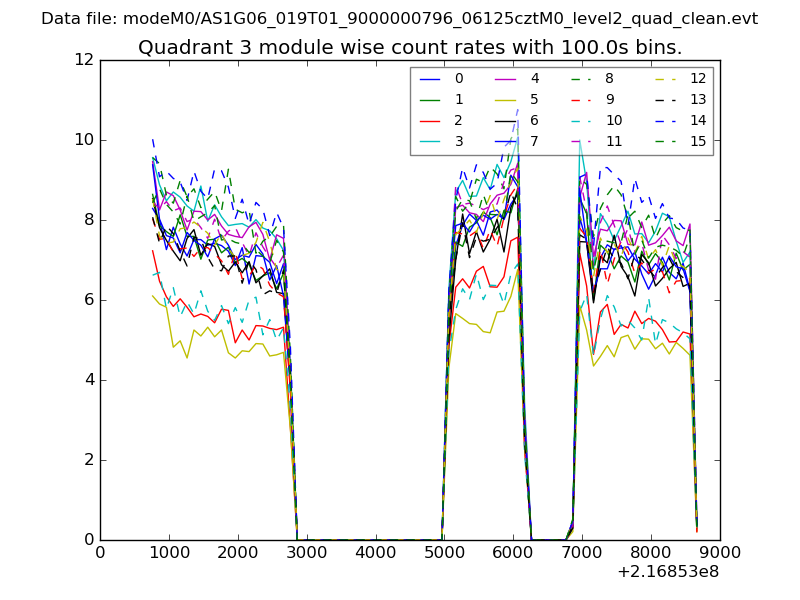
| Module-wise count rates for Quadrant C Data is divided into 100 sec bins |
 |
 |
| Module-wise count rates for Quadrant D Data is divided into 100 sec bins |
 |
 |
| Parameter | Plot |
|---|---|
| CZT HV Monitor | 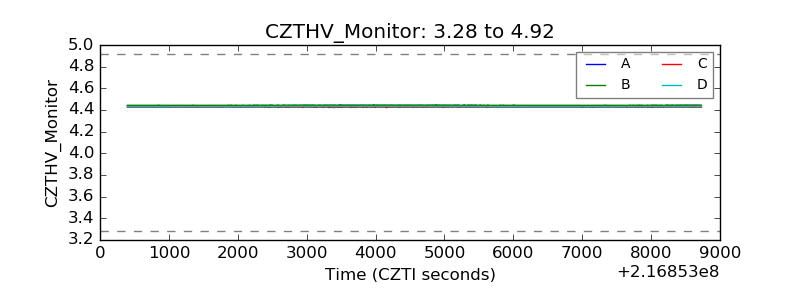 |
| D_VDD | 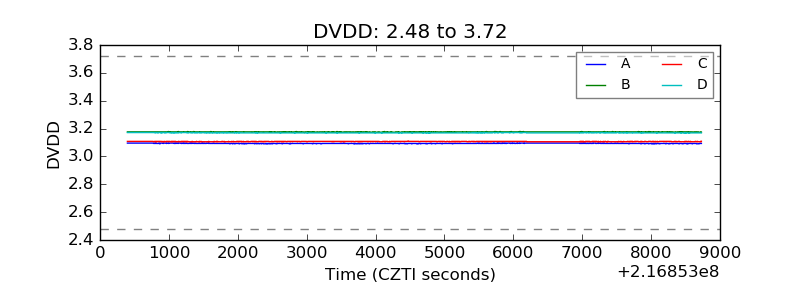 |
| Temperature 1 | 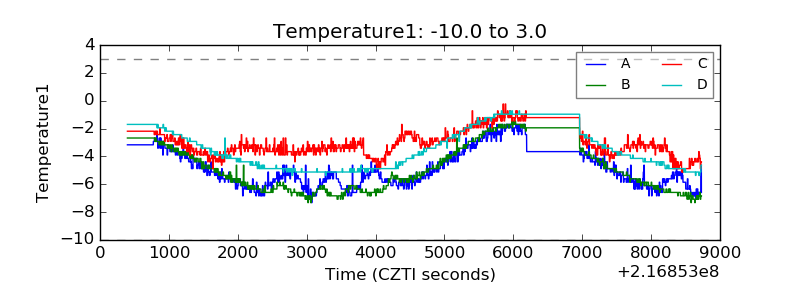 |
| Veto HV Monitor | 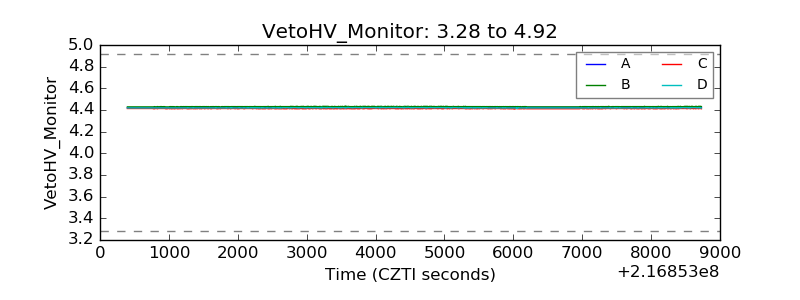 |
| Veto LLD | 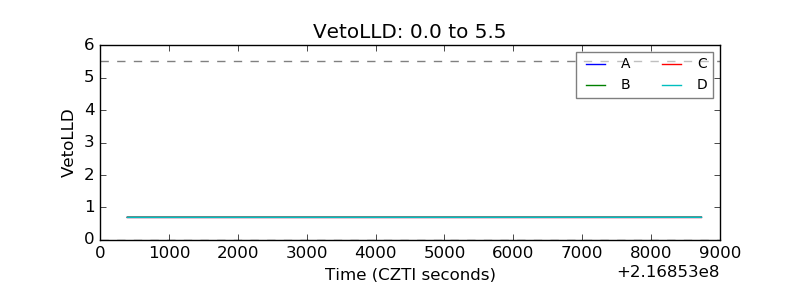 |
| Alpha Counter | 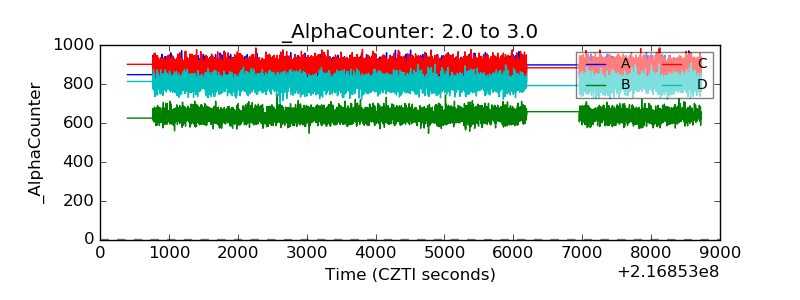 |
| _CPM_Rate | 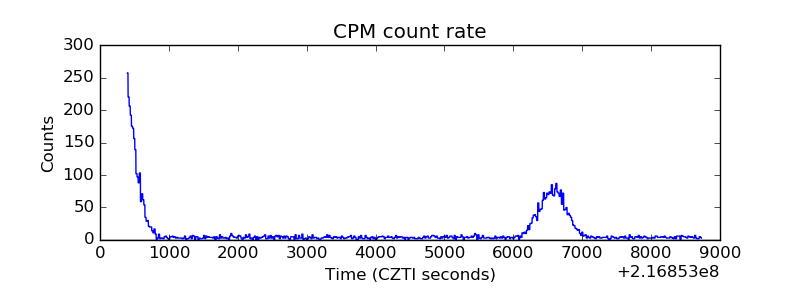 |
| CZT Counter | 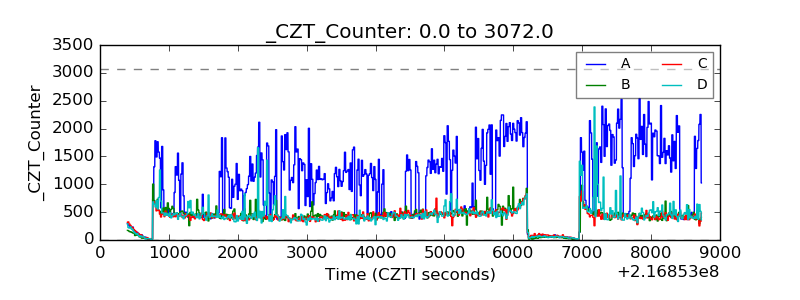 |
| +2.5 Volts monitor | 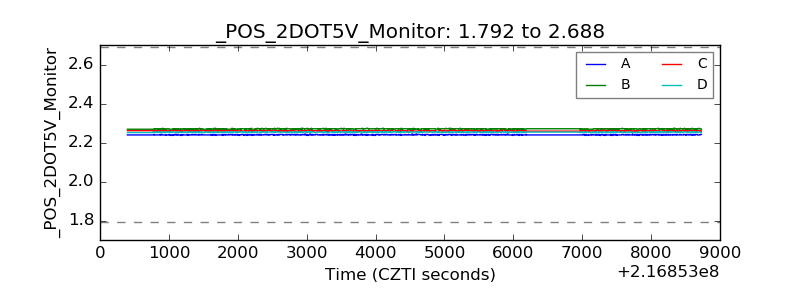 |
| +5 Volts monitor |  |
| _ROLL_ROT | 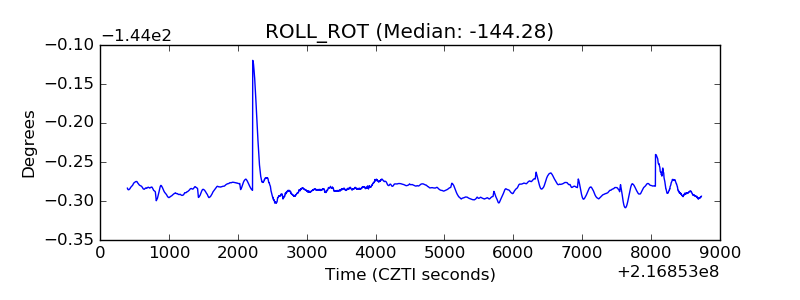 |
| _Roll_DEC | 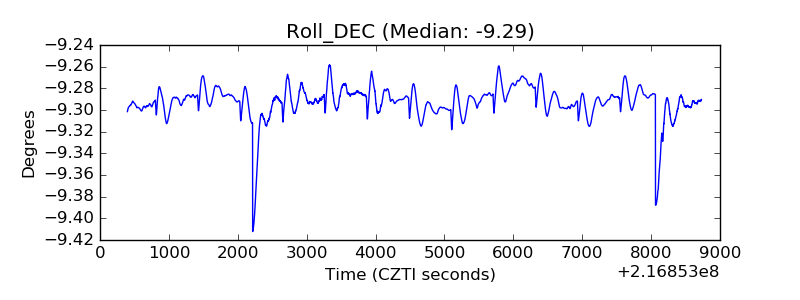 |
| _Roll_RA | 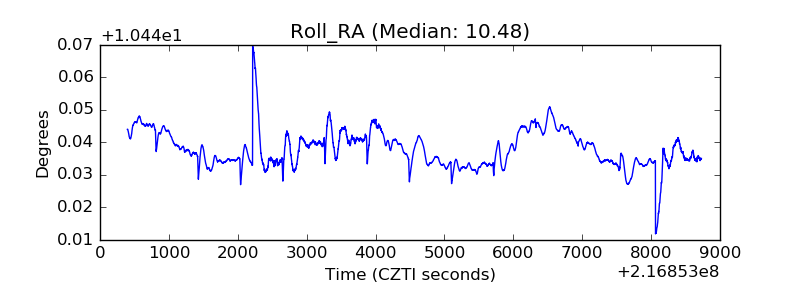 |
| Veto Counter | 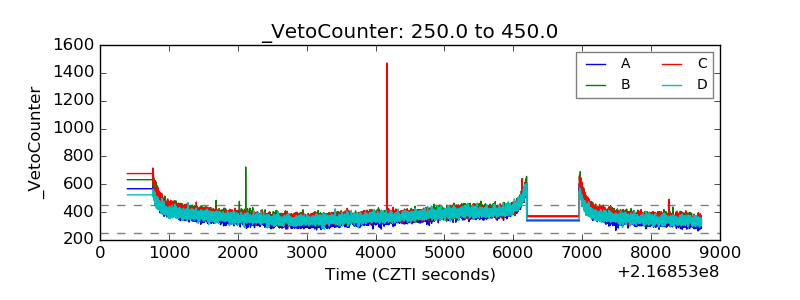 |