| Param | Original file | Final file |
|---|---|---|
| Filename | modeM0/AS1G06_019T01_9000000796_06130cztM0_level2.evt | modeM0/AS1G06_019T01_9000000796_06130cztM0_level2_quad_clean.evt |
| Size (bytes) | 204,062,400 | 33,831,360 |
| Size | 194.6 MB | 32.3 MB |
| Events in quadrant A | 1,535,878 | 196,056 |
| Events in quadrant B | 1,515,061 | 197,046 |
| Events in quadrant C | 1,455,421 | 198,423 |
| Events in quadrant D | 1,440,514 | 191,968 |
| Mode M0 | |||
|---|---|---|---|
| Quadrant | BADHDUFLAG | Total packets | Discarded packets |
| A | 0 | 10033 | 3186 |
| B | 0 | 10314 | 3477 |
| C | 0 | 9970 | 3178 |
| D | 0 | 10294 | 3424 |
| Mode SS | |||
|---|---|---|---|
| Quadrant | BADHDUFLAG | Total packets | Discarded packets |
| A | 0 | 98 | 26 |
| B | 0 | 97 | 37 |
| C | 0 | 97 | 27 |
| D | 0 | 100 | 26 |
| Quadrant | Total seconds | Saturated seconds | Saturation percentage |
|---|---|---|---|
| A | 3386 | 0 | 0.000000% |
| B | 3375 | 7 | 0.207407% |
| C | 3392 | 3 | 0.088443% |
| D | 3367 | 7 | 0.207900% |
Noise dominated data is calculated using 1-second bins in cleaned event files. If a bin has >2000 counts, and if more than 50% of those come from <1% of pixels, then it is considered to be noise-dominated and hence unusable.
| Quadrant | # 1 sec bins | Bins with >0 counts | Bins with >2000 counts | High rate bins dominated by noise | Noise dominated (total time) | Noise dominated (detector-on time) | Marked lightcurve |
|---|---|---|---|---|---|---|---|
| A | 5034 | 3883 | 1 | 1 | 0.02% | 0.03% | 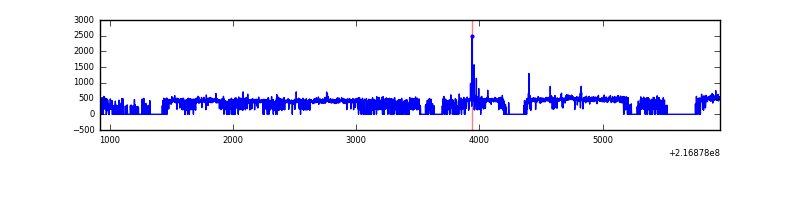 |
| B | 5035 | 3853 | 1 | 1 | 0.02% | 0.03% |  |
| C | 5035 | 3880 | 0 | 0 | 0.00% | 0.00% | 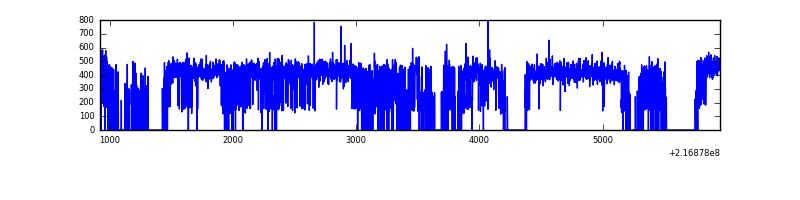 |
| D | 5035 | 3848 | 4 | 4 | 0.08% | 0.10% | 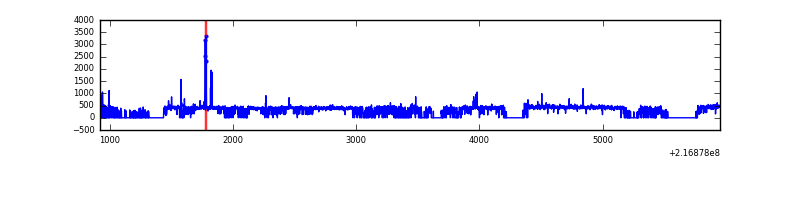 |
Top three noisy pixels from each quadrant. If the there are fewer than three noisy pixels in the level2.evt file, extra rows are filled as -1
| Pixel properties | Quadrant properties | ||||||
|---|---|---|---|---|---|---|---|
| Quadrant | DetID | PixID | Counts | Sigma | Mean | Median | Sigma |
| A | 8 | 15 | 80697 | 1016.91 | 375 | 366 | 79.0 |
| A | 4 | 2 | 10982 | 134.39 | 375 | 366 | 79.0 |
| A | 12 | 194 | 3585 | 40.75 | 375 | 366 | 79.0 |
| B | 3 | 64 | 27815 | 362.97 | 379 | 370 | 75.6 |
| B | 0 | 219 | 7430 | 93.37 | 379 | 370 | 75.6 |
| B | 12 | 111 | 7364 | 92.5 | 379 | 370 | 75.6 |
| C | 1 | 16 | 21709 | 246.14 | 367 | 369 | 86.7 |
| C | 13 | 61 | 2941 | 29.67 | 367 | 369 | 86.7 |
| C | 4 | 254 | 2124 | 20.24 | 367 | 369 | 86.7 |
| D | 13 | 169 | 39800 | 429.84 | 363 | 350 | 91.8 |
| D | 8 | 195 | 12806 | 135.72 | 363 | 350 | 91.8 |
| D | 2 | 206 | 9607 | 100.86 | 363 | 350 | 91.8 |
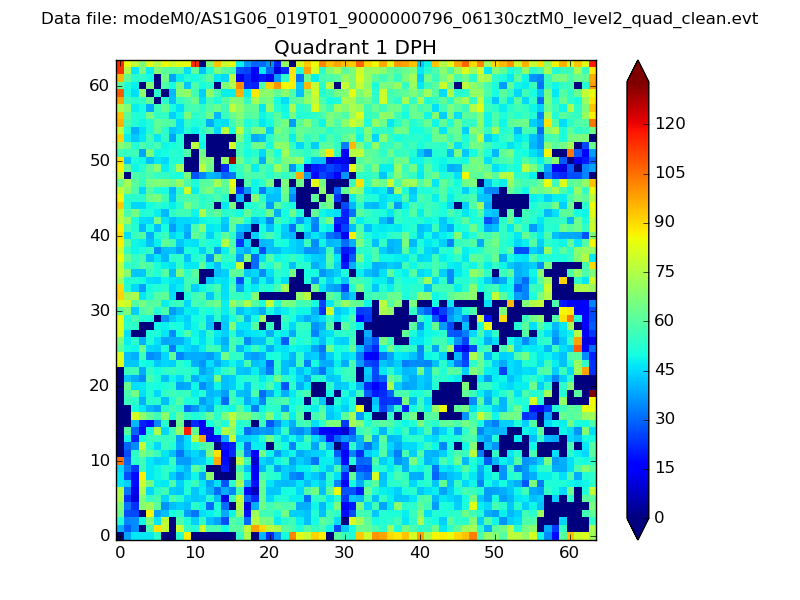
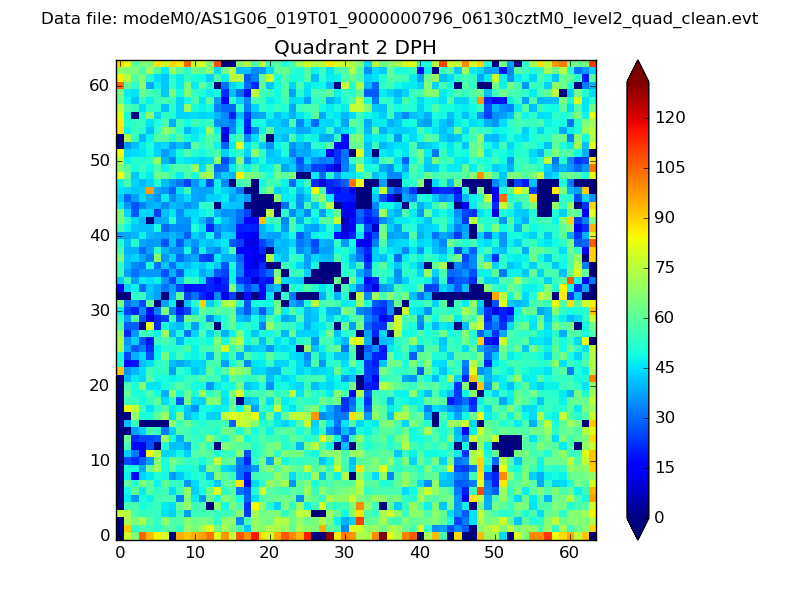
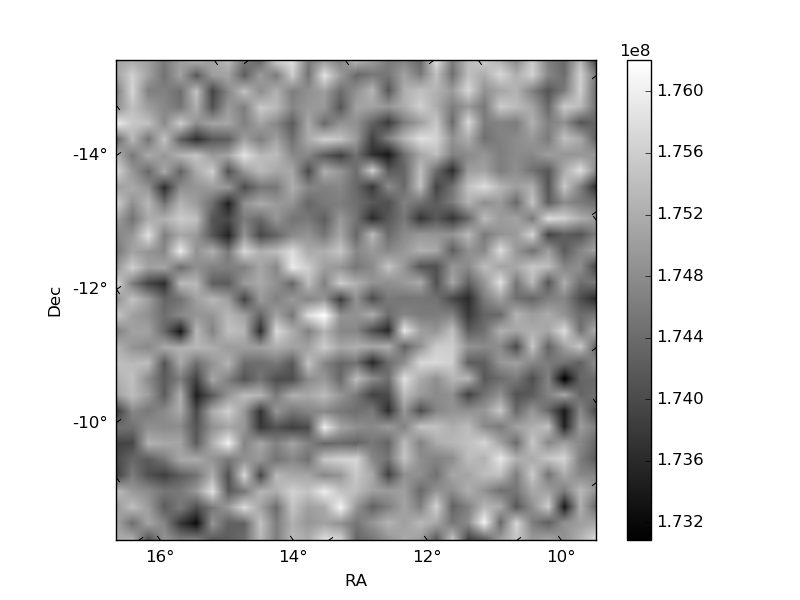
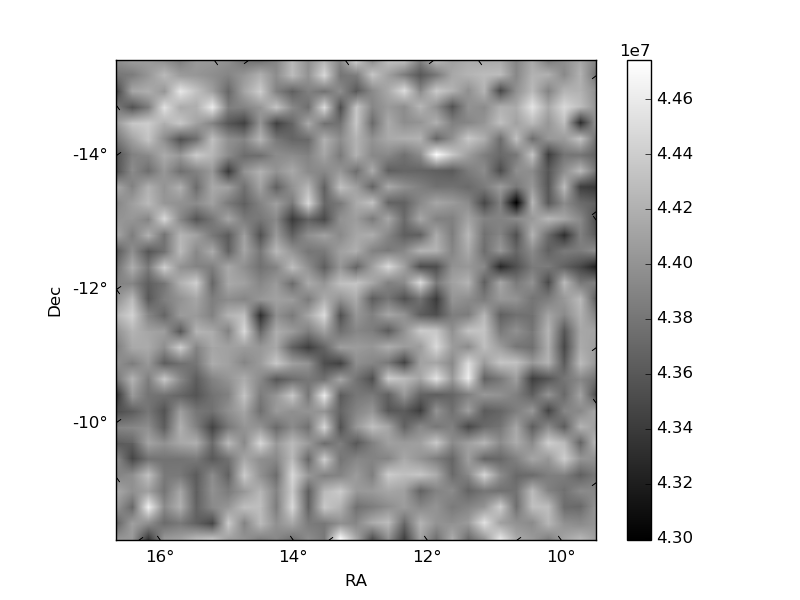
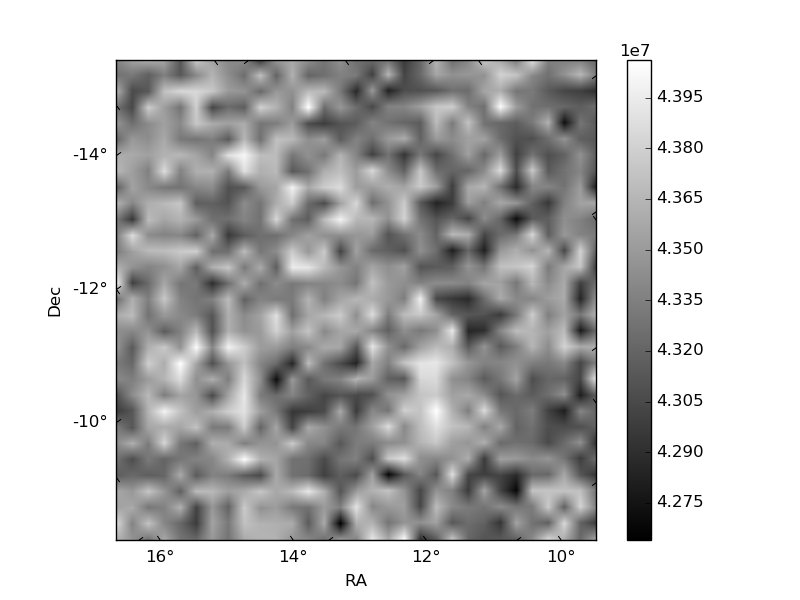
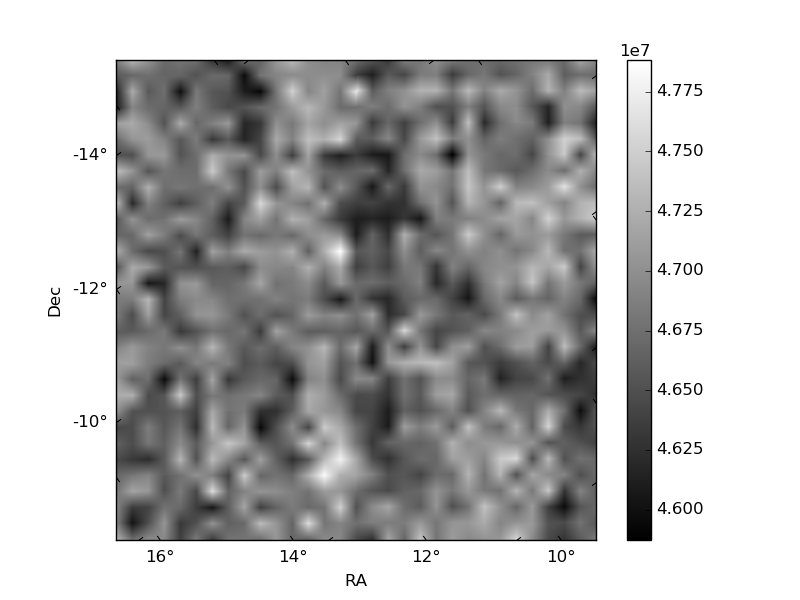
Histogram calculated using DETX and DETY for each event in the final _common_clean file
| Quadrant A | 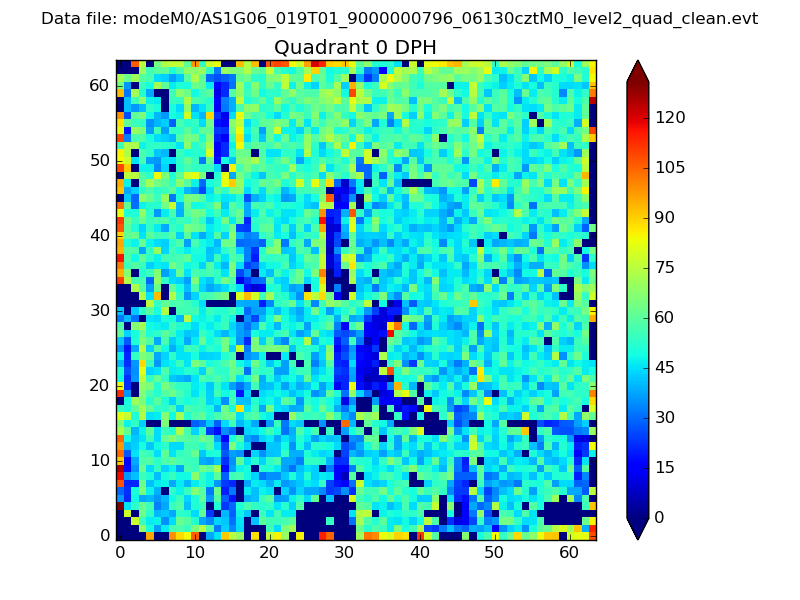 |
 |
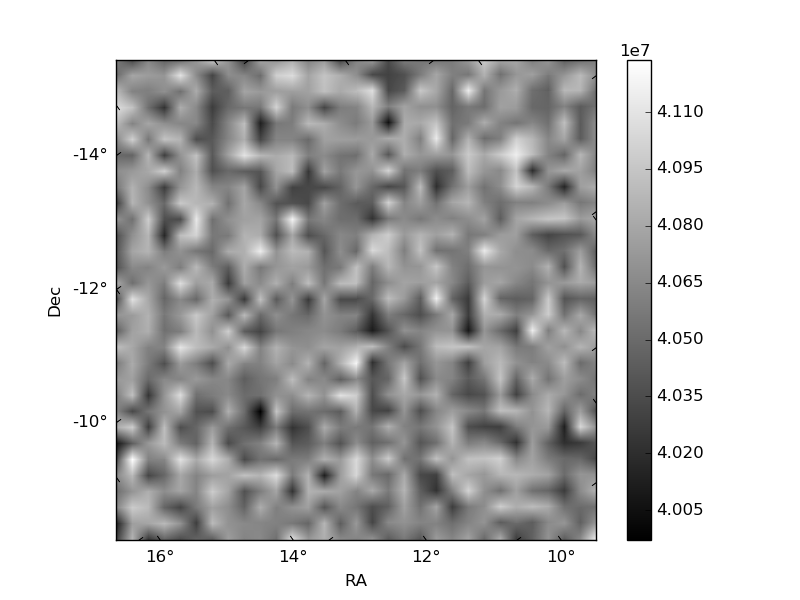
Quadrant B |
|---|---|---|---|
| Quadrant D | 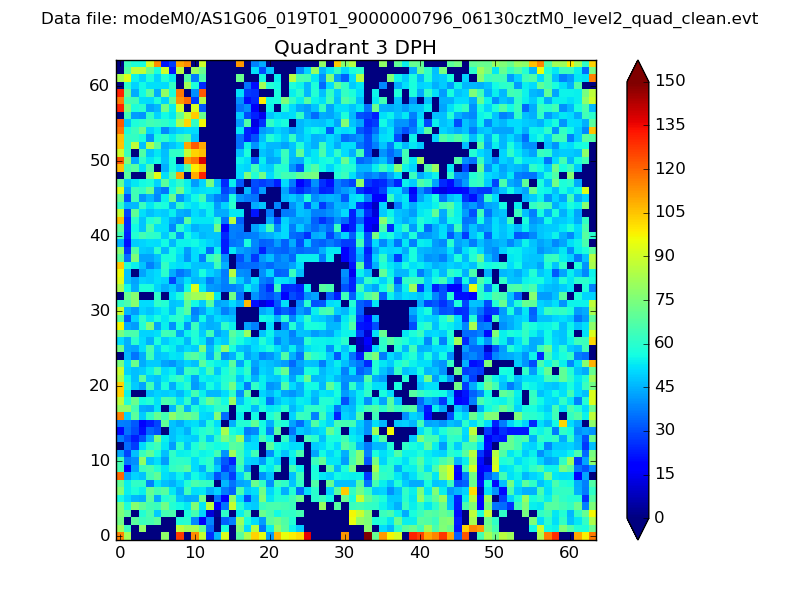 |
 |
Quadrant C |
| Plot type | Count rate plots | Images |
|---|---|---|
| Comparison with Poisson distribution Blue bars denote a histogram of data divided into 1 sec bins. Red curve is a Poisson curve with rate = median count rate of data. |
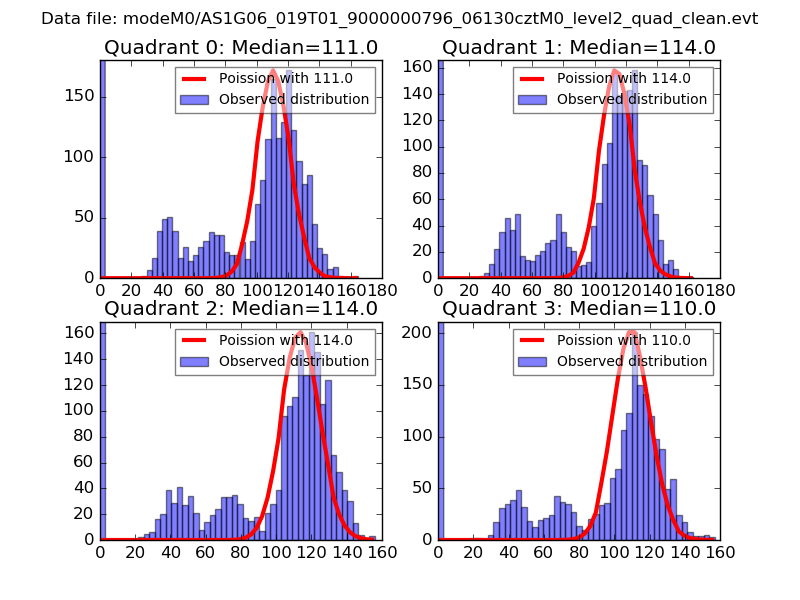 |
 |
| Quadrant-wise count rates Data is divided into 100 sec bins |
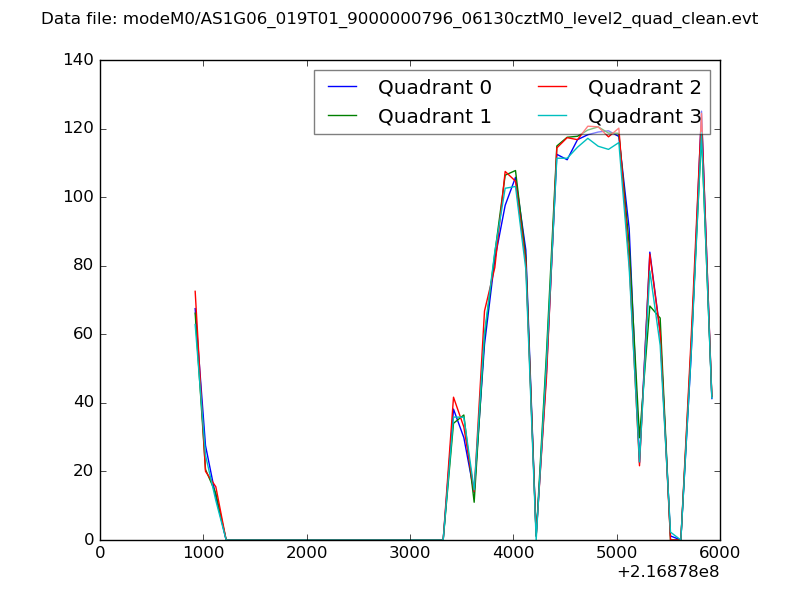 |
|
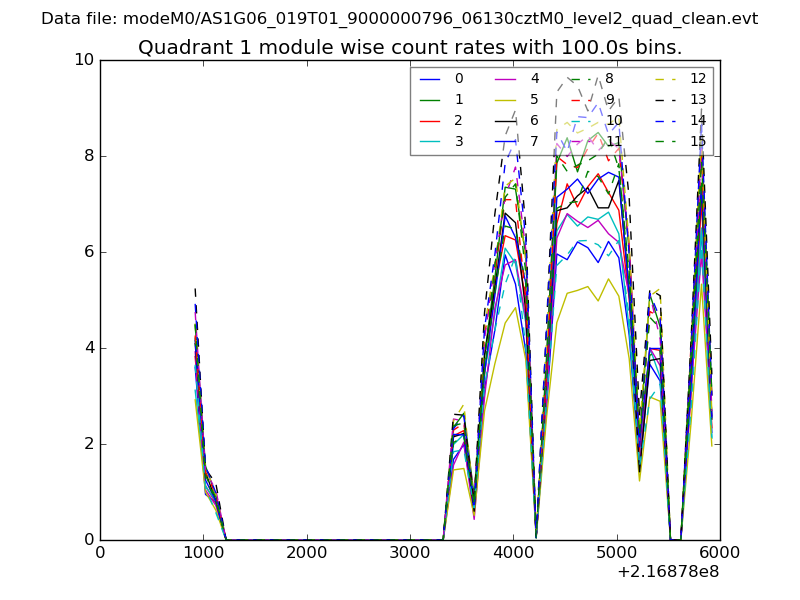
| Module-wise count rates for Quadrant A Data is divided into 100 sec bins |
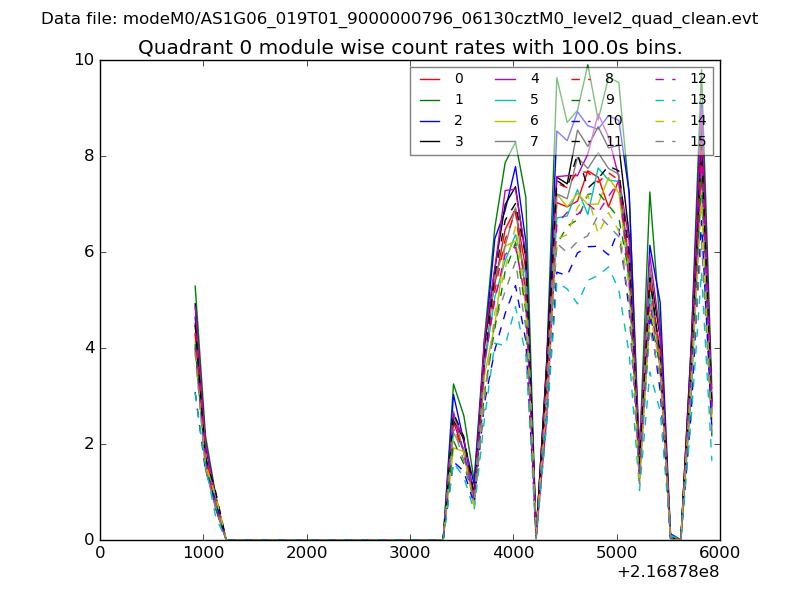 |
 |
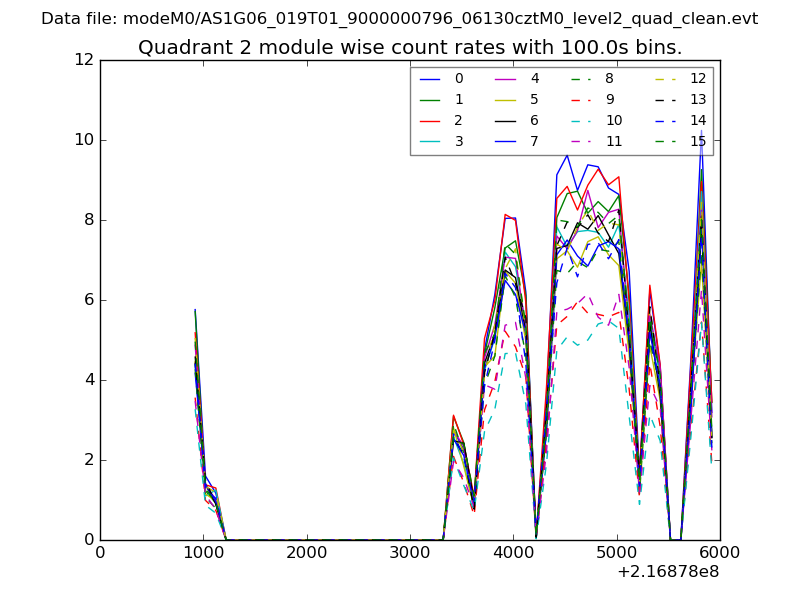
| Module-wise count rates for Quadrant B Data is divided into 100 sec bins |
 |
 |
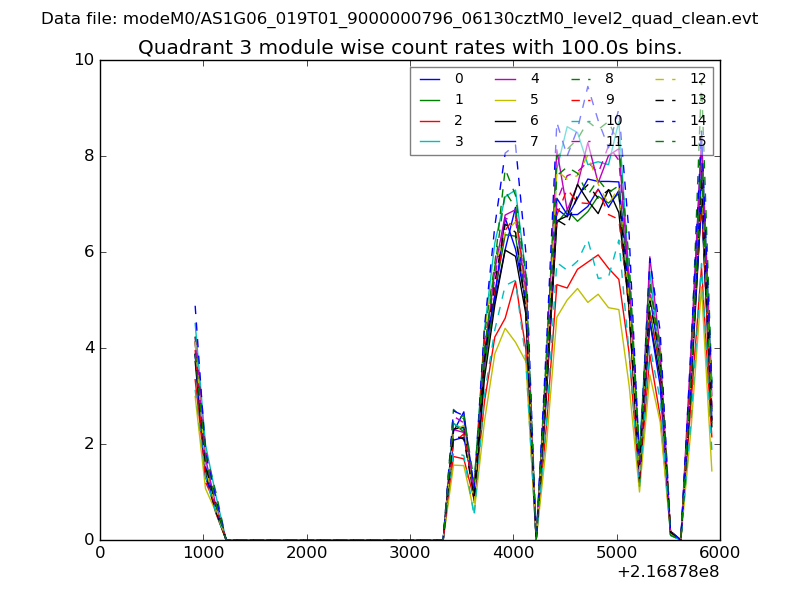
| Module-wise count rates for Quadrant C Data is divided into 100 sec bins |
 |
 |
| Module-wise count rates for Quadrant D Data is divided into 100 sec bins |
 |
 |
| Parameter | Plot |
|---|---|
| CZT HV Monitor | 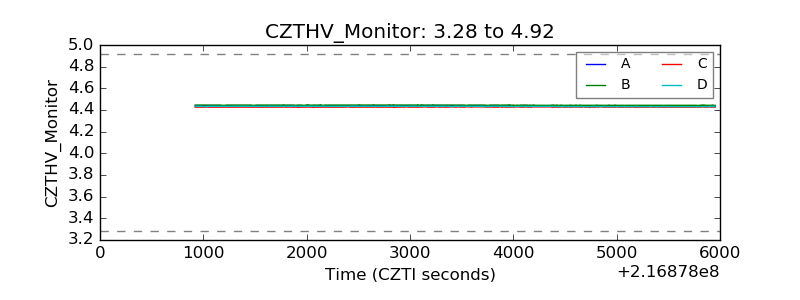 |
| D_VDD | 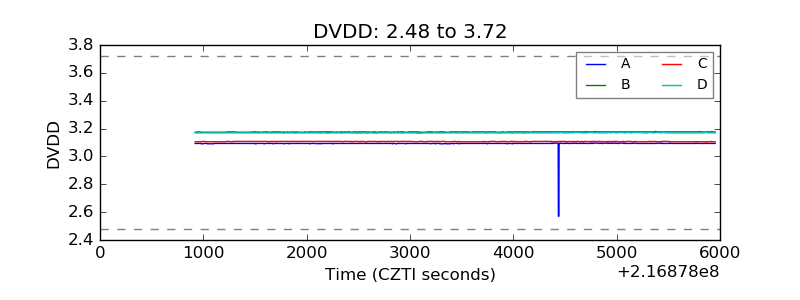 |
| Temperature 1 | 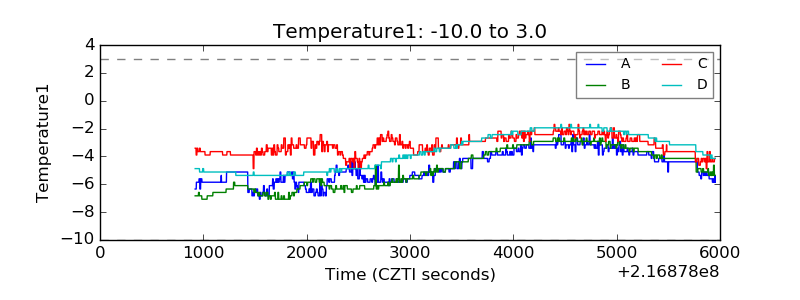 |
| Veto HV Monitor | 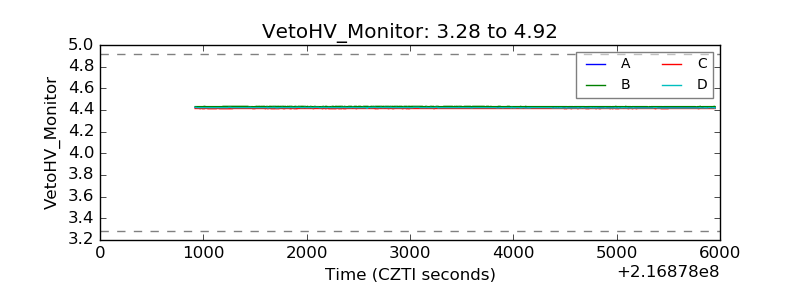 |
| Veto LLD | 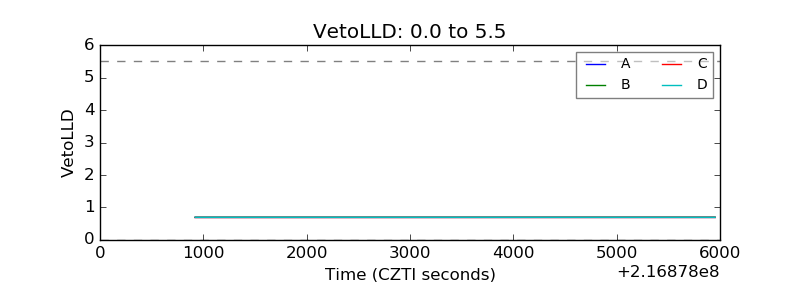 |
| Alpha Counter | 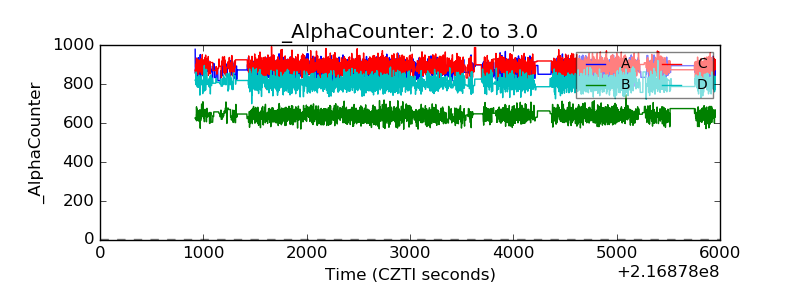 |
| _CPM_Rate | 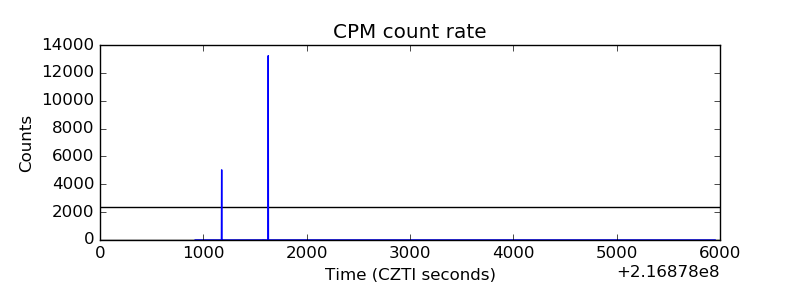 |
| CZT Counter |  |
| +2.5 Volts monitor | 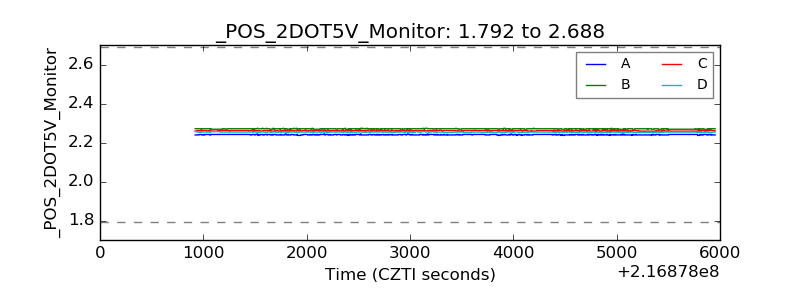 |
| +5 Volts monitor |  |
| _ROLL_ROT | 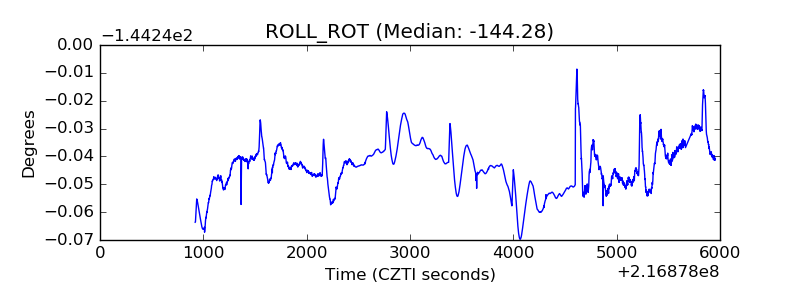 |
| _Roll_DEC | 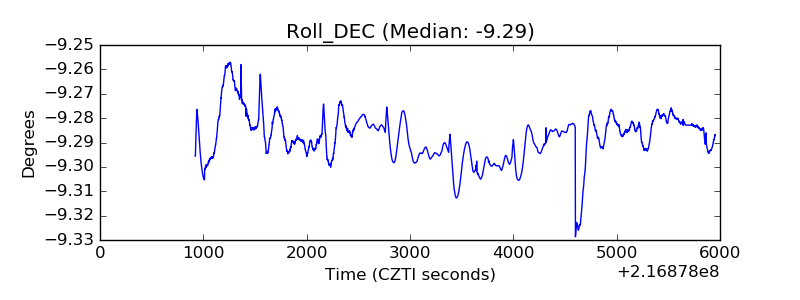 |
| _Roll_RA | 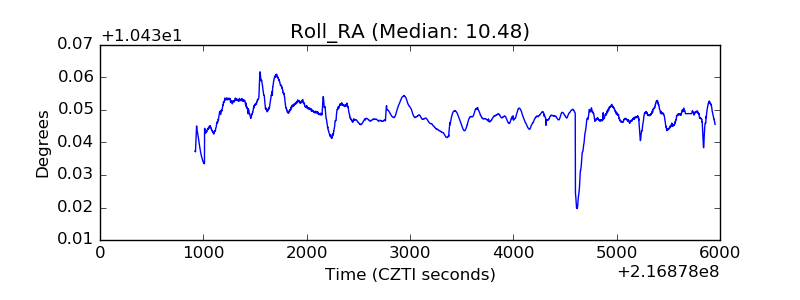 |
| Veto Counter | 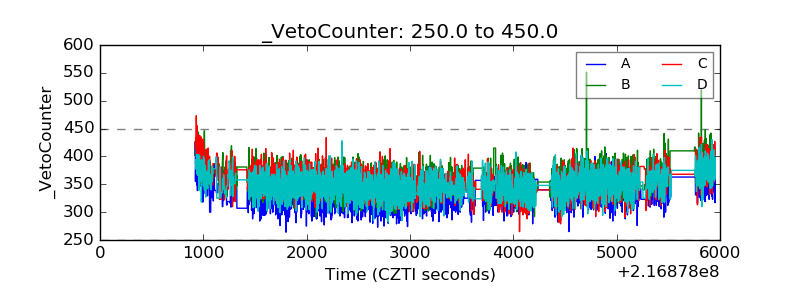 |