| Param | Original file | Final file |
|---|---|---|
| Filename | modeM0/AS1G06_019T01_9000000796_06131cztM0_level2.evt | modeM0/AS1G06_019T01_9000000796_06131cztM0_level2_quad_clean.evt |
| Size (bytes) | 1,976,048,640 | 330,160,320 |
| Size | 1.8 GB | 314.9 MB |
| Events in quadrant A | 13,634,535 | 2,020,056 |
| Events in quadrant B | 18,360,597 | 1,978,410 |
| Events in quadrant C | 12,950,231 | 2,040,024 |
| Events in quadrant D | 12,948,060 | 1,977,346 |
| Mode M9 | |||
|---|---|---|---|
| Quadrant | BADHDUFLAG | Total packets | Discarded packets |
| A | 0 | 23 | 0 |
| B | 0 | 23 | 0 |
| C | 0 | 23 | 1 |
| D | 0 | 23 | 0 |
| Mode M0 | |||
|---|---|---|---|
| Quadrant | BADHDUFLAG | Total packets | Discarded packets |
| A | 0 | 63334 | 3081 |
| B | 0 | 78985 | 5147 |
| C | 0 | 62085 | 2899 |
| D | 0 | 63225 | 3040 |
| Mode SS | |||
|---|---|---|---|
| Quadrant | BADHDUFLAG | Total packets | Discarded packets |
| A | 0 | 613 | 25 |
| B | 0 | 614 | 28 |
| C | 0 | 614 | 24 |
| D | 0 | 614 | 34 |
| Quadrant | Total seconds | Saturated seconds | Saturation percentage |
|---|---|---|---|
| A | 28891 | 309 | 1.069537% |
| B | 28639 | 2025 | 7.070778% |
| C | 28886 | 270 | 0.934709% |
| D | 28909 | 263 | 0.909751% |
Noise dominated data is calculated using 1-second bins in cleaned event files. If a bin has >2000 counts, and if more than 50% of those come from <1% of pixels, then it is considered to be noise-dominated and hence unusable.
| Quadrant | # 1 sec bins | Bins with >0 counts | Bins with >2000 counts | High rate bins dominated by noise | Noise dominated (total time) | Noise dominated (detector-on time) | Marked lightcurve |
|---|---|---|---|---|---|---|---|
| A | 32585 | 29743 | 10 | 10 | 0.03% | 0.03% | 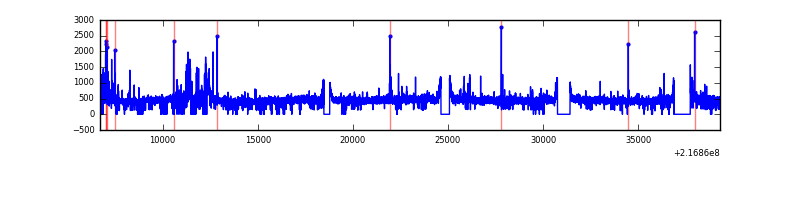 |
| B | 32585 | 29585 | 981 | 981 | 3.01% | 3.32% | 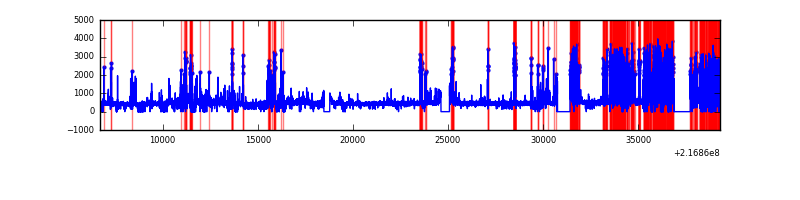 |
| C | 32585 | 29757 | 1 | 1 | 0.00% | 0.00% | 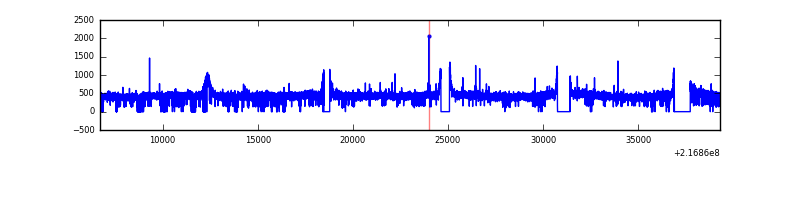 |
| D | 32585 | 29733 | 40 | 40 | 0.12% | 0.13% | 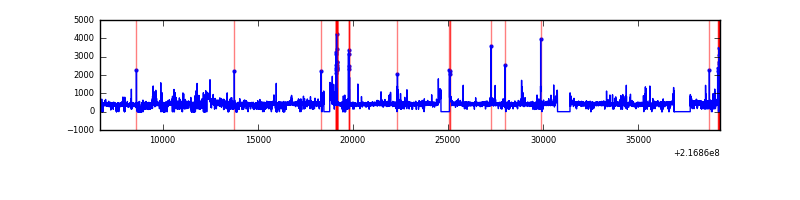 |
Top three noisy pixels from each quadrant. If the there are fewer than three noisy pixels in the level2.evt file, extra rows are filled as -1
| Pixel properties | Quadrant properties | ||||||
|---|---|---|---|---|---|---|---|
| Quadrant | DetID | PixID | Counts | Sigma | Mean | Median | Sigma |
| A | 8 | 15 | 592615 | 853.41 | 3355 | 3281 | 690.6 |
| A | 4 | 2 | 104121 | 146.02 | 3355 | 3281 | 690.6 |
| A | 0 | 226 | 32014 | 41.61 | 3355 | 3281 | 690.6 |
| B | 3 | 64 | 4930467 | 7731.81 | 3295 | 3209 | 637.3 |
| B | 15 | 85 | 284135 | 440.83 | 3295 | 3209 | 637.3 |
| B | 15 | 204 | 153644 | 236.06 | 3295 | 3209 | 637.3 |
| C | 1 | 16 | 111841 | 141.81 | 3277 | 3289 | 765.5 |
| C | 13 | 61 | 26058 | 29.75 | 3277 | 3289 | 765.5 |
| C | 8 | 128 | 17609 | 18.71 | 3277 | 3289 | 765.5 |
| D | 13 | 169 | 273969 | 336.12 | 3277 | 3170 | 805.7 |
| D | 8 | 195 | 102191 | 122.91 | 3277 | 3170 | 805.7 |
| D | 2 | 206 | 60064 | 70.62 | 3277 | 3170 | 805.7 |
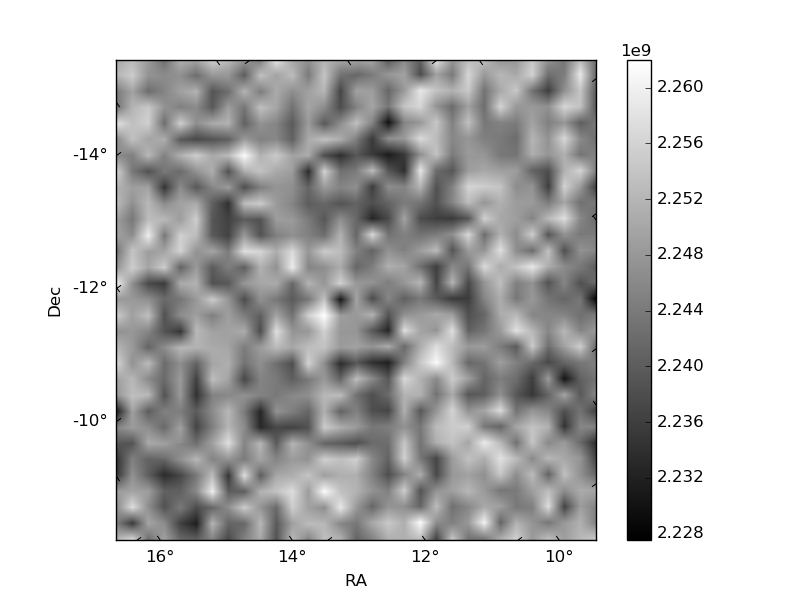
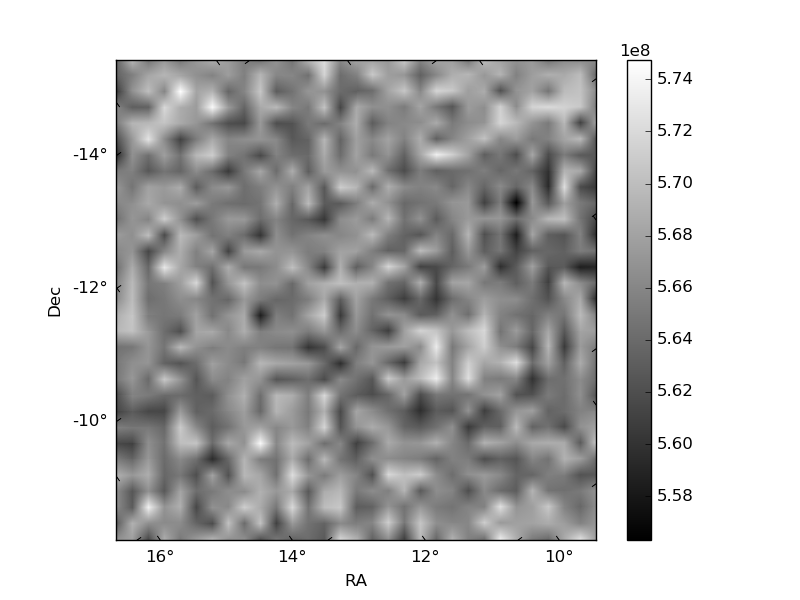
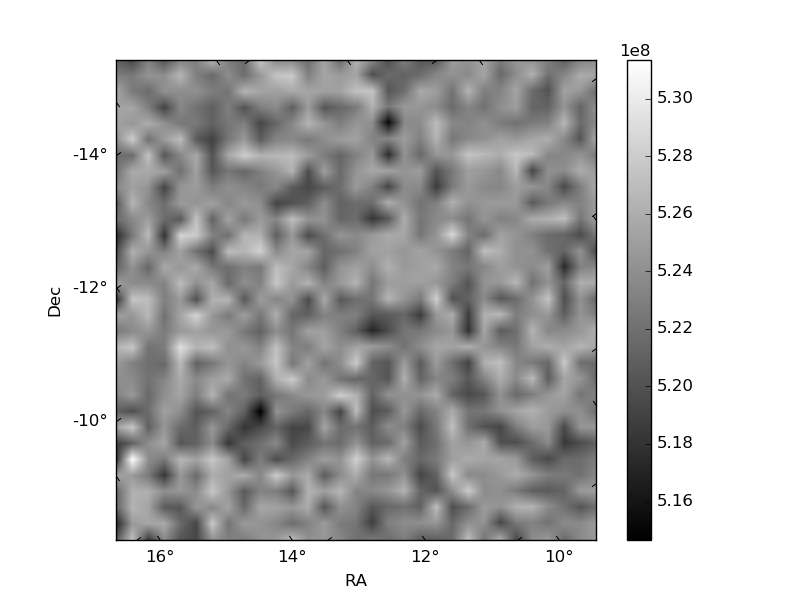
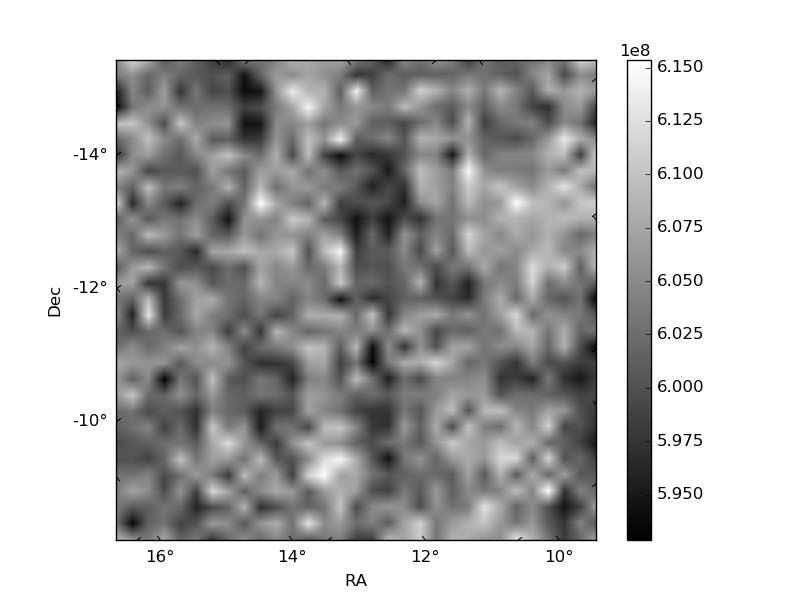
Histogram calculated using DETX and DETY for each event in the final _common_clean file
| Quadrant A | 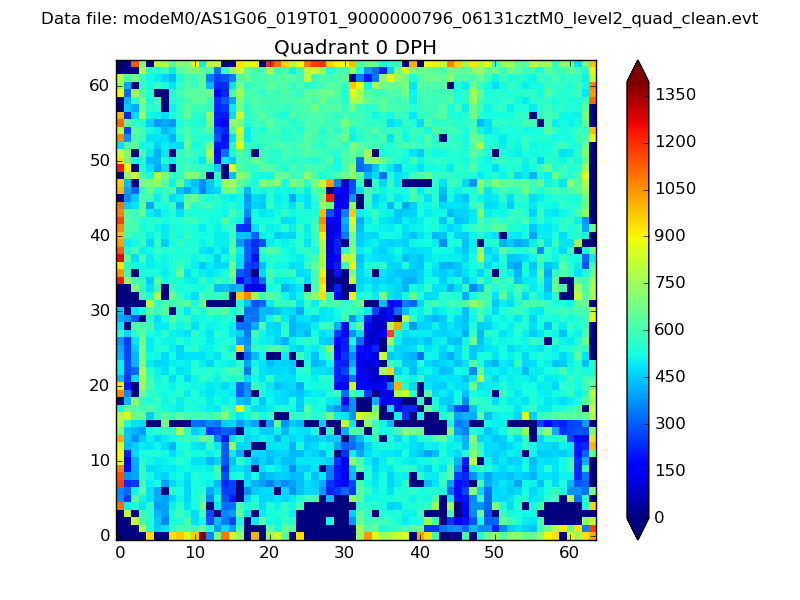 |
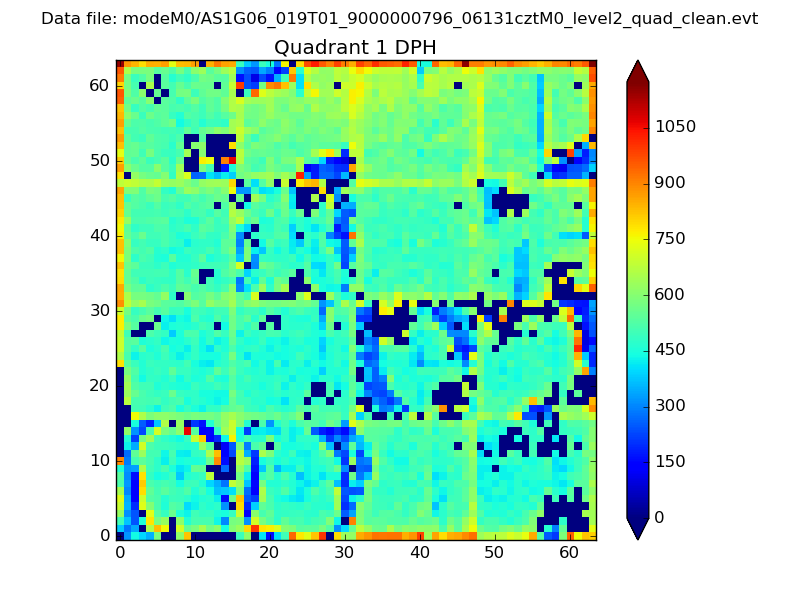 |
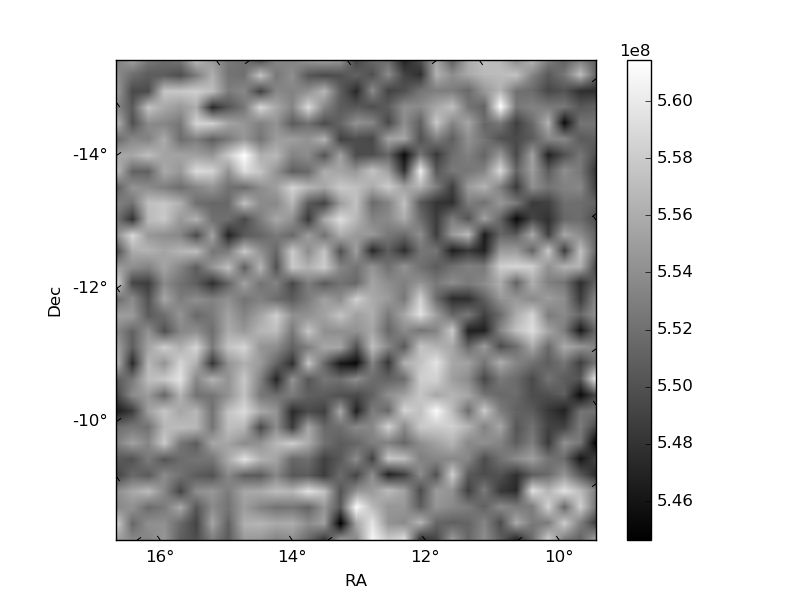
Quadrant B |
|---|---|---|---|
| Quadrant D | 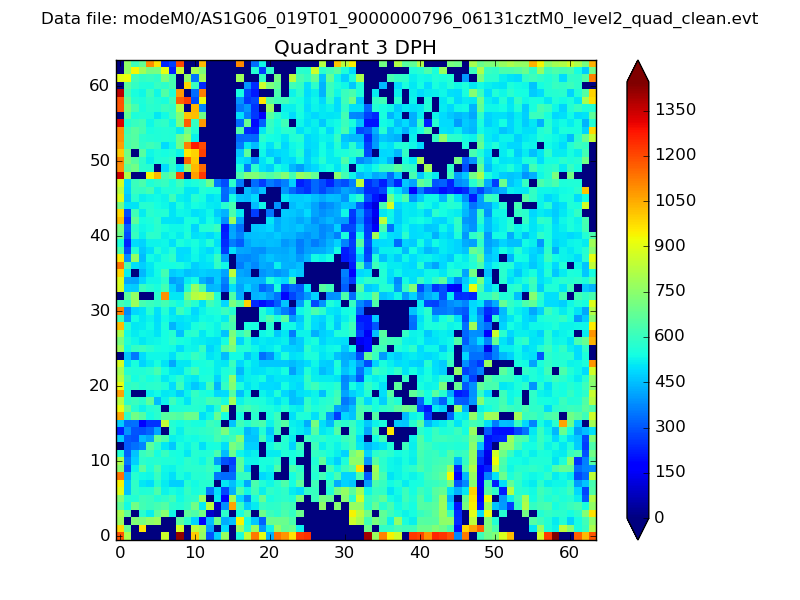 |
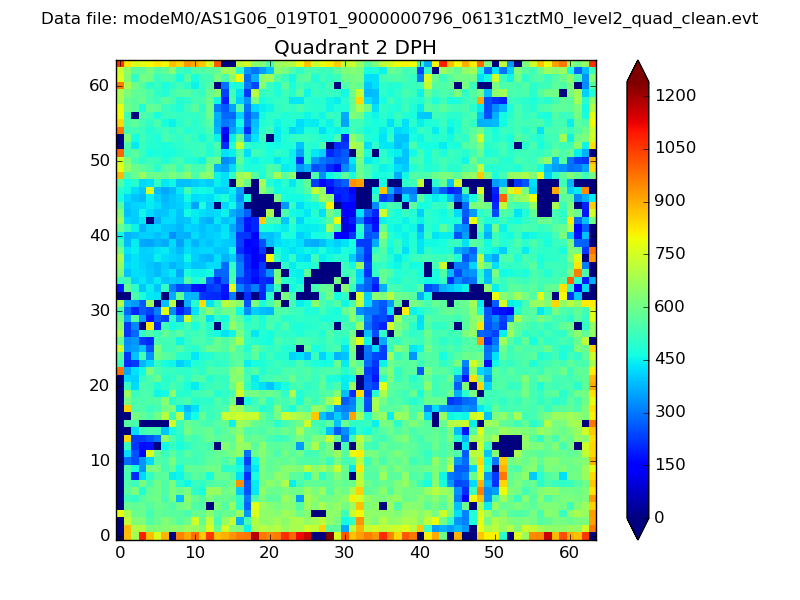 |
Quadrant C |
| Plot type | Count rate plots | Images |
|---|---|---|
| Comparison with Poisson distribution Blue bars denote a histogram of data divided into 1 sec bins. Red curve is a Poisson curve with rate = median count rate of data. |
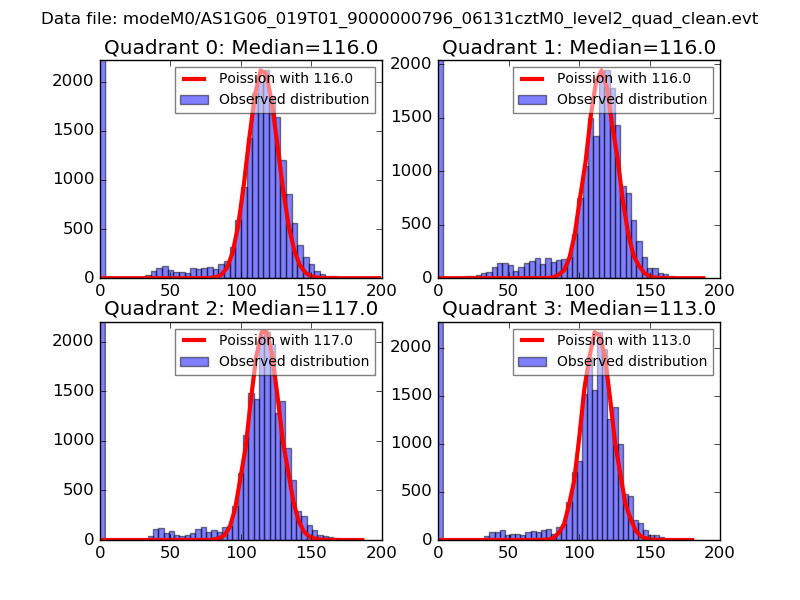 |
 |
| Quadrant-wise count rates Data is divided into 100 sec bins |
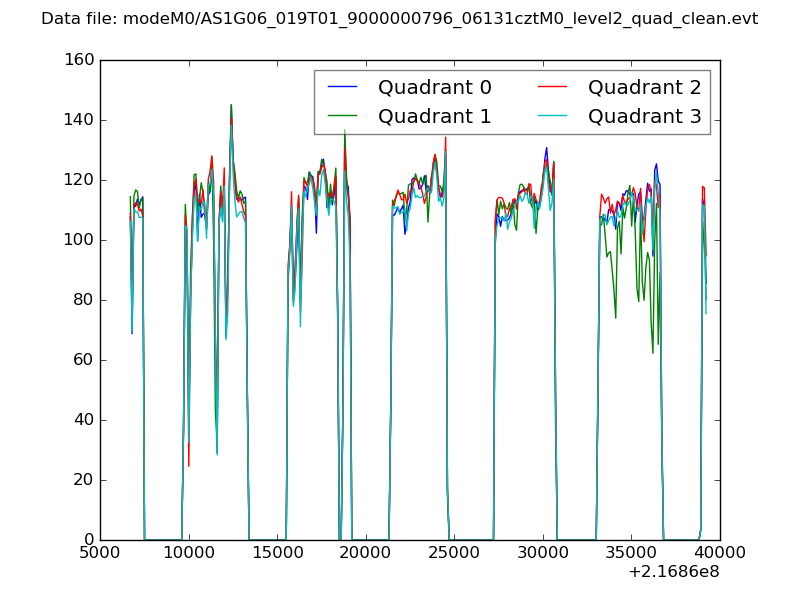 |
|
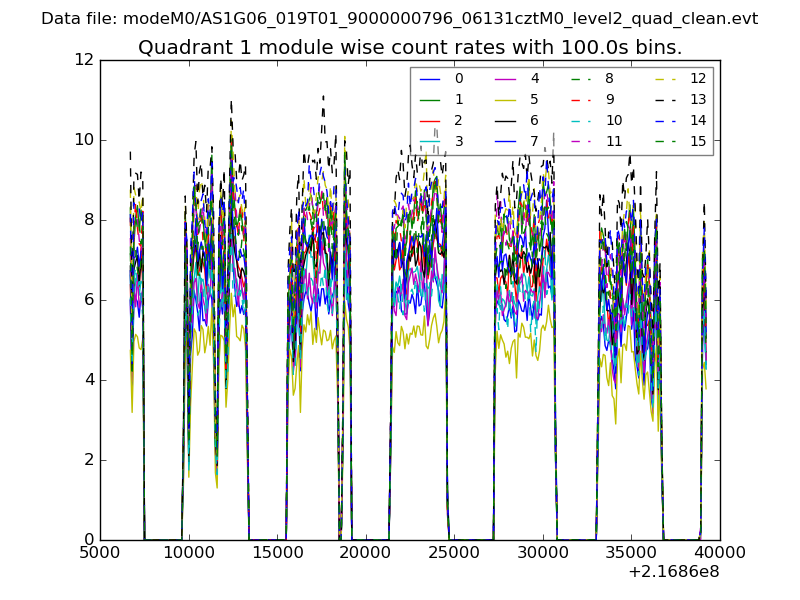
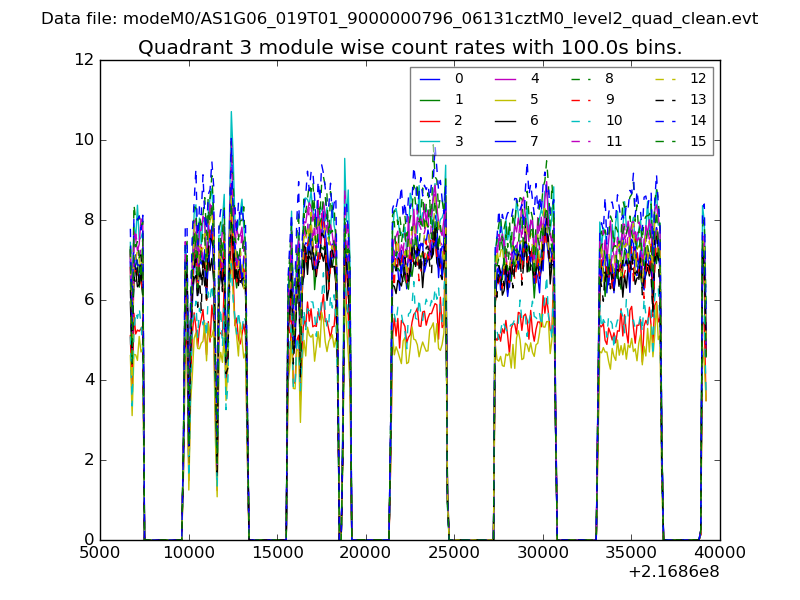
| Module-wise count rates for Quadrant A Data is divided into 100 sec bins |
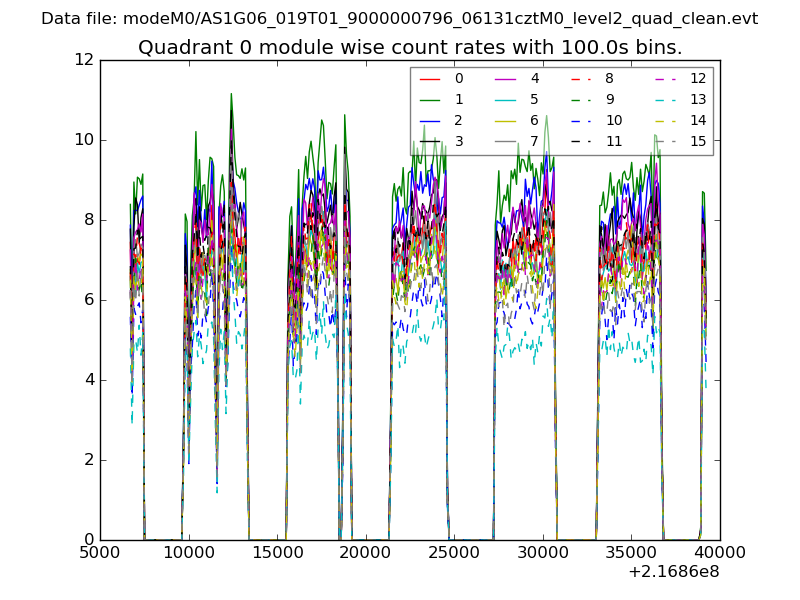 |
 |
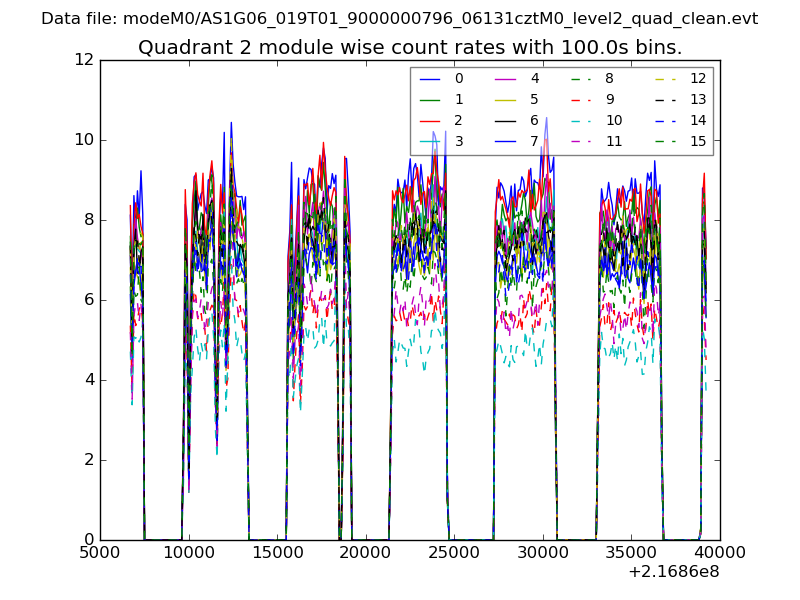
| Module-wise count rates for Quadrant B Data is divided into 100 sec bins |
 |
 |
| Module-wise count rates for Quadrant C Data is divided into 100 sec bins |
 |
 |
| Module-wise count rates for Quadrant D Data is divided into 100 sec bins |
 |
 |
| Parameter | Plot |
|---|---|
| CZT HV Monitor | 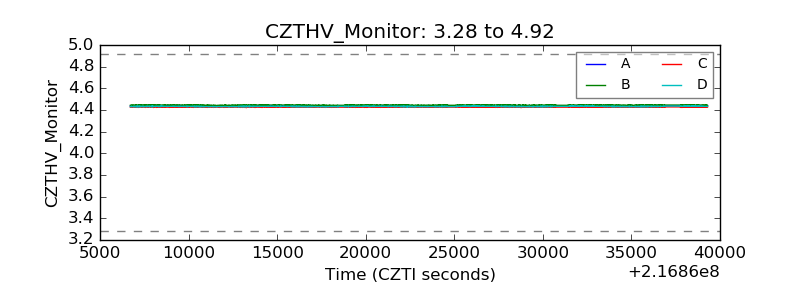 |
| D_VDD | 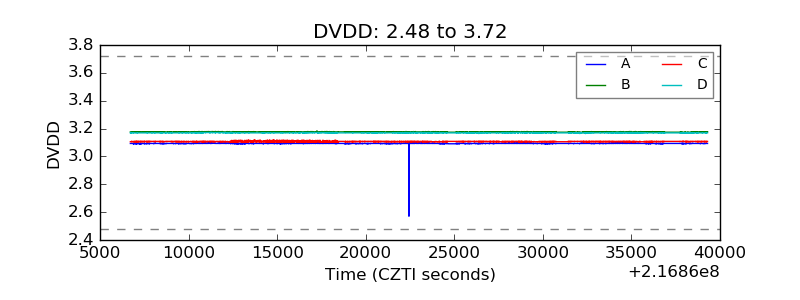 |
| Temperature 1 | 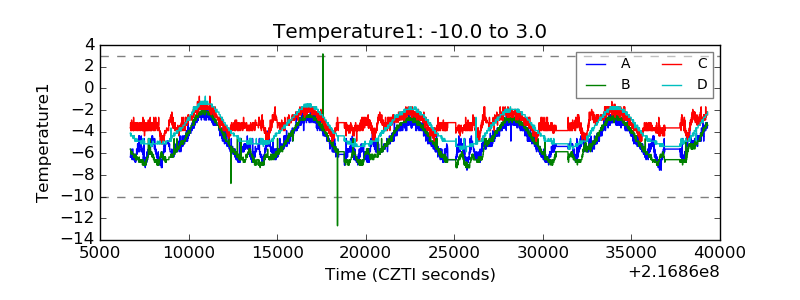 |
| Veto HV Monitor | 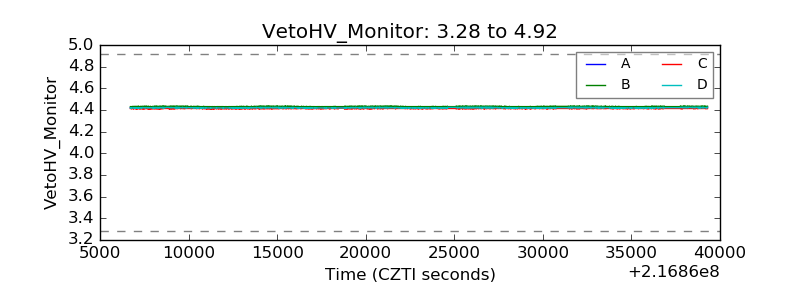 |
| Veto LLD | 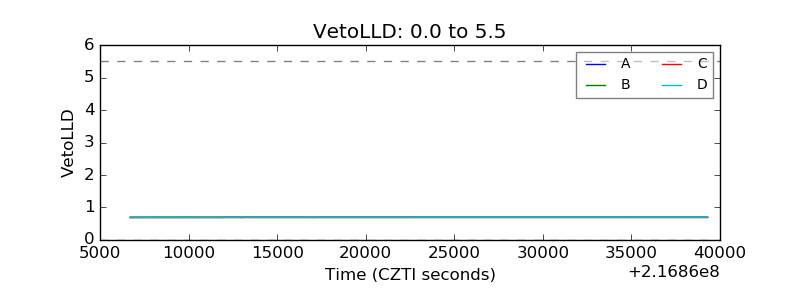 |
| Alpha Counter | 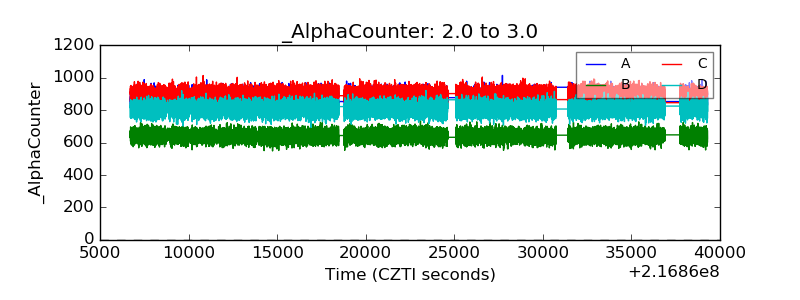 |
| _CPM_Rate | 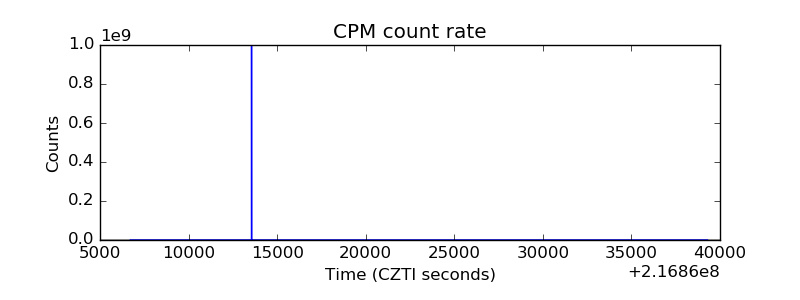 |
| CZT Counter | 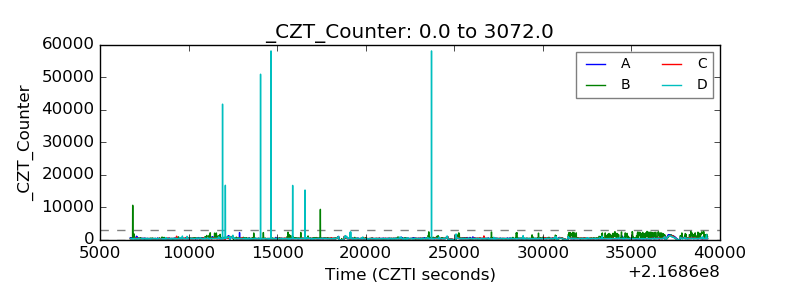 |
| +2.5 Volts monitor |  |
| +5 Volts monitor | 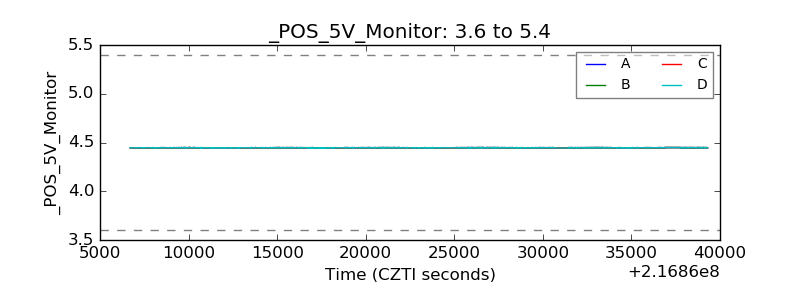 |
| _ROLL_ROT | 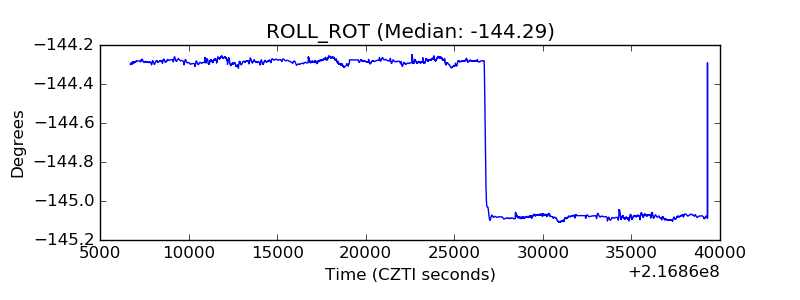 |
| _Roll_DEC | 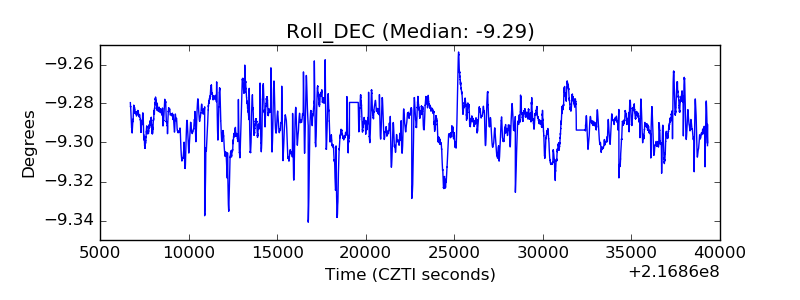 |
| _Roll_RA | 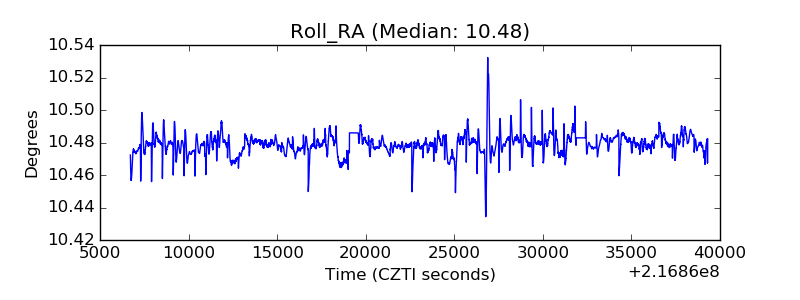 |
| Veto Counter | 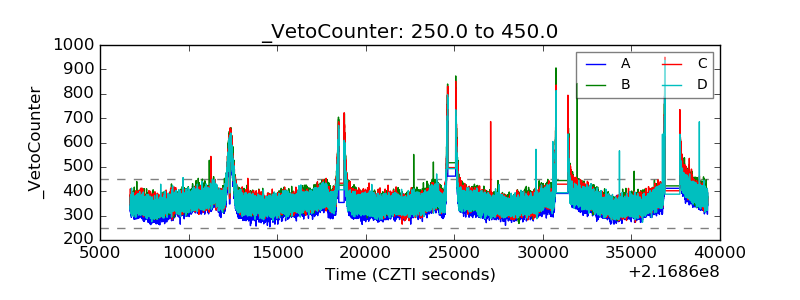 |