| Param | Original file | Final file |
|---|---|---|
| Filename | modeM0/AS1G06_019T01_9000000796_06132cztM0_level2.evt | modeM0/AS1G06_019T01_9000000796_06132cztM0_level2_quad_clean.evt |
| Size (bytes) | 2,440,670,400 | 419,253,120 |
| Size | 2.3 GB | 399.8 MB |
| Events in quadrant A | 16,813,127 | 2,577,863 |
| Events in quadrant B | 22,438,016 | 2,555,386 |
| Events in quadrant C | 15,921,030 | 2,605,354 |
| Events in quadrant D | 16,346,066 | 2,521,482 |
| Mode M9 | |||
|---|---|---|---|
| Quadrant | BADHDUFLAG | Total packets | Discarded packets |
| A | 0 | 33 | 0 |
| B | 0 | 33 | 0 |
| C | 0 | 33 | 0 |
| D | 0 | 33 | 0 |
| Mode M0 | |||
|---|---|---|---|
| Quadrant | BADHDUFLAG | Total packets | Discarded packets |
| A | 0 | 74189 | 33 |
| B | 0 | 90592 | 75 |
| C | 0 | 72789 | 40 |
| D | 0 | 75110 | 52 |
| Mode SS | |||
|---|---|---|---|
| Quadrant | BADHDUFLAG | Total packets | Discarded packets |
| A | 0 | 720 | 0 |
| B | 0 | 720 | 0 |
| C | 0 | 720 | 0 |
| D | 0 | 720 | 0 |
| Quadrant | Total seconds | Saturated seconds | Saturation percentage |
|---|---|---|---|
| A | 35492 | 406 | 1.143920% |
| B | 35485 | 2381 | 6.709877% |
| C | 35487 | 342 | 0.963733% |
| D | 35485 | 404 | 1.138509% |
Noise dominated data is calculated using 1-second bins in cleaned event files. If a bin has >2000 counts, and if more than 50% of those come from <1% of pixels, then it is considered to be noise-dominated and hence unusable.
| Quadrant | # 1 sec bins | Bins with >0 counts | Bins with >2000 counts | High rate bins dominated by noise | Noise dominated (total time) | Noise dominated (detector-on time) | Marked lightcurve |
|---|---|---|---|---|---|---|---|
| A | 38788 | 35505 | 15 | 15 | 0.04% | 0.04% | 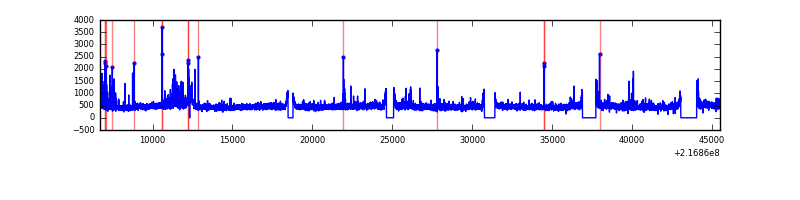 |
| B | 38788 | 35503 | 1193 | 1193 | 3.08% | 3.36% | 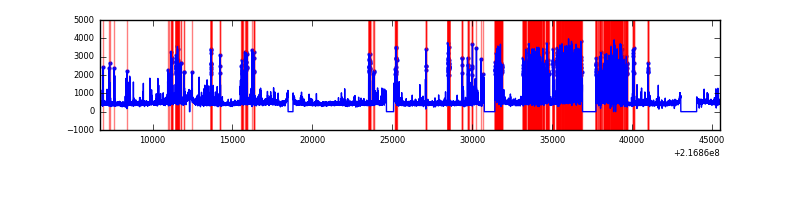 |
| C | 38788 | 35505 | 1 | 1 | 0.00% | 0.00% | 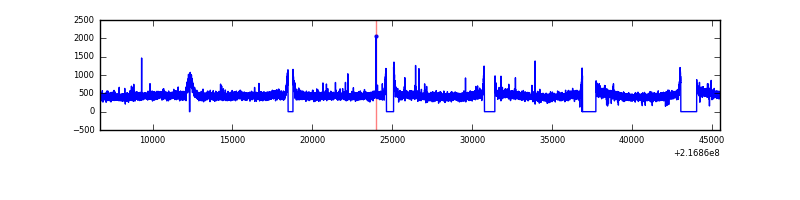 |
| D | 38788 | 35507 | 91 | 91 | 0.23% | 0.26% | 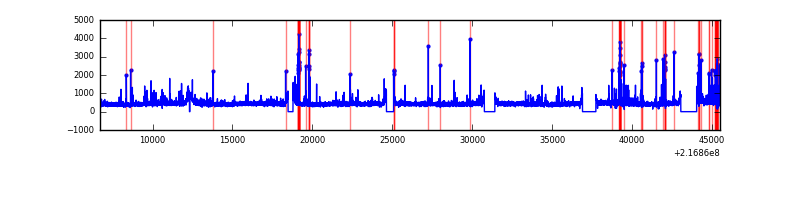 |
Top three noisy pixels from each quadrant. If the there are fewer than three noisy pixels in the level2.evt file, extra rows are filled as -1
| Pixel properties | Quadrant properties | ||||||
|---|---|---|---|---|---|---|---|
| Quadrant | DetID | PixID | Counts | Sigma | Mean | Median | Sigma |
| A | 8 | 15 | 708324 | 829.95 | 4135 | 4044 | 848.6 |
| A | 4 | 2 | 142113 | 162.71 | 4135 | 4044 | 848.6 |
| A | 0 | 254 | 42206 | 44.97 | 4135 | 4044 | 848.6 |
| B | 3 | 64 | 5776744 | 7294.75 | 4101 | 4000 | 791.4 |
| B | 15 | 85 | 307878 | 384.0 | 4101 | 4000 | 791.4 |
| B | 15 | 204 | 203687 | 252.33 | 4101 | 4000 | 791.4 |
| C | 1 | 16 | 118984 | 122.05 | 4035 | 4052 | 941.7 |
| C | 13 | 61 | 32098 | 29.78 | 4035 | 4052 | 941.7 |
| C | 8 | 128 | 19323 | 16.22 | 4035 | 4052 | 941.7 |
| D | 13 | 169 | 637857 | 640.0 | 4034 | 3910 | 990.5 |
| D | 8 | 195 | 149702 | 147.18 | 4034 | 3910 | 990.5 |
| D | 5 | 97 | 92345 | 89.28 | 4034 | 3910 | 990.5 |
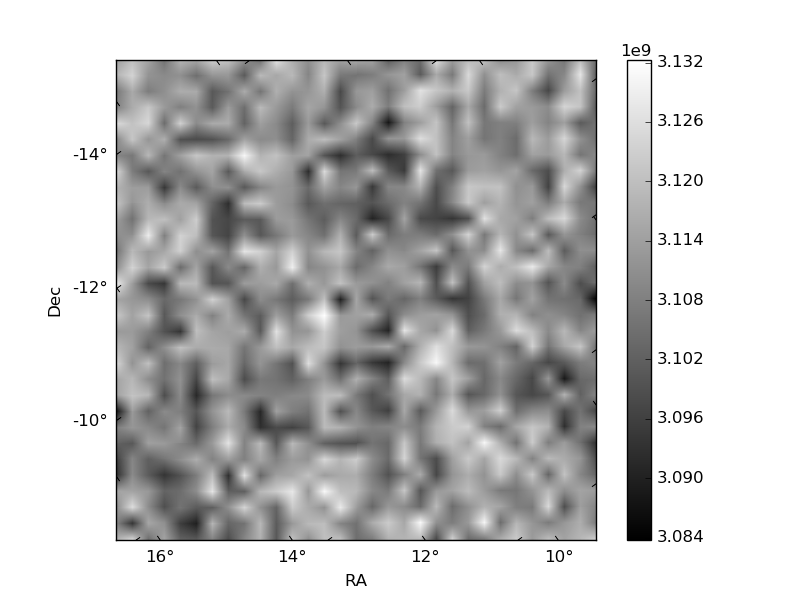
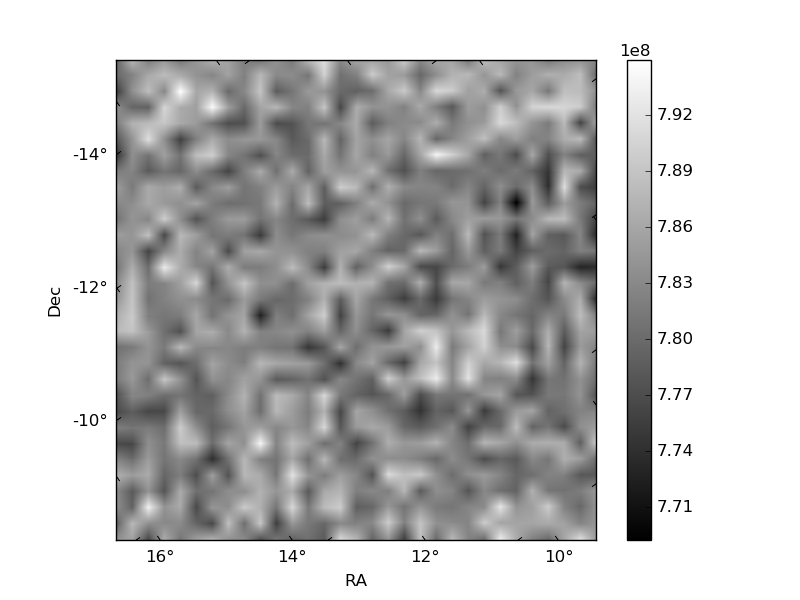
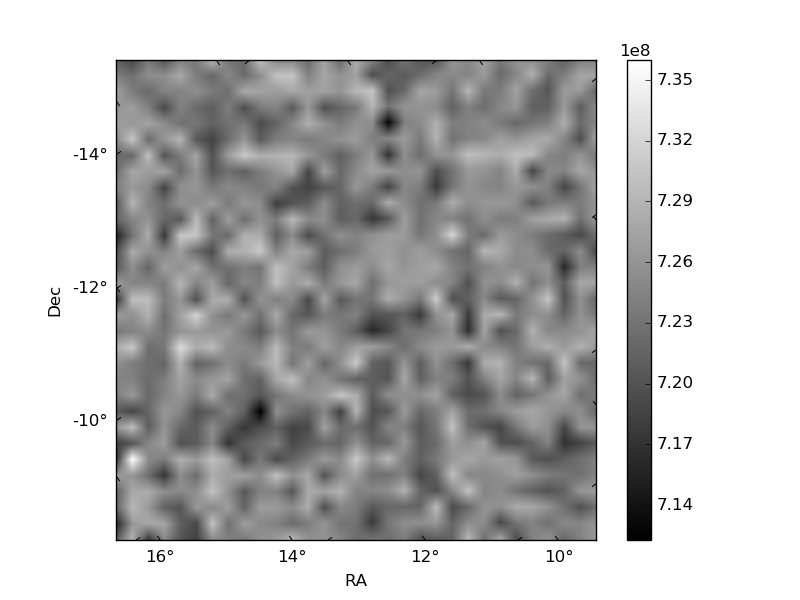
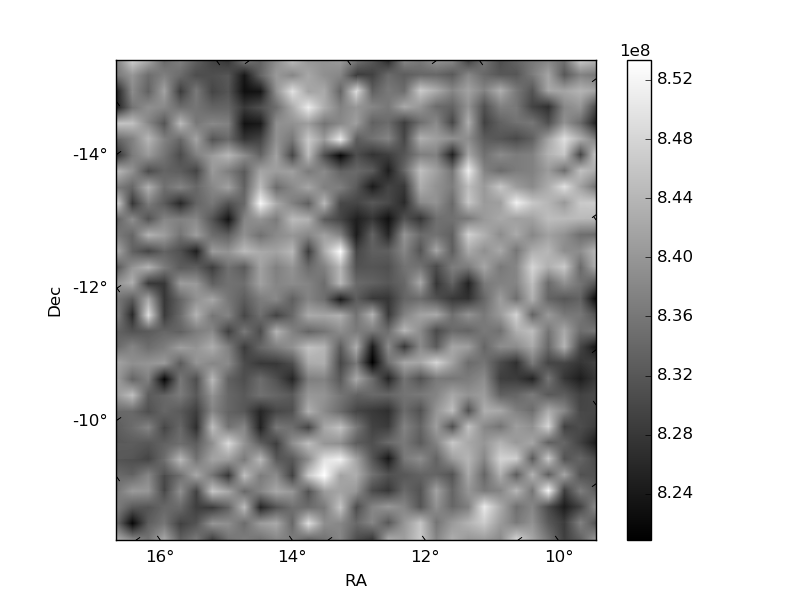
Histogram calculated using DETX and DETY for each event in the final _common_clean file
| Quadrant A | 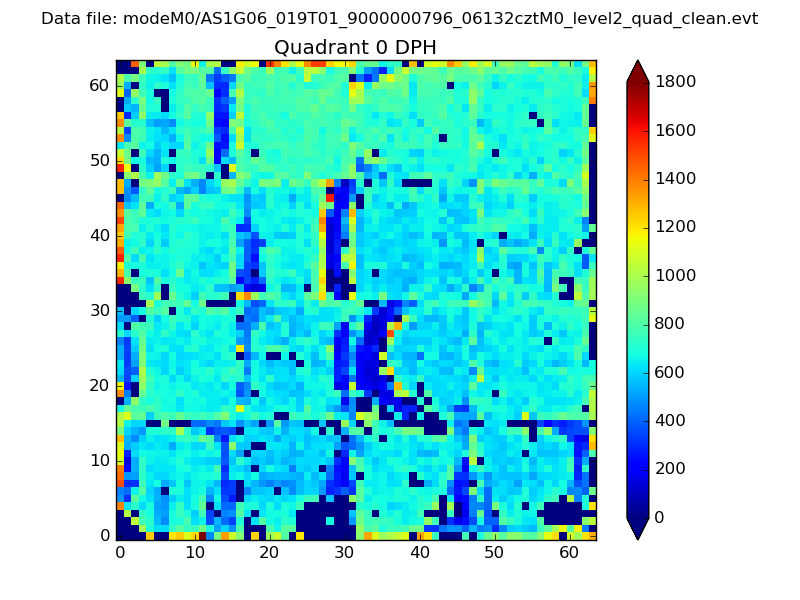 |
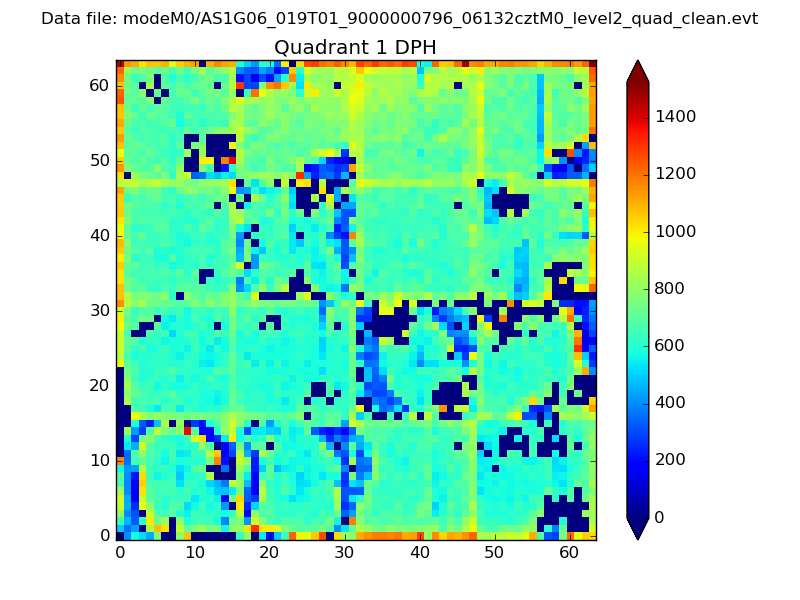 |
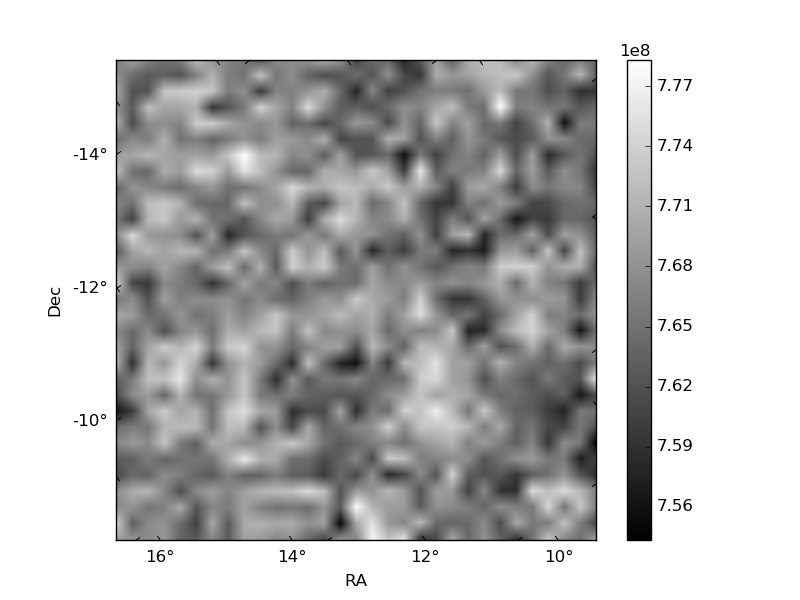
Quadrant B |
|---|---|---|---|
| Quadrant D | 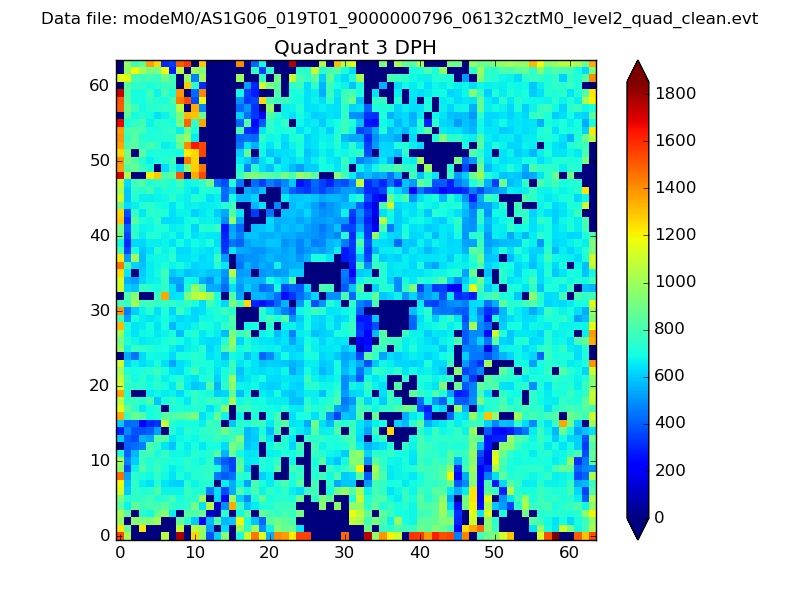 |
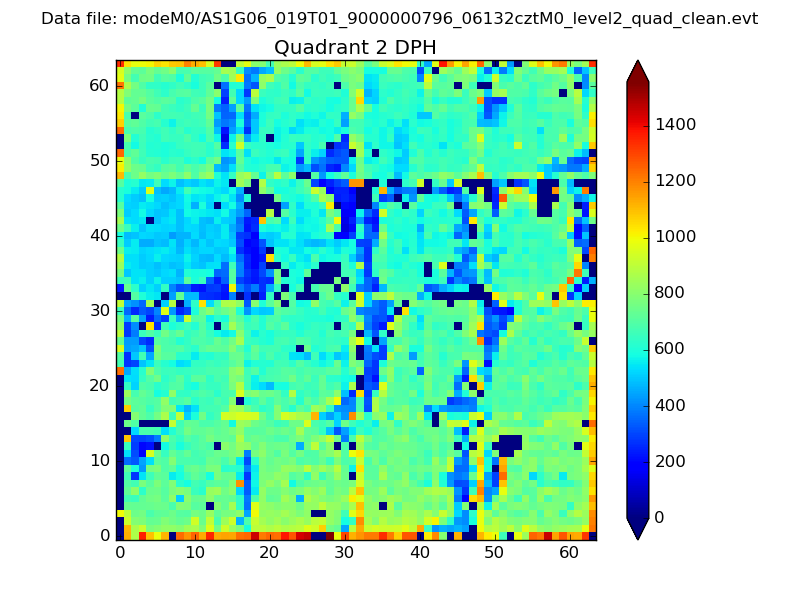 |
Quadrant C |
| Plot type | Count rate plots | Images |
|---|---|---|
| Comparison with Poisson distribution Blue bars denote a histogram of data divided into 1 sec bins. Red curve is a Poisson curve with rate = median count rate of data. |
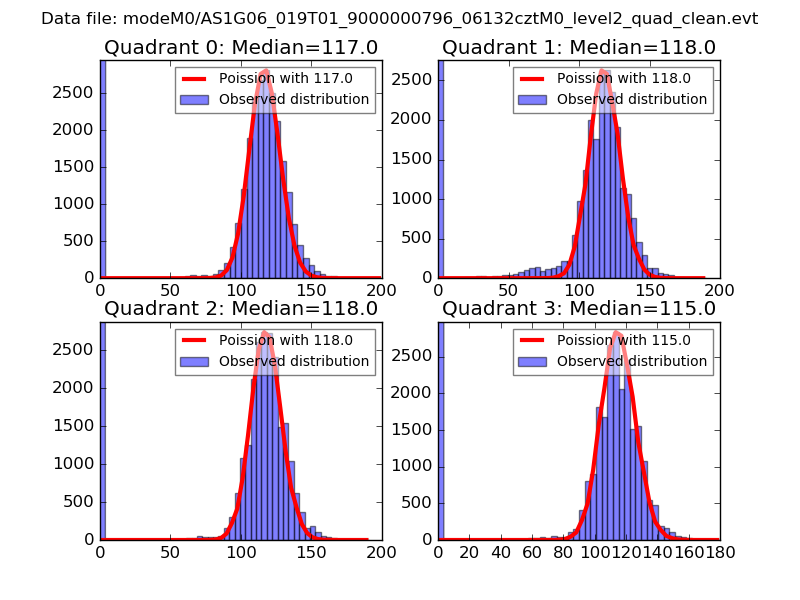 |
 |
| Quadrant-wise count rates Data is divided into 100 sec bins |
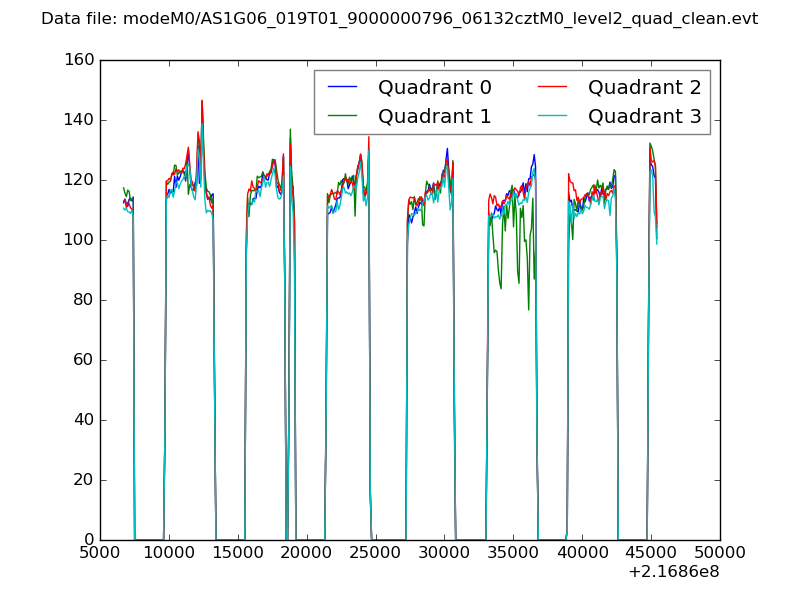 |
|
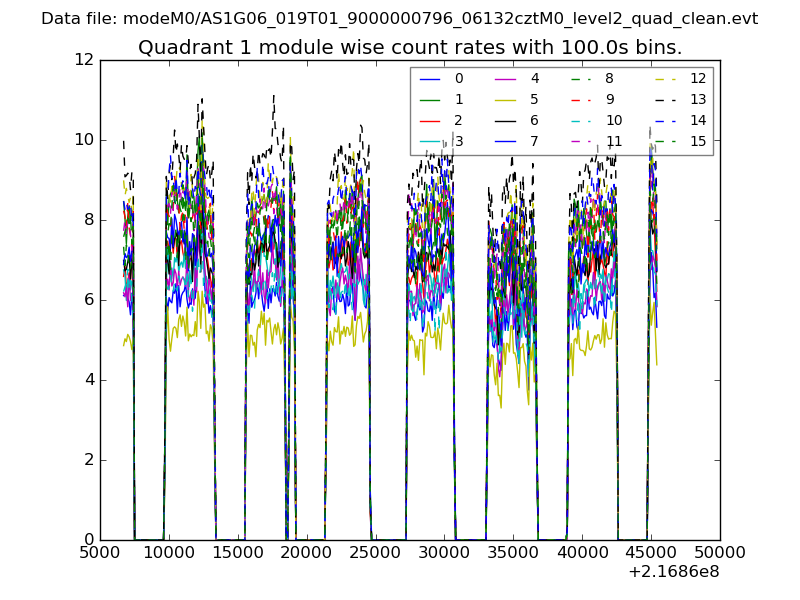
| Module-wise count rates for Quadrant A Data is divided into 100 sec bins |
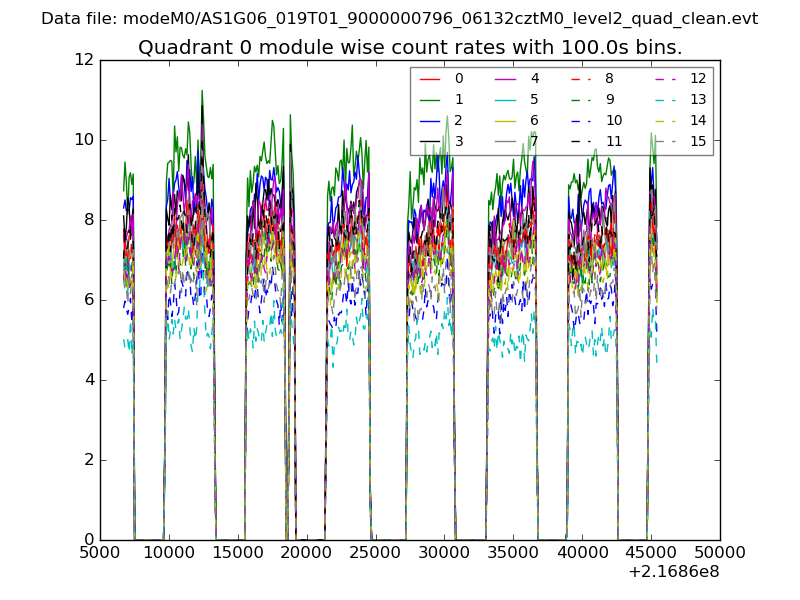 |
 |
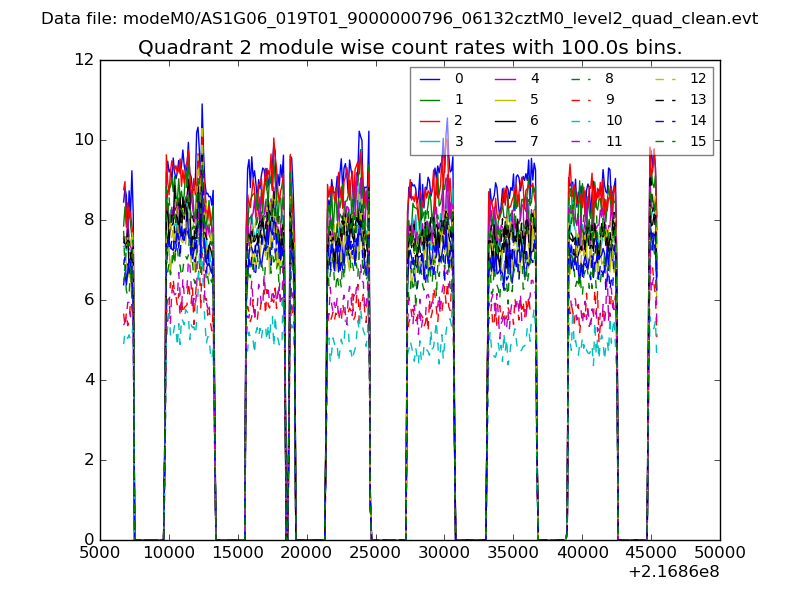
| Module-wise count rates for Quadrant B Data is divided into 100 sec bins |
 |
 |
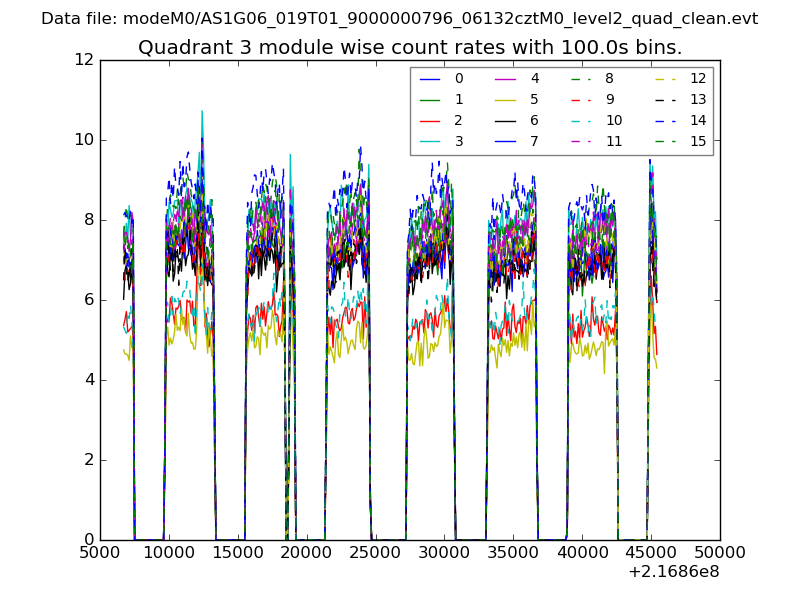
| Module-wise count rates for Quadrant C Data is divided into 100 sec bins |
 |
 |
| Module-wise count rates for Quadrant D Data is divided into 100 sec bins |
 |
 |
| Parameter | Plot |
|---|---|
| CZT HV Monitor | 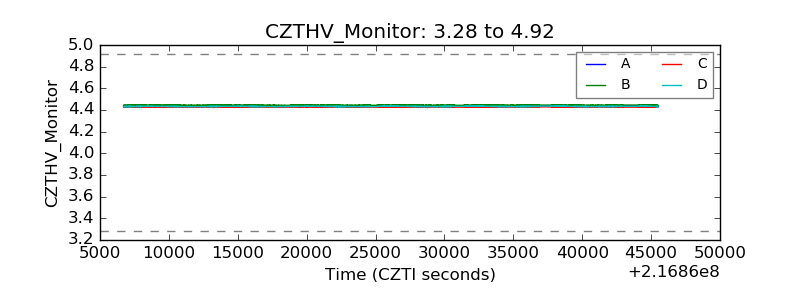 |
| D_VDD | 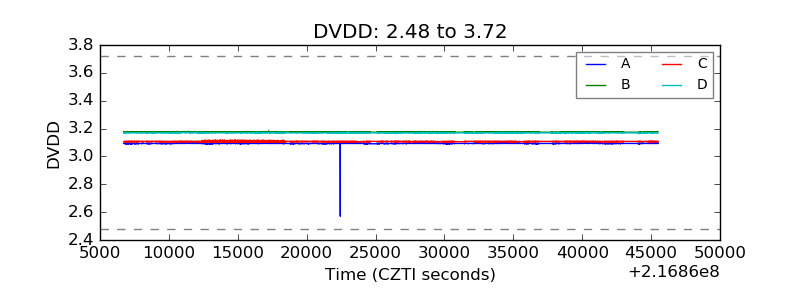 |
| Temperature 1 | 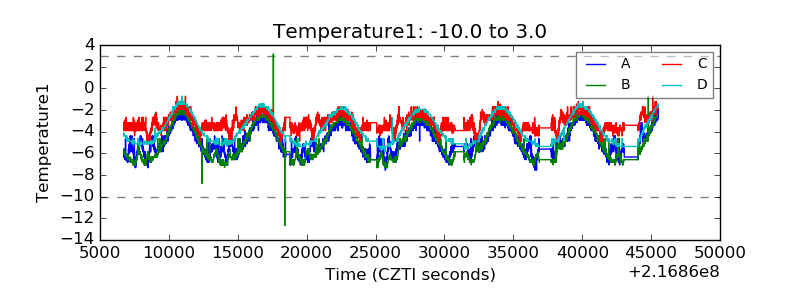 |
| Veto HV Monitor | 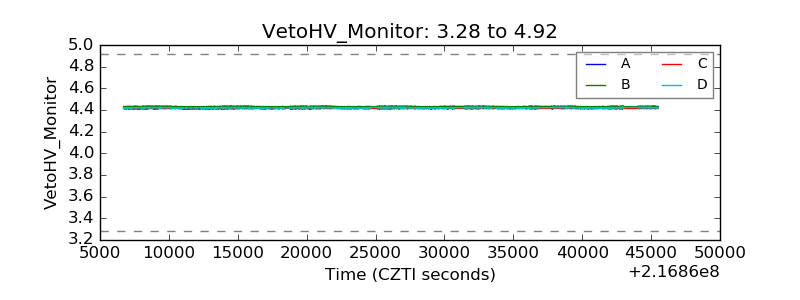 |
| Veto LLD | 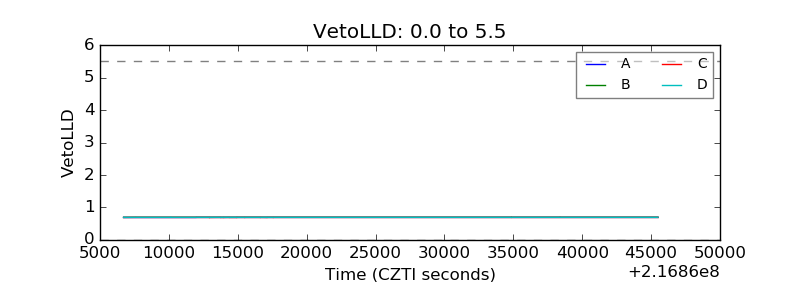 |
| Alpha Counter | 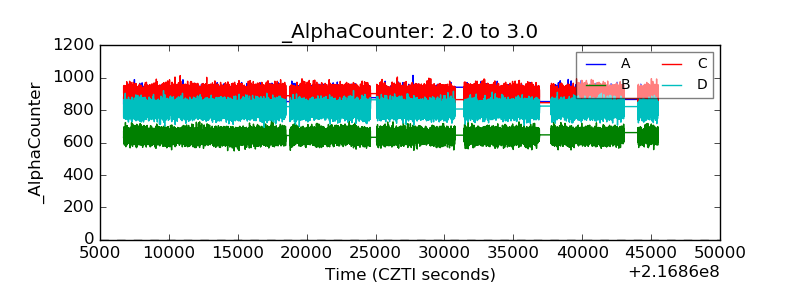 |
| _CPM_Rate | 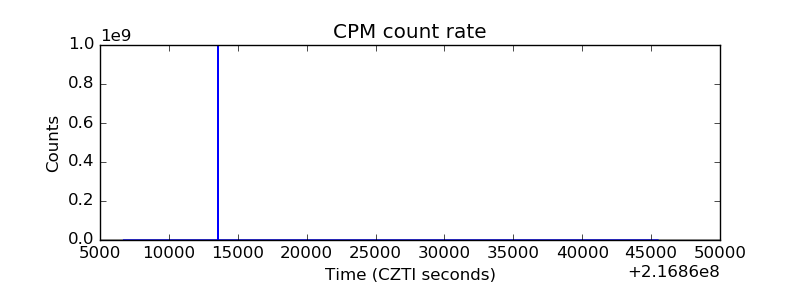 |
| CZT Counter | 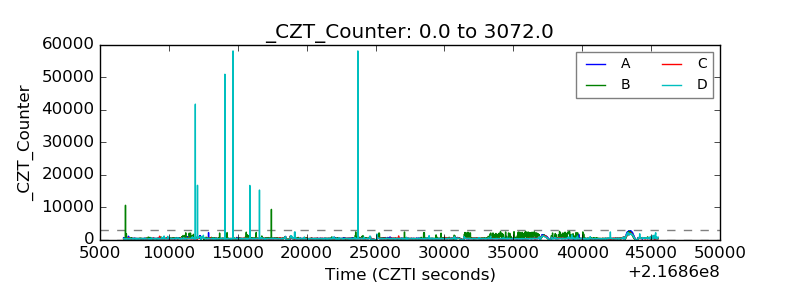 |
| +2.5 Volts monitor |  |
| +5 Volts monitor |  |
| _ROLL_ROT | 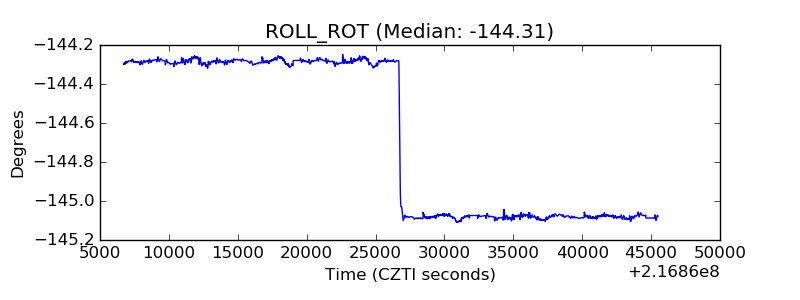 |
| _Roll_DEC | 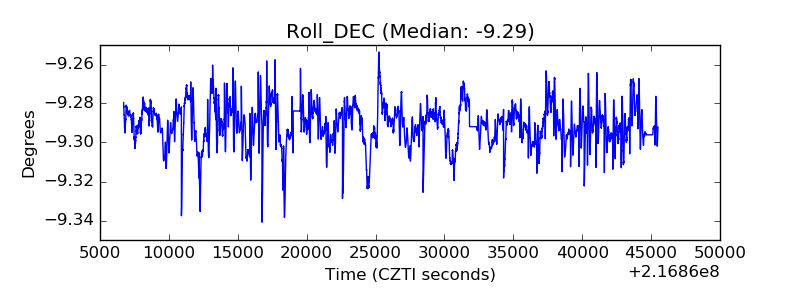 |
| _Roll_RA | 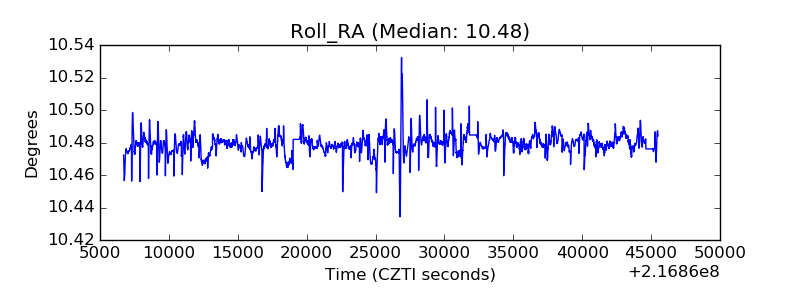 |
| Veto Counter | 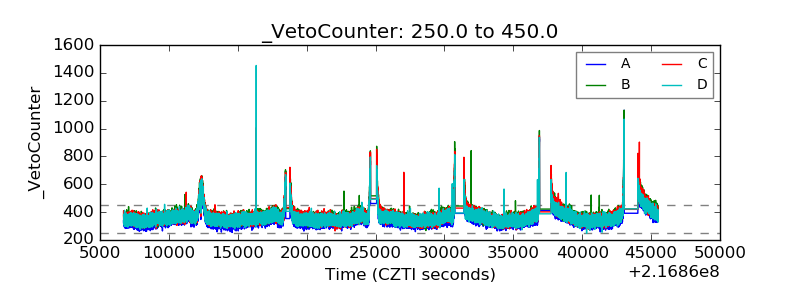 |