| Param | Original file | Final file |
|---|---|---|
| Filename | modeM0/AS1G06_019T01_9000000796_06135cztM0_level2.evt | modeM0/AS1G06_019T01_9000000796_06135cztM0_level2_quad_clean.evt |
| Size (bytes) | 457,801,920 | 98,311,680 |
| Size | 436.6 MB | 93.8 MB |
| Events in quadrant A | 3,262,402 | 642,403 |
| Events in quadrant B | 3,566,309 | 651,856 |
| Events in quadrant C | 3,068,468 | 632,279 |
| Events in quadrant D | 3,537,642 | 609,609 |
| Mode M9 | |||
|---|---|---|---|
| Quadrant | BADHDUFLAG | Total packets | Discarded packets |
| A | 0 | 23 | 0 |
| B | 0 | 23 | 0 |
| C | 0 | 23 | 0 |
| D | 0 | 23 | 0 |
| Mode M0 | |||
|---|---|---|---|
| Quadrant | BADHDUFLAG | Total packets | Discarded packets |
| A | 0 | 13822 | 3 |
| B | 0 | 14659 | 7 |
| C | 0 | 13450 | 10 |
| D | 0 | 14659 | 15 |
| Mode SS | |||
|---|---|---|---|
| Quadrant | BADHDUFLAG | Total packets | Discarded packets |
| A | 0 | 132 | 0 |
| B | 0 | 132 | 2 |
| C | 0 | 132 | 0 |
| D | 0 | 132 | 0 |
| Quadrant | Total seconds | Saturated seconds | Saturation percentage |
|---|---|---|---|
| A | 6323 | 158 | 2.498814% |
| B | 6321 | 197 | 3.116595% |
| C | 6320 | 102 | 1.613924% |
| D | 6318 | 162 | 2.564103% |
Noise dominated data is calculated using 1-second bins in cleaned event files. If a bin has >2000 counts, and if more than 50% of those come from <1% of pixels, then it is considered to be noise-dominated and hence unusable.
| Quadrant | # 1 sec bins | Bins with >0 counts | Bins with >2000 counts | High rate bins dominated by noise | Noise dominated (total time) | Noise dominated (detector-on time) | Marked lightcurve |
|---|---|---|---|---|---|---|---|
| A | 8669 | 6323 | 11 | 11 | 0.13% | 0.17% | 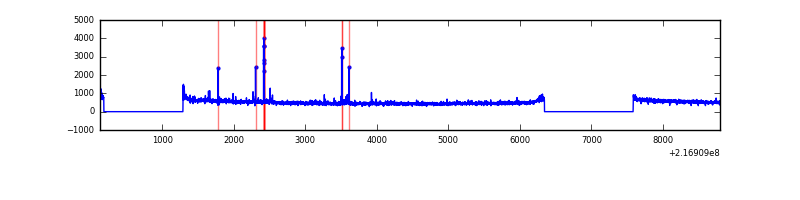 |
| B | 8669 | 6323 | 38 | 38 | 0.44% | 0.60% | 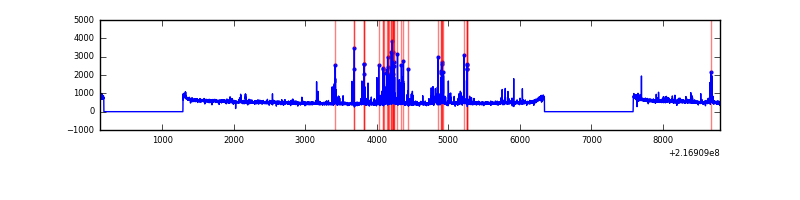 |
| C | 8669 | 6323 | 0 | 0 | 0.00% | 0.00% | 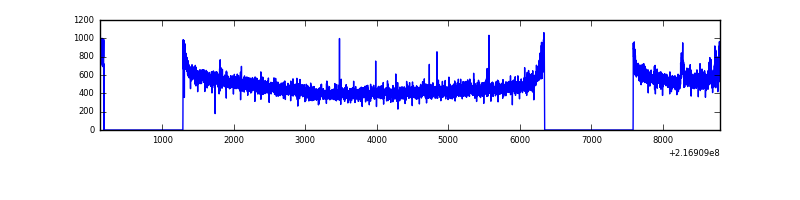 |
| D | 8669 | 6323 | 51 | 51 | 0.59% | 0.81% | 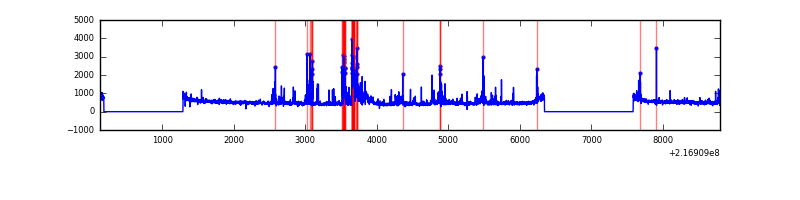 |
Top three noisy pixels from each quadrant. If the there are fewer than three noisy pixels in the level2.evt file, extra rows are filled as -1
| Pixel properties | Quadrant properties | ||||||
|---|---|---|---|---|---|---|---|
| Quadrant | DetID | PixID | Counts | Sigma | Mean | Median | Sigma |
| A | 8 | 15 | 88321 | 532.15 | 805 | 789 | 164.5 |
| A | 0 | 254 | 78479 | 472.32 | 805 | 789 | 164.5 |
| A | 0 | 226 | 7694 | 41.98 | 805 | 789 | 164.5 |
| B | 3 | 64 | 379094 | 2447.89 | 806 | 789 | 154.5 |
| B | 4 | 81 | 33157 | 209.44 | 806 | 789 | 154.5 |
| B | 0 | 219 | 22717 | 141.89 | 806 | 789 | 154.5 |
| C | 1 | 16 | 67322 | 372.39 | 768 | 772 | 178.7 |
| C | 13 | 61 | 6202 | 30.38 | 768 | 772 | 178.7 |
| C | 9 | 54 | 2622 | 10.35 | 768 | 772 | 178.7 |
| D | 13 | 169 | 481629 | 2508.81 | 775 | 750 | 191.7 |
| D | 8 | 195 | 34176 | 174.39 | 775 | 750 | 191.7 |
| D | 5 | 97 | 24656 | 124.72 | 775 | 750 | 191.7 |
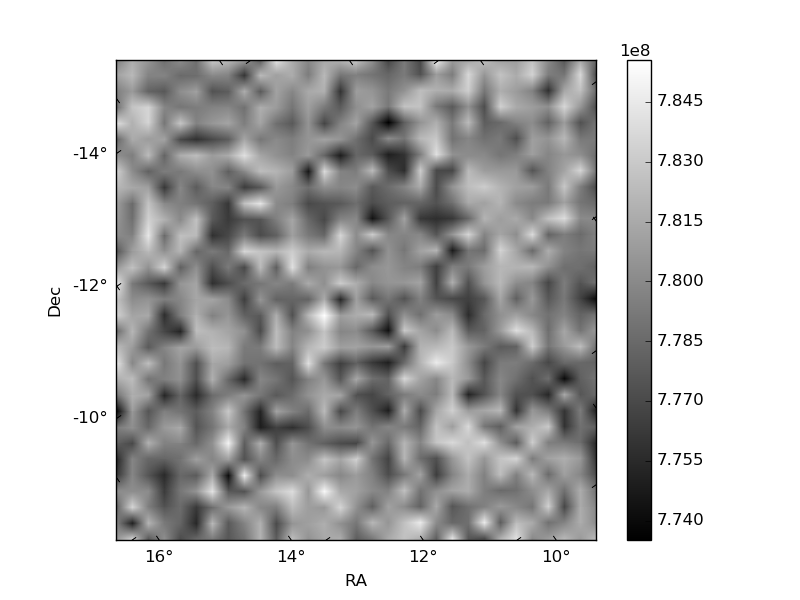
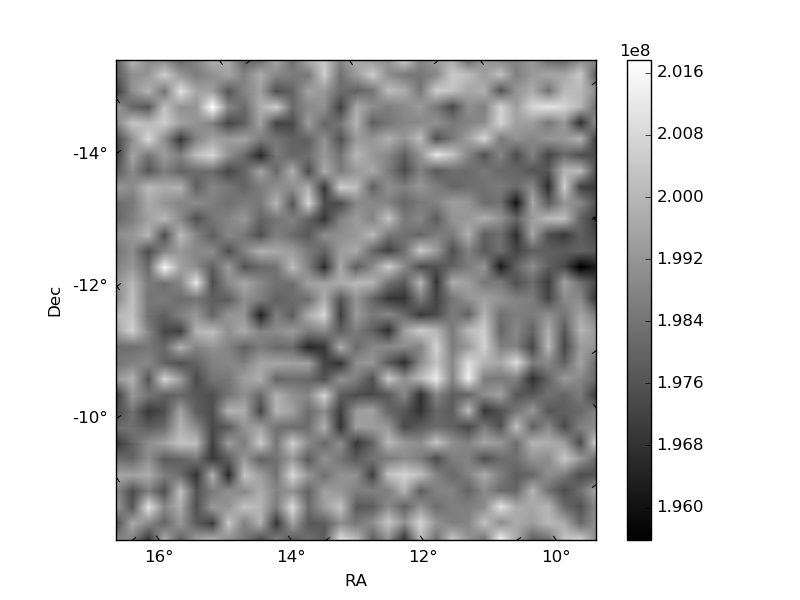
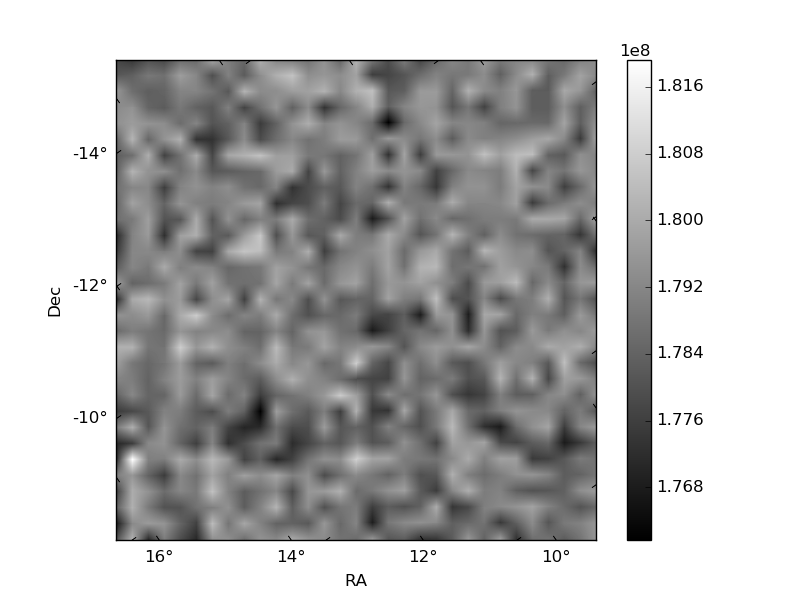
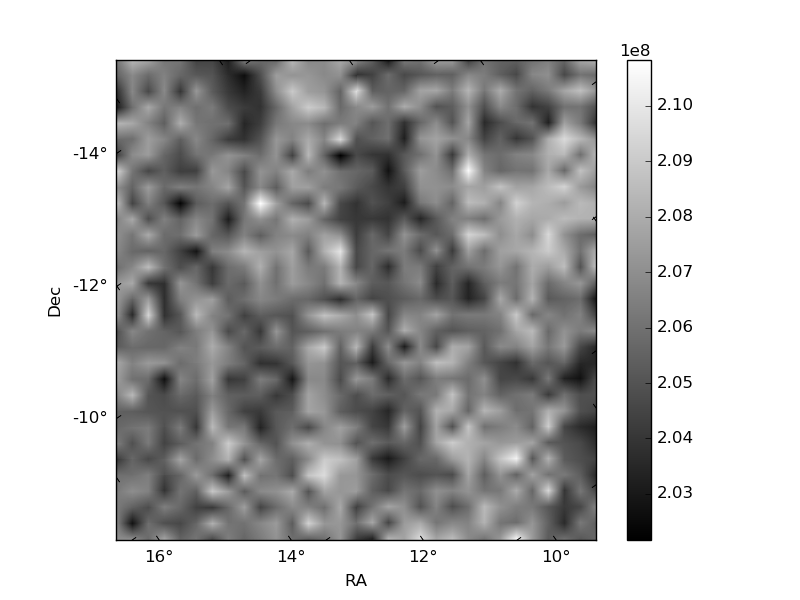
Histogram calculated using DETX and DETY for each event in the final _common_clean file
| Quadrant A | 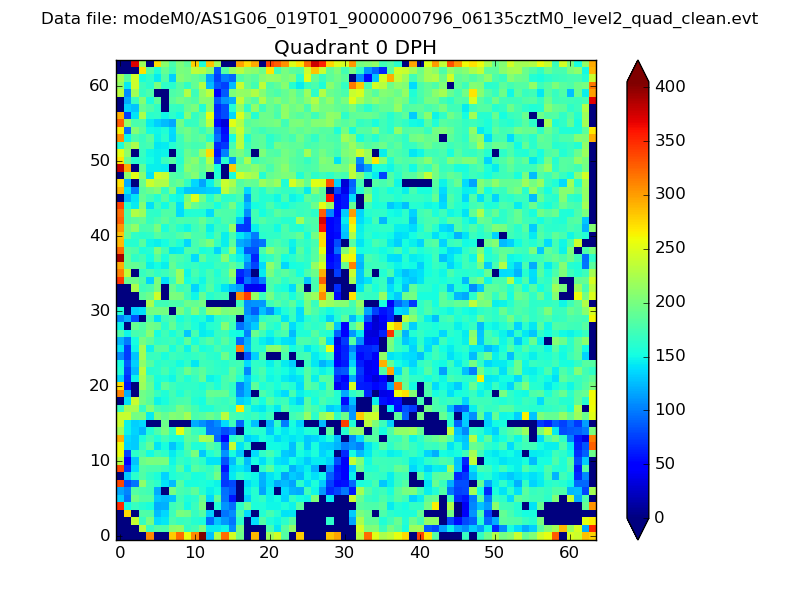 |
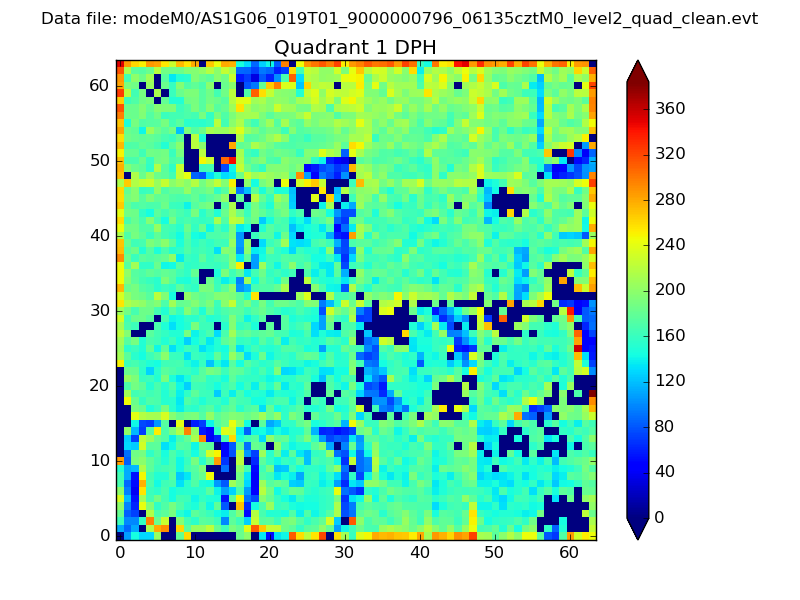 |
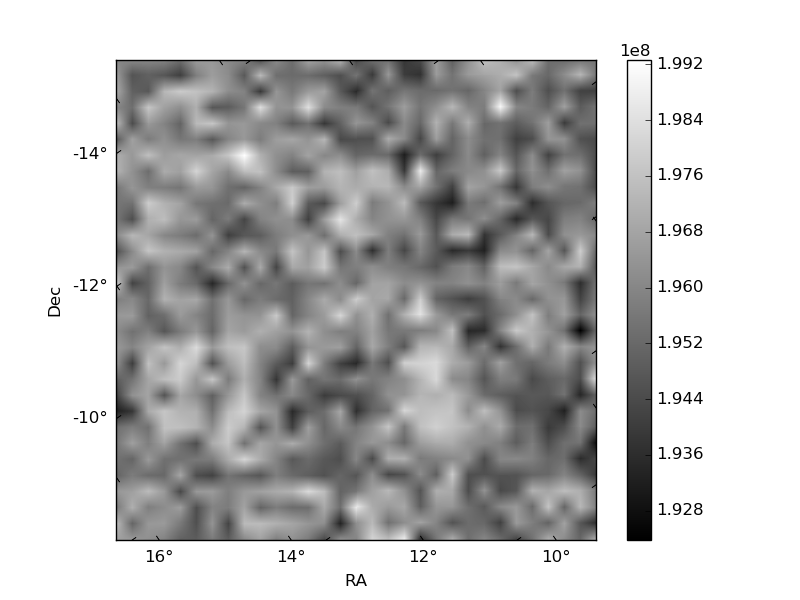
Quadrant B |
|---|---|---|---|
| Quadrant D | 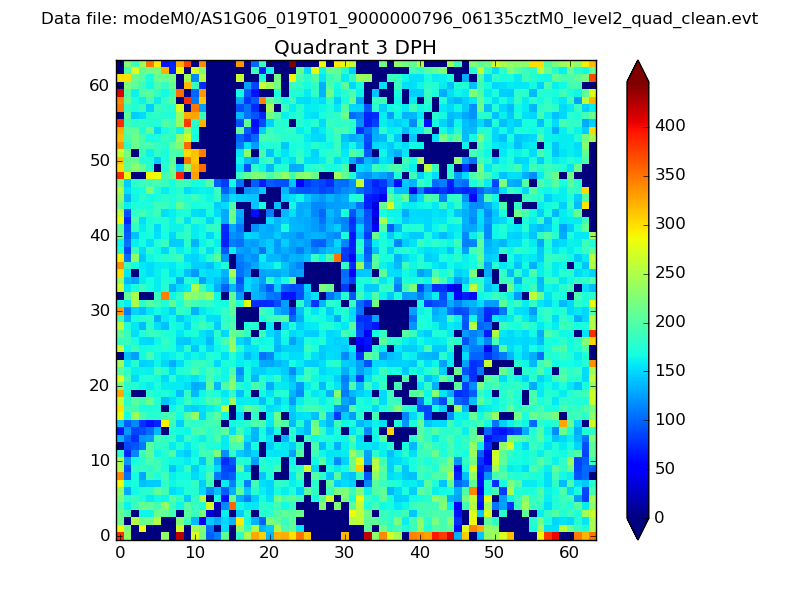 |
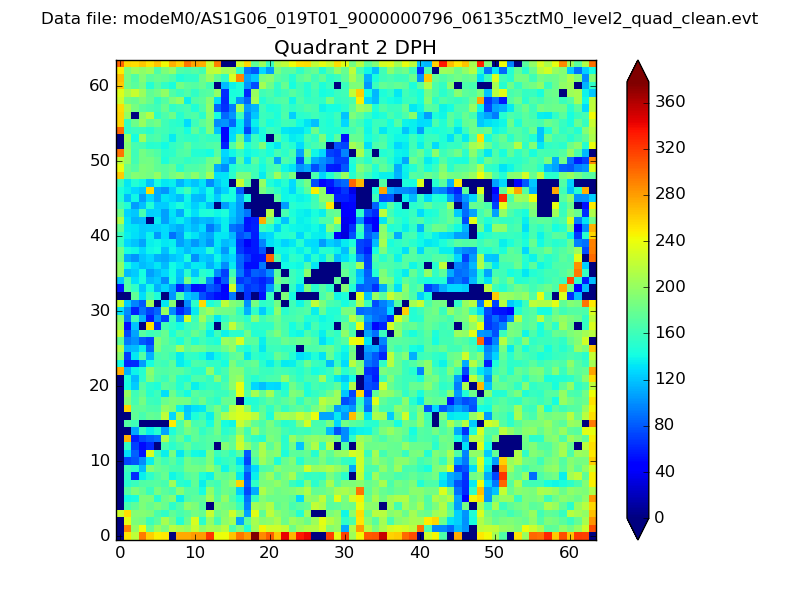 |
Quadrant C |
| Plot type | Count rate plots | Images |
|---|---|---|
| Comparison with Poisson distribution Blue bars denote a histogram of data divided into 1 sec bins. Red curve is a Poisson curve with rate = median count rate of data. |
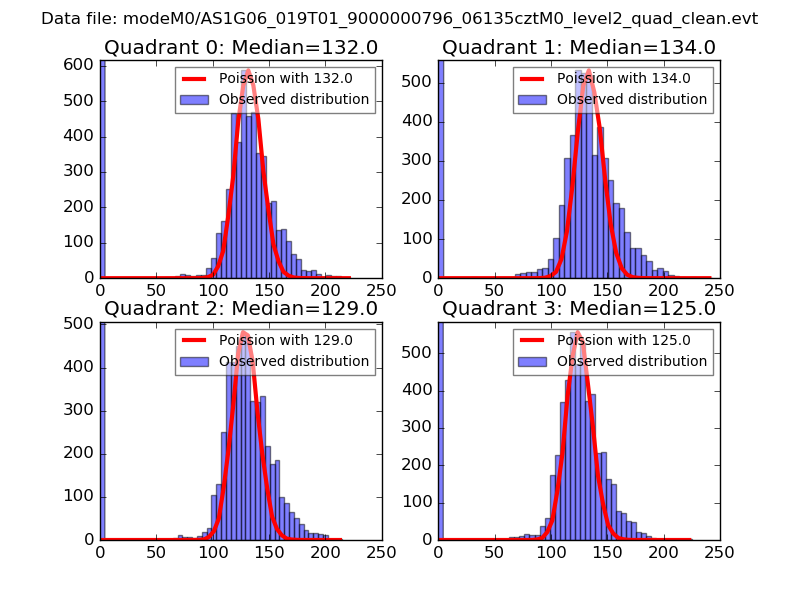 |
 |
| Quadrant-wise count rates Data is divided into 100 sec bins |
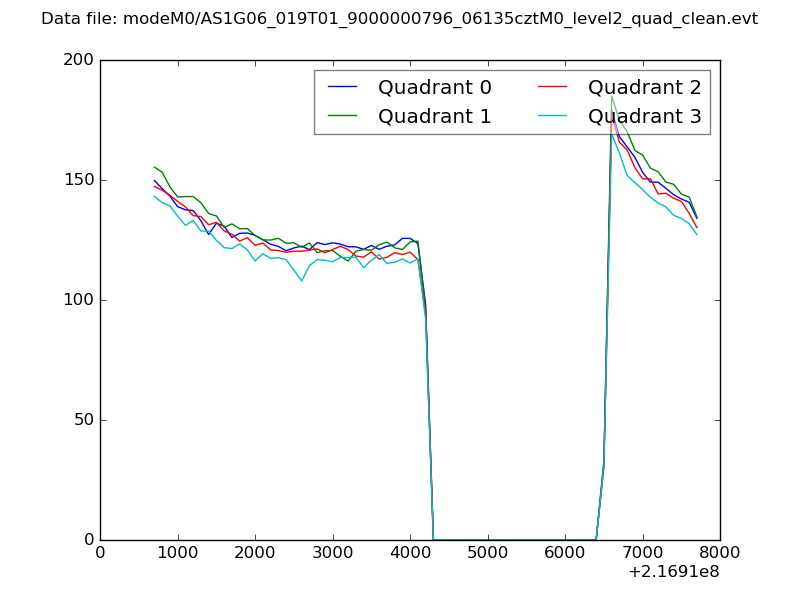 |
|
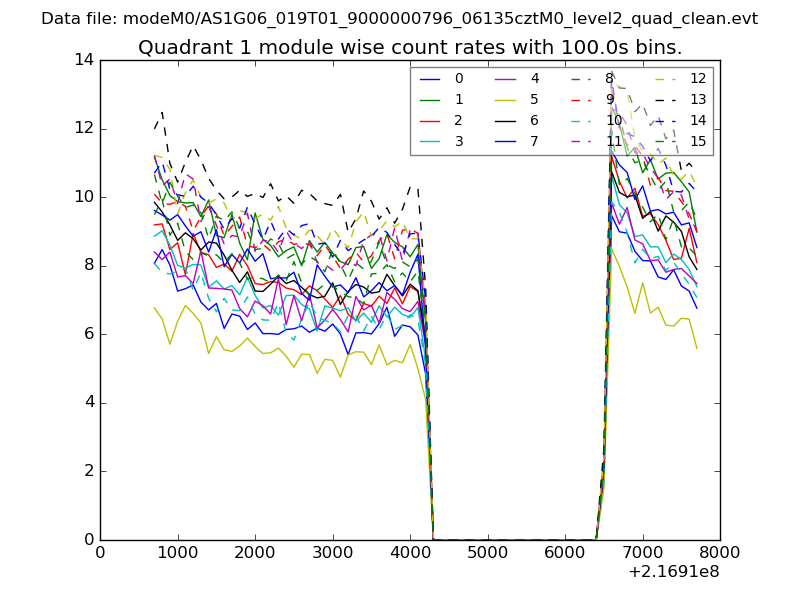
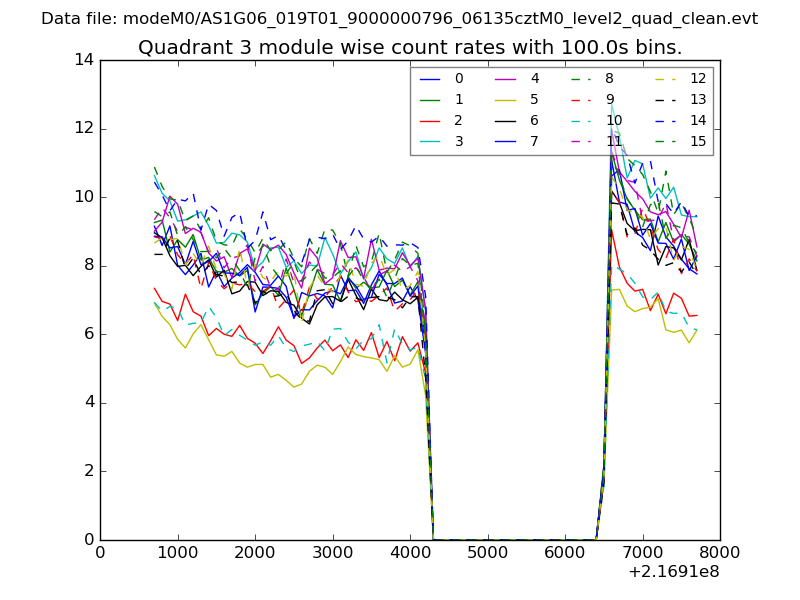
| Module-wise count rates for Quadrant A Data is divided into 100 sec bins |
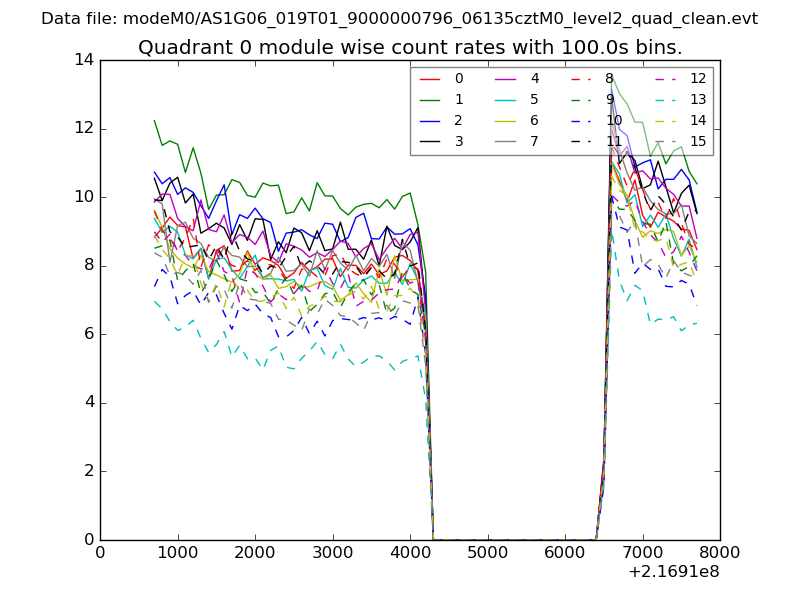 |
 |
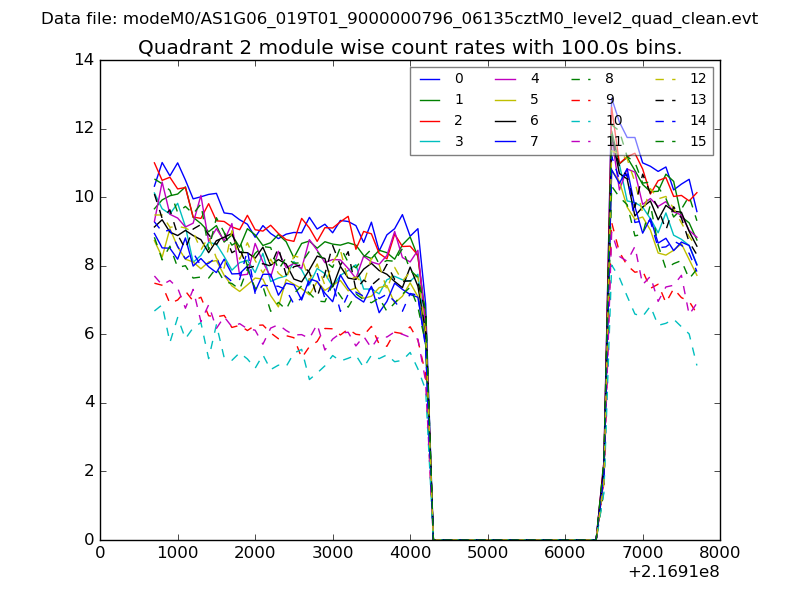
| Module-wise count rates for Quadrant B Data is divided into 100 sec bins |
 |
 |
| Module-wise count rates for Quadrant C Data is divided into 100 sec bins |
 |
 |
| Module-wise count rates for Quadrant D Data is divided into 100 sec bins |
 |
 |
| Parameter | Plot |
|---|---|
| CZT HV Monitor | 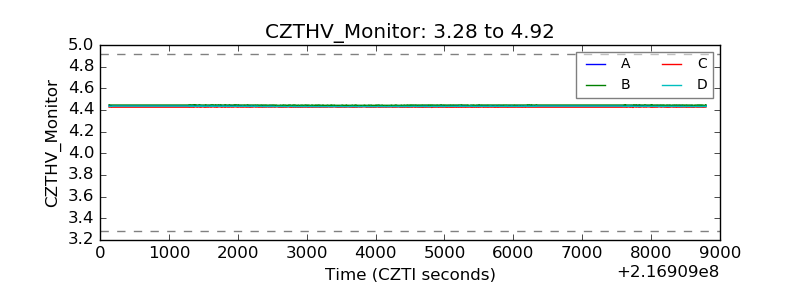 |
| D_VDD | 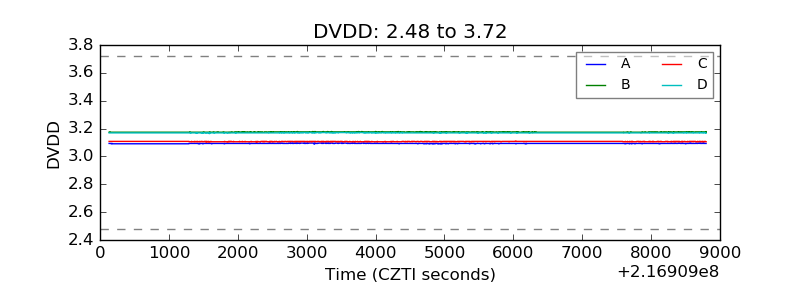 |
| Temperature 1 | 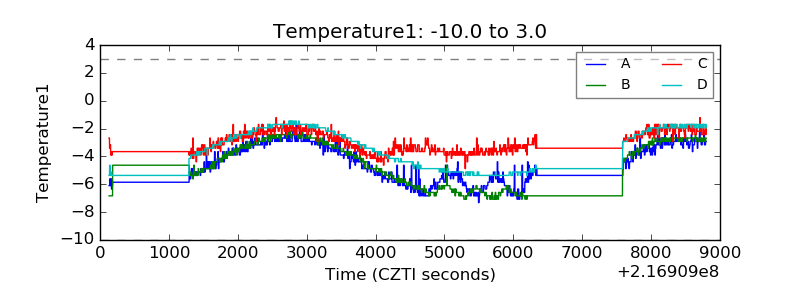 |
| Veto HV Monitor | 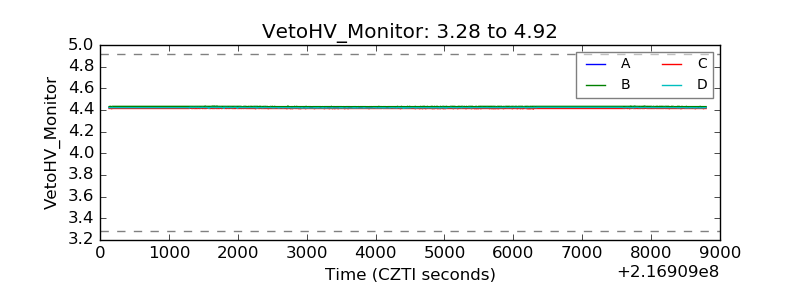 |
| Veto LLD | 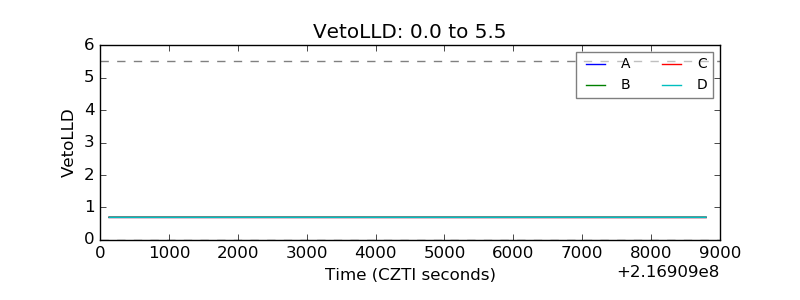 |
| Alpha Counter | 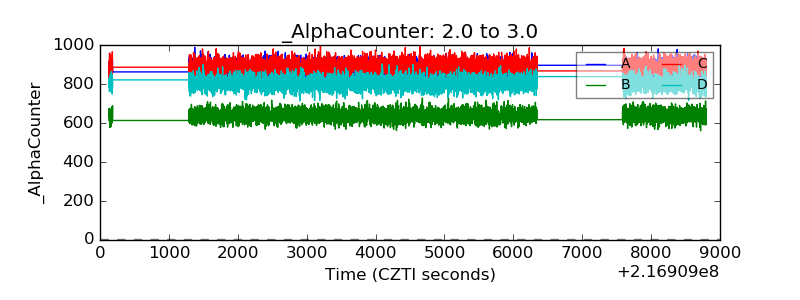 |
| _CPM_Rate | 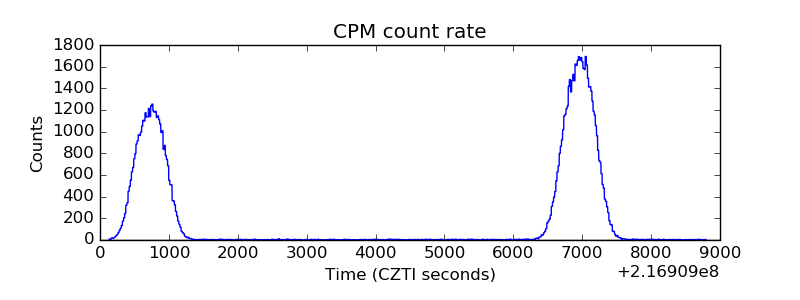 |
| CZT Counter | 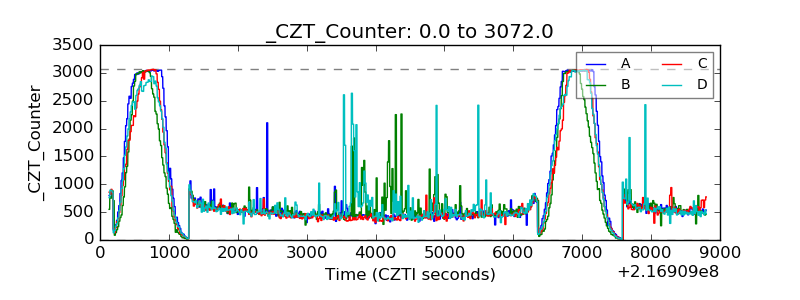 |
| +2.5 Volts monitor | 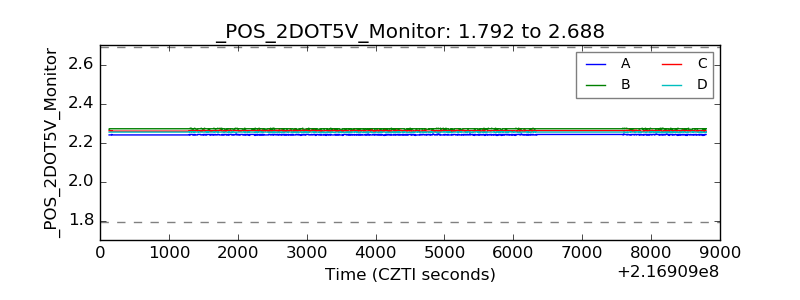 |
| +5 Volts monitor |  |
| _ROLL_ROT | 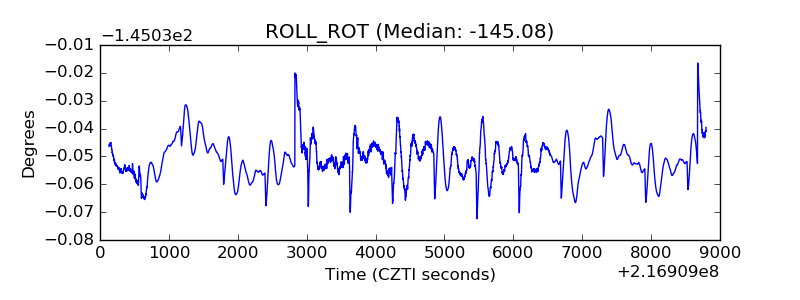 |
| _Roll_DEC | 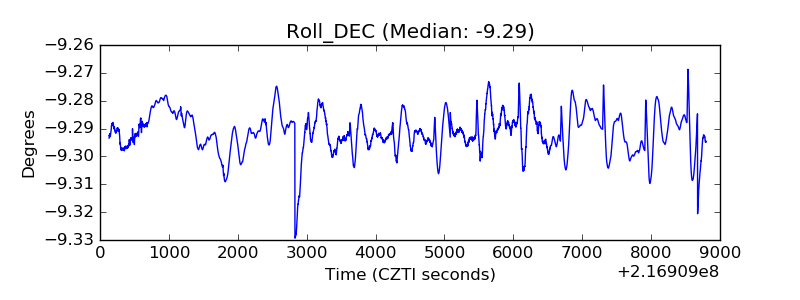 |
| _Roll_RA | 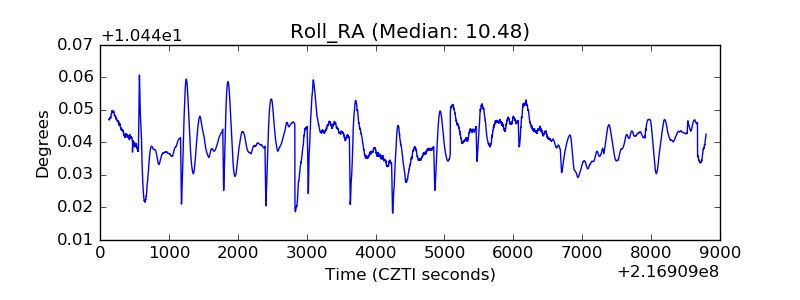 |
| Veto Counter | 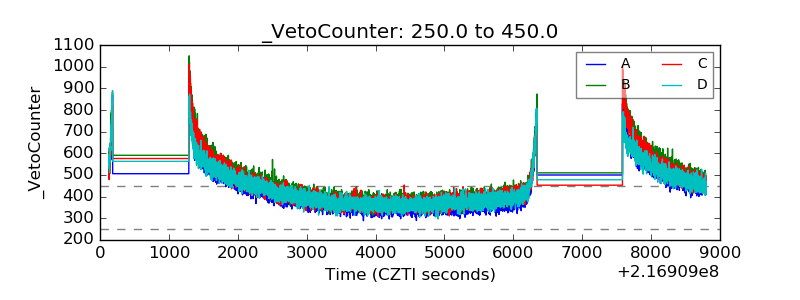 |