| Param | Original file | Final file |
|---|---|---|
| Filename | modeM0/AS1G06_019T01_9000000796_06137cztM0_level2.evt | modeM0/AS1G06_019T01_9000000796_06137cztM0_level2_quad_clean.evt |
| Size (bytes) | 194,460,480 | 58,959,360 |
| Size | 185.5 MB | 56.2 MB |
| Events in quadrant A | 1,415,184 | 400,483 |
| Events in quadrant B | 1,588,377 | 406,342 |
| Events in quadrant C | 1,333,480 | 391,263 |
| Events in quadrant D | 1,351,881 | 379,361 |
| Mode M9 | |||
|---|---|---|---|
| Quadrant | BADHDUFLAG | Total packets | Discarded packets |
| A | 0 | 1 | 0 |
| B | 0 | 1 | 0 |
| C | 0 | 1 | 0 |
| D | 0 | 2 | 0 |
| Mode M0 | |||
|---|---|---|---|
| Quadrant | BADHDUFLAG | Total packets | Discarded packets |
| A | 0 | 6152 | 2 |
| B | 0 | 6625 | 1 |
| C | 0 | 6025 | 1 |
| D | 0 | 6112 | 1 |
| Mode SS | |||
|---|---|---|---|
| Quadrant | BADHDUFLAG | Total packets | Discarded packets |
| A | 0 | 58 | 0 |
| B | 0 | 58 | 0 |
| C | 0 | 58 | 0 |
| D | 0 | 58 | 0 |
| Quadrant | Total seconds | Saturated seconds | Saturation percentage |
|---|---|---|---|
| A | 2915 | 7 | 0.240137% |
| B | 2915 | 37 | 1.269297% |
| C | 2915 | 10 | 0.343053% |
| D | 2915 | 3 | 0.102916% |
Noise dominated data is calculated using 1-second bins in cleaned event files. If a bin has >2000 counts, and if more than 50% of those come from <1% of pixels, then it is considered to be noise-dominated and hence unusable.
| Quadrant | # 1 sec bins | Bins with >0 counts | Bins with >2000 counts | High rate bins dominated by noise | Noise dominated (total time) | Noise dominated (detector-on time) | Marked lightcurve |
|---|---|---|---|---|---|---|---|
| A | 2915 | 2915 | 0 | 0 | 0.00% | 0.00% | 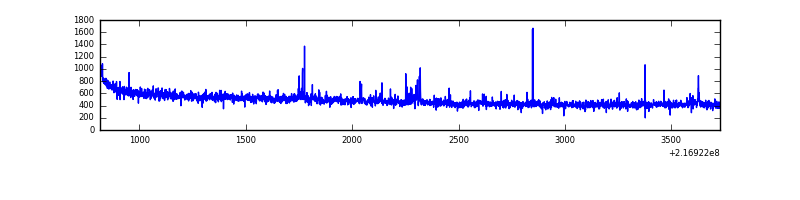 |
| B | 2915 | 2915 | 26 | 26 | 0.89% | 0.89% | 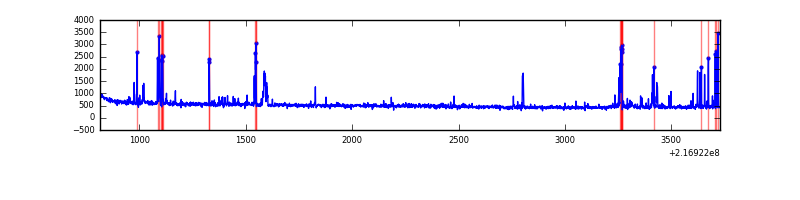 |
| C | 2915 | 2915 | 0 | 0 | 0.00% | 0.00% | 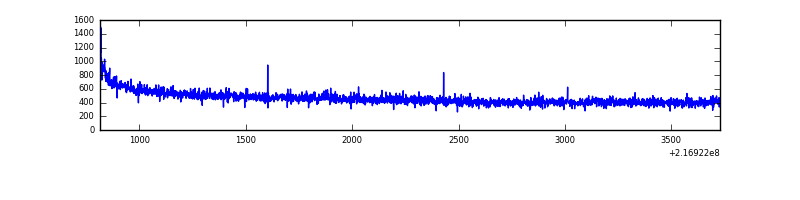 |
| D | 2915 | 2915 | 3 | 3 | 0.10% | 0.10% | 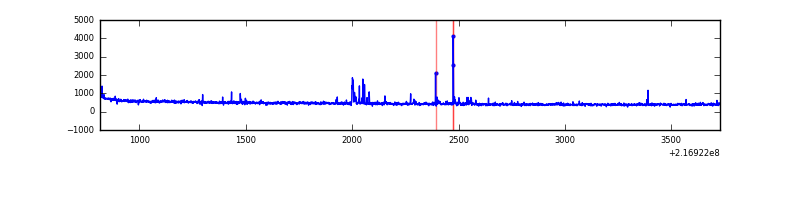 |
Top three noisy pixels from each quadrant. If the there are fewer than three noisy pixels in the level2.evt file, extra rows are filled as -1
| Pixel properties | Quadrant properties | ||||||
|---|---|---|---|---|---|---|---|
| Quadrant | DetID | PixID | Counts | Sigma | Mean | Median | Sigma |
| A | 8 | 15 | 19394 | 260.47 | 358 | 351 | 73.1 |
| A | 13 | 170 | 14656 | 195.67 | 358 | 351 | 73.1 |
| A | 0 | 254 | 3776 | 46.85 | 358 | 351 | 73.1 |
| B | 3 | 64 | 160878 | 2330.84 | 357 | 351 | 68.9 |
| B | 4 | 81 | 17276 | 245.75 | 357 | 351 | 68.9 |
| B | 15 | 204 | 12584 | 177.62 | 357 | 351 | 68.9 |
| C | 1 | 16 | 18576 | 231.69 | 336 | 339 | 78.7 |
| C | 13 | 61 | 2662 | 29.51 | 336 | 339 | 78.7 |
| C | 12 | 4 | 2242 | 24.18 | 336 | 339 | 78.7 |
| D | 5 | 97 | 42178 | 493.91 | 341 | 332 | 84.7 |
| D | 8 | 195 | 15515 | 179.21 | 341 | 332 | 84.7 |
| D | 13 | 169 | 8712 | 98.91 | 341 | 332 | 84.7 |
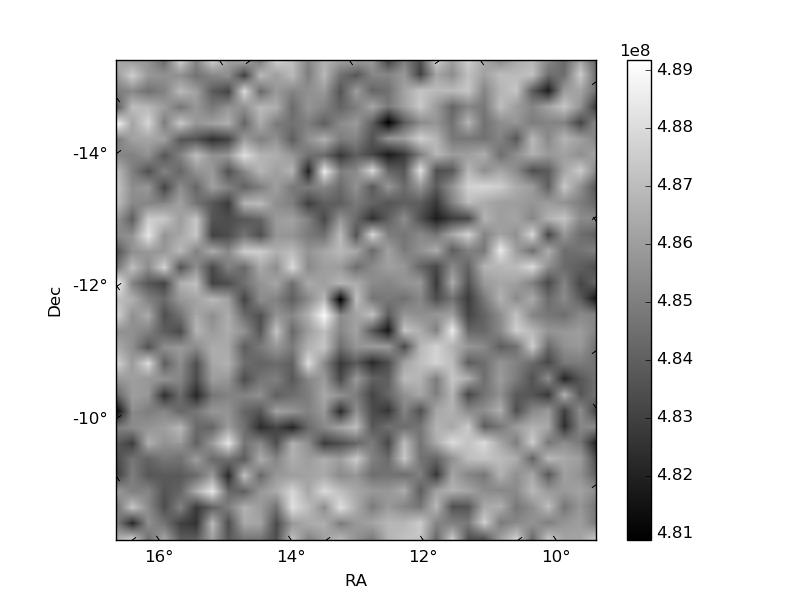
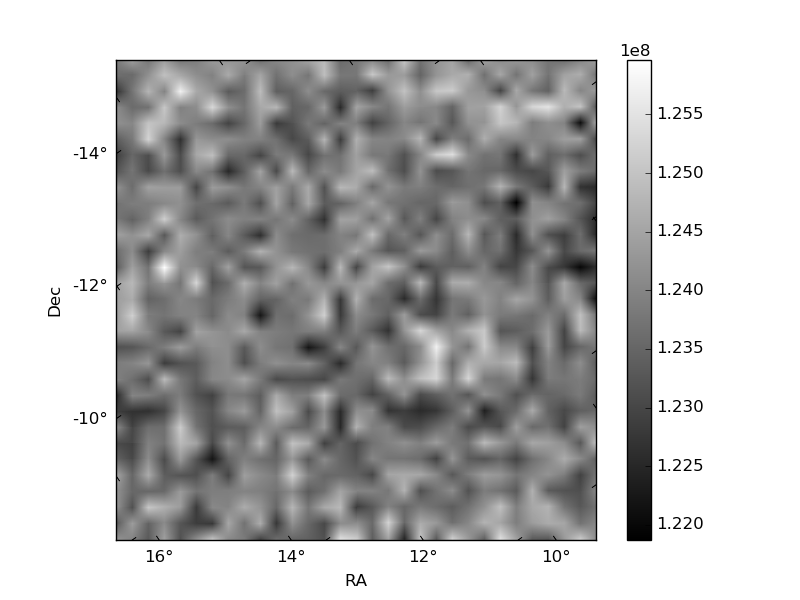
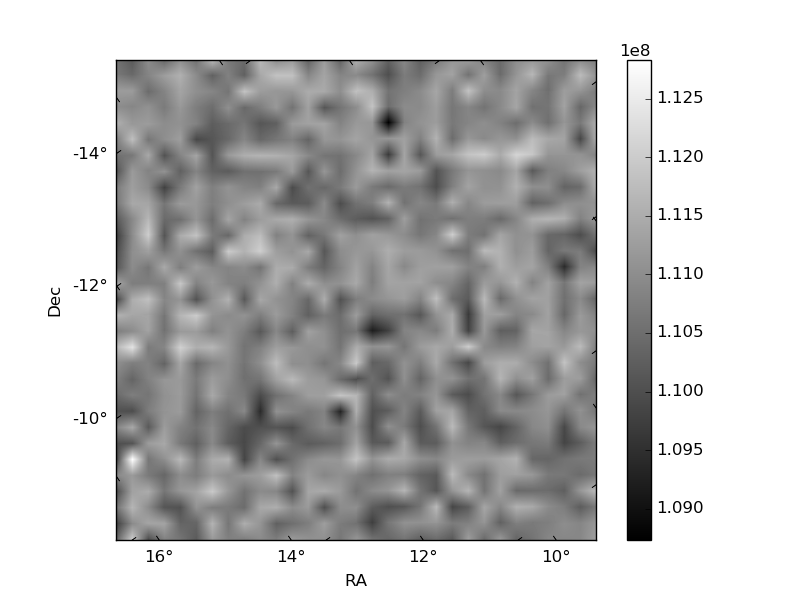
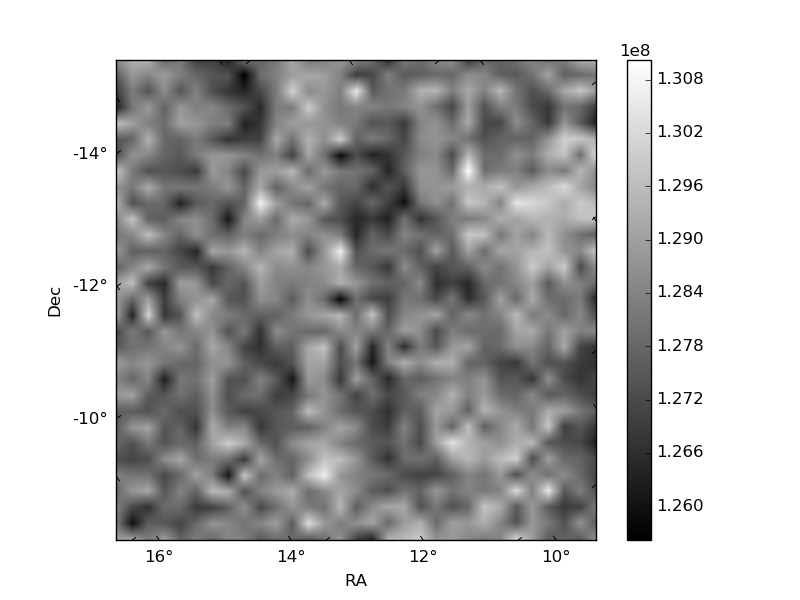
Histogram calculated using DETX and DETY for each event in the final _common_clean file
| Quadrant A | 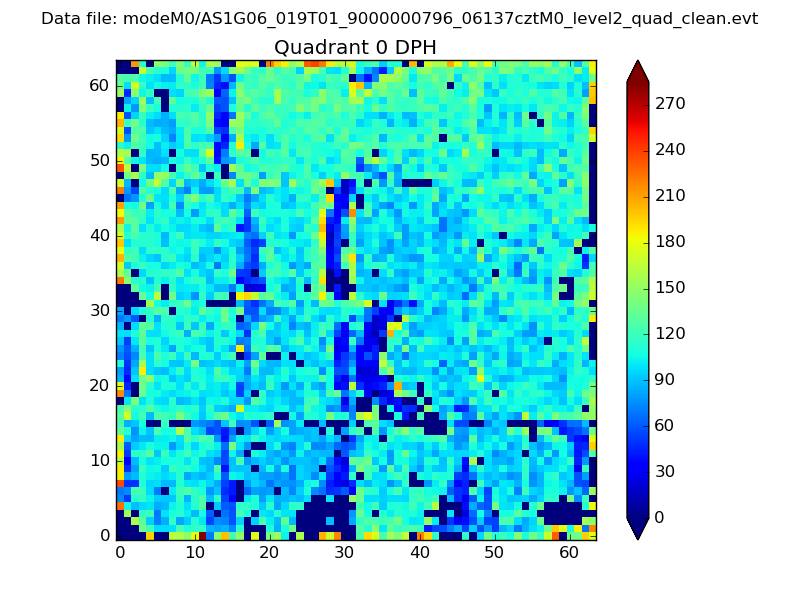 |
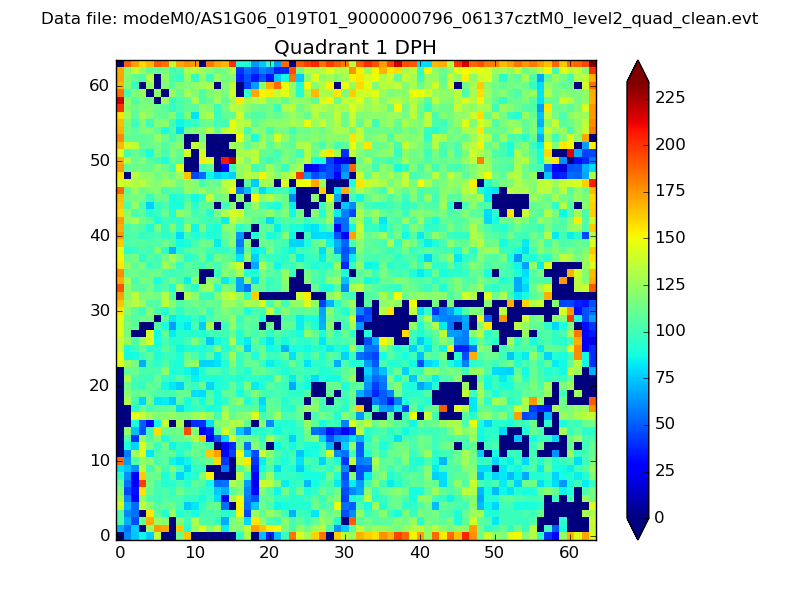 |
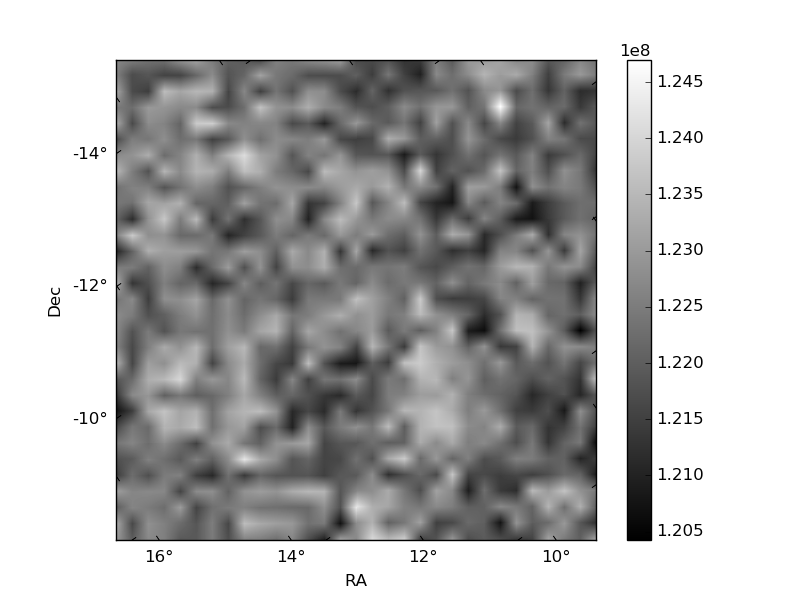
Quadrant B |
|---|---|---|---|
| Quadrant D | 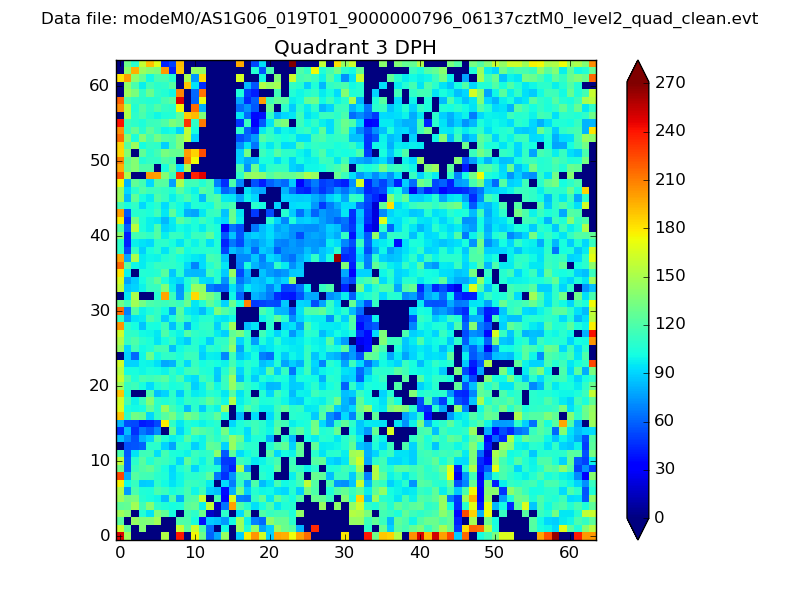 |
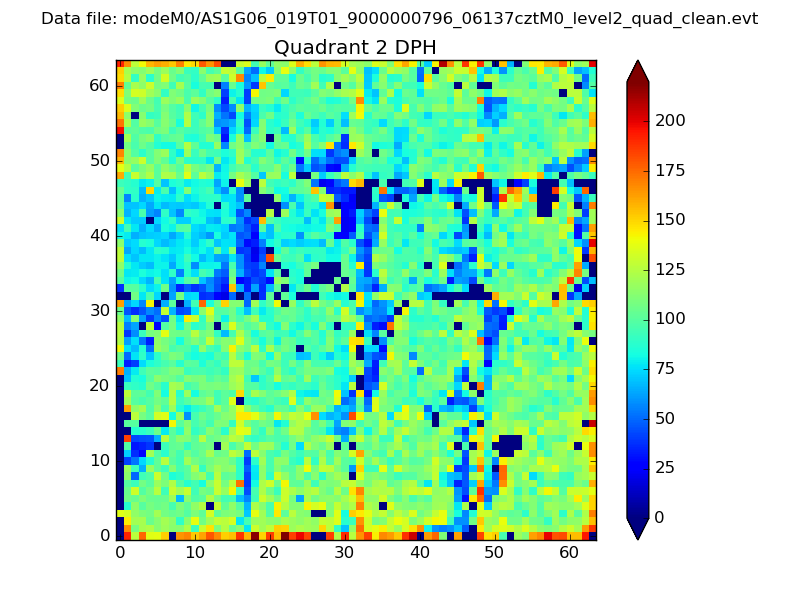 |
Quadrant C |
| Plot type | Count rate plots | Images |
|---|---|---|
| Comparison with Poisson distribution Blue bars denote a histogram of data divided into 1 sec bins. Red curve is a Poisson curve with rate = median count rate of data. |
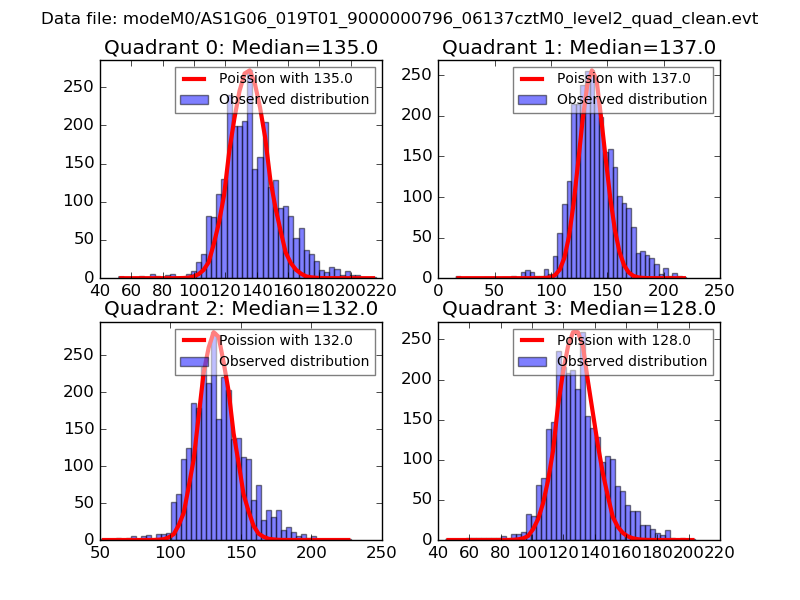 |
 |
| Quadrant-wise count rates Data is divided into 100 sec bins |
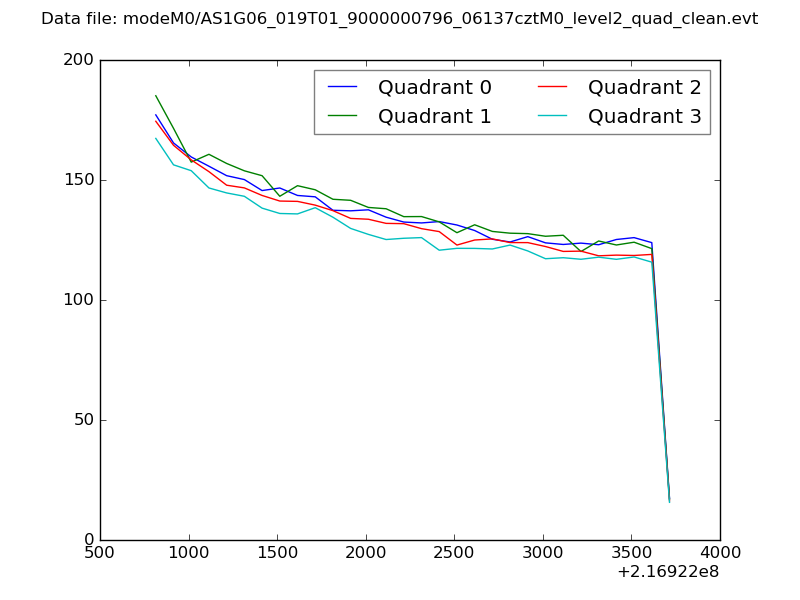 |
|
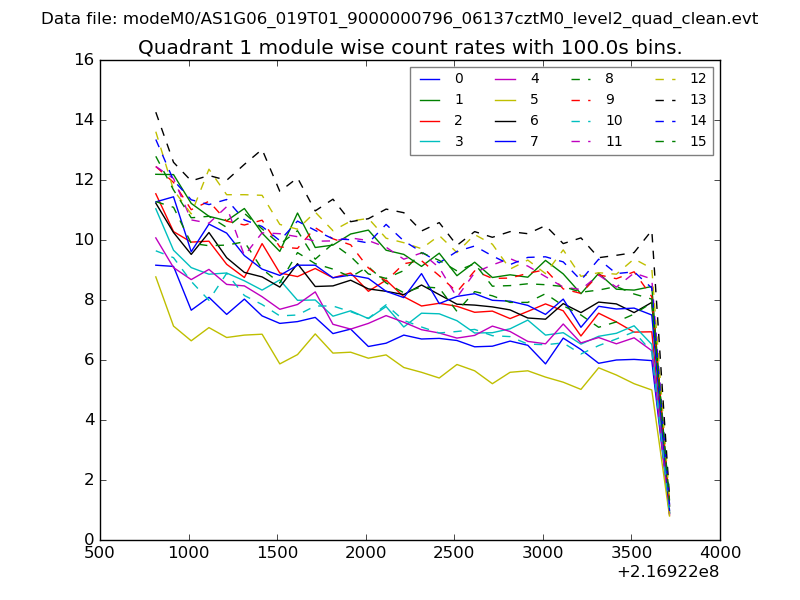
| Module-wise count rates for Quadrant A Data is divided into 100 sec bins |
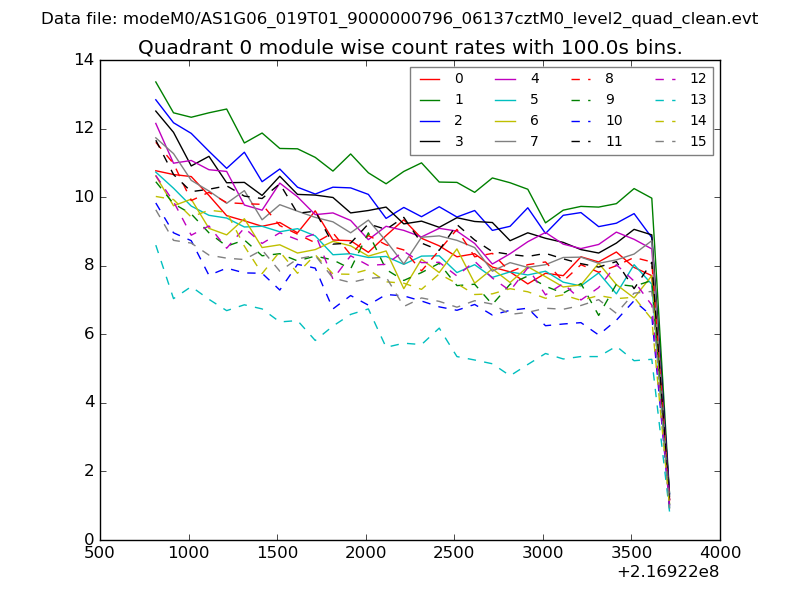 |
 |
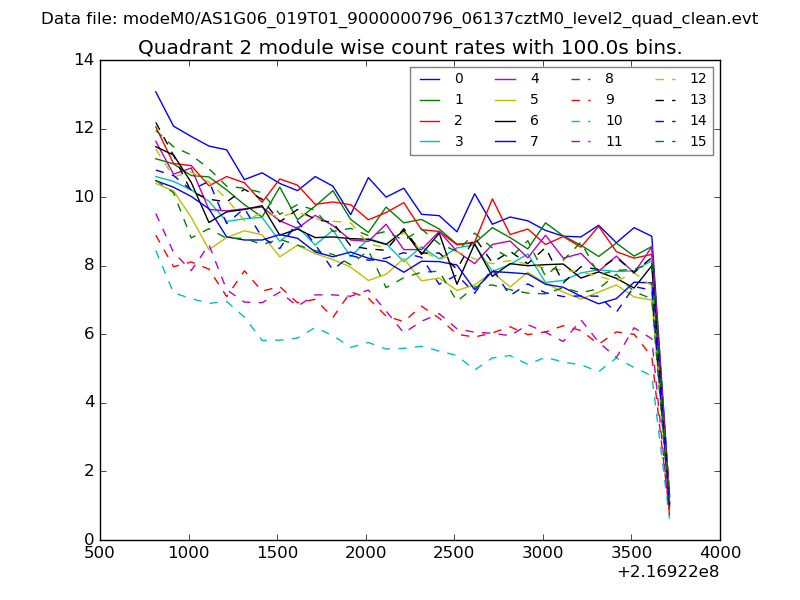
| Module-wise count rates for Quadrant B Data is divided into 100 sec bins |
 |
 |
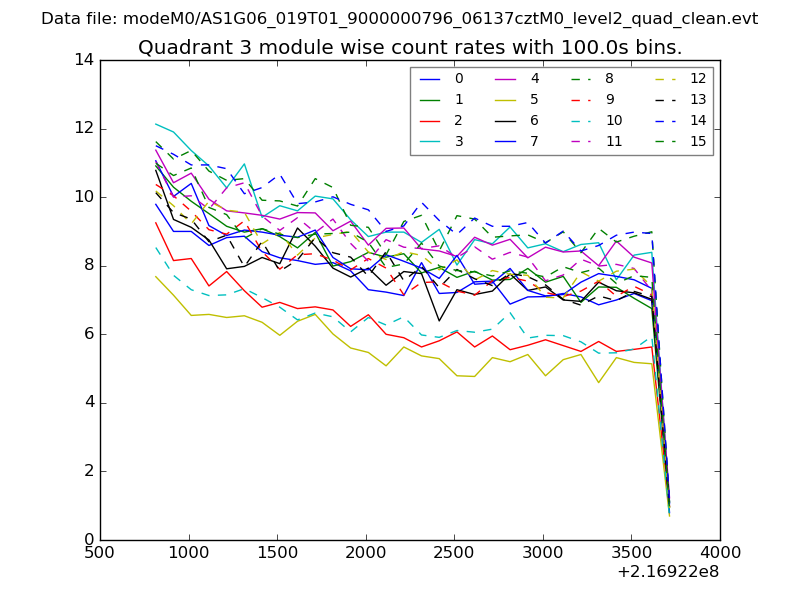
| Module-wise count rates for Quadrant C Data is divided into 100 sec bins |
 |
 |
| Module-wise count rates for Quadrant D Data is divided into 100 sec bins |
 |
 |
| Parameter | Plot |
|---|---|
| CZT HV Monitor | 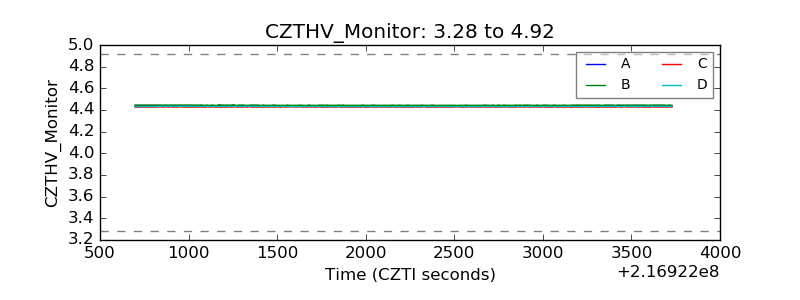 |
| D_VDD | 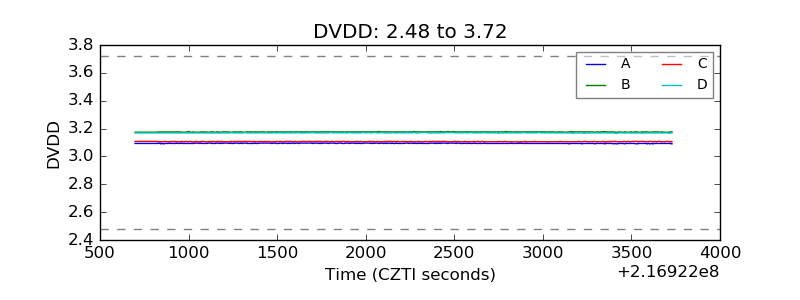 |
| Temperature 1 | 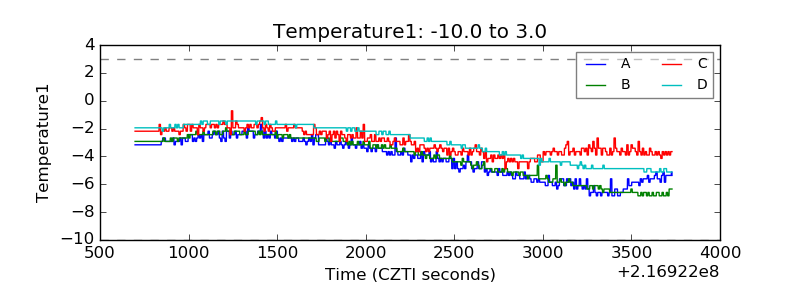 |
| Veto HV Monitor | 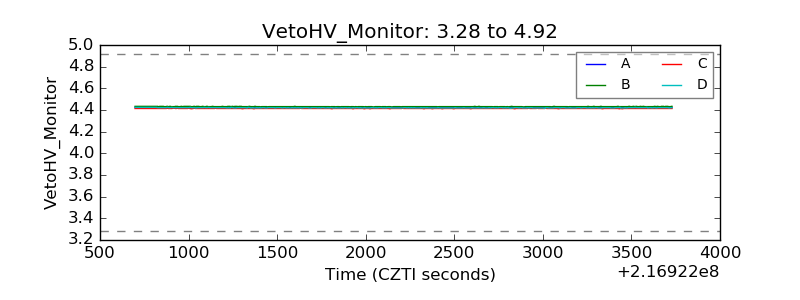 |
| Veto LLD | 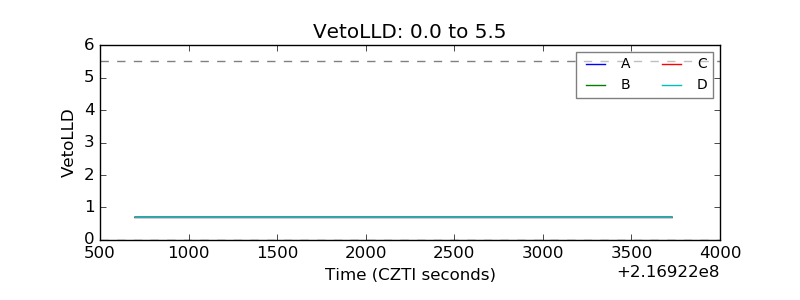 |
| Alpha Counter | 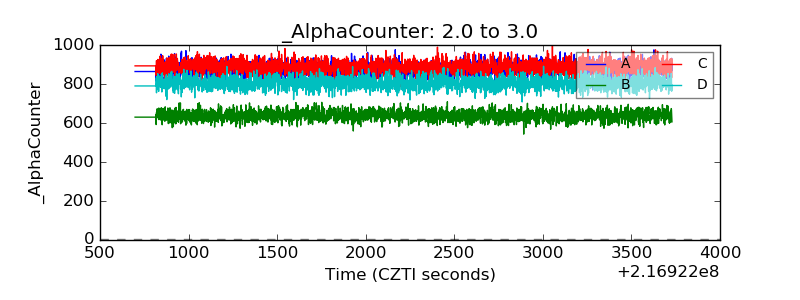 |
| _CPM_Rate | 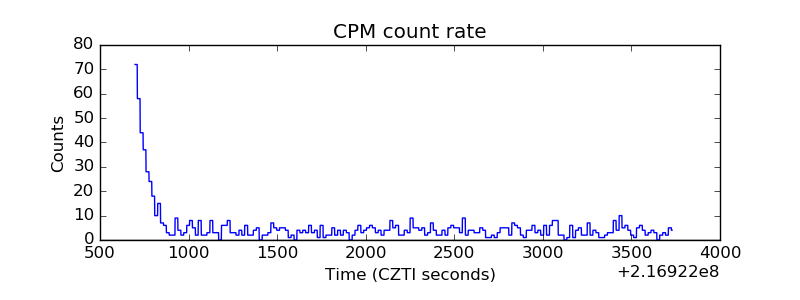 |
| CZT Counter | 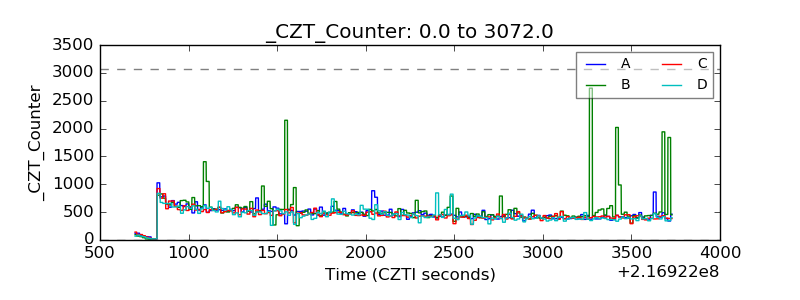 |
| +2.5 Volts monitor | 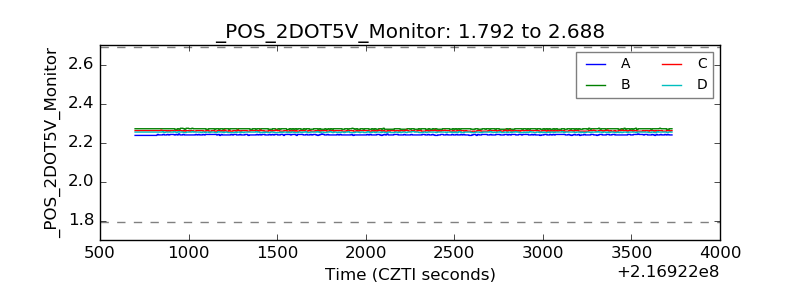 |
| +5 Volts monitor |  |
| _ROLL_ROT | 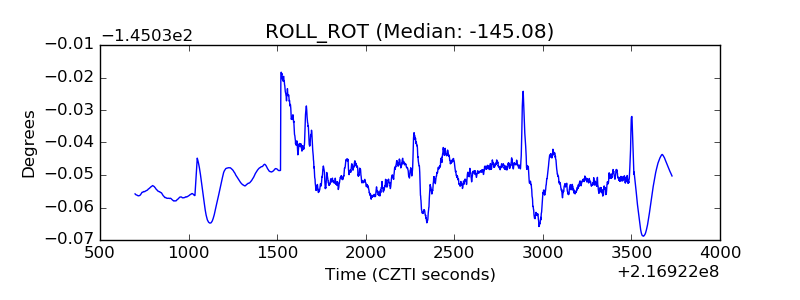 |
| _Roll_DEC |  |
| _Roll_RA | 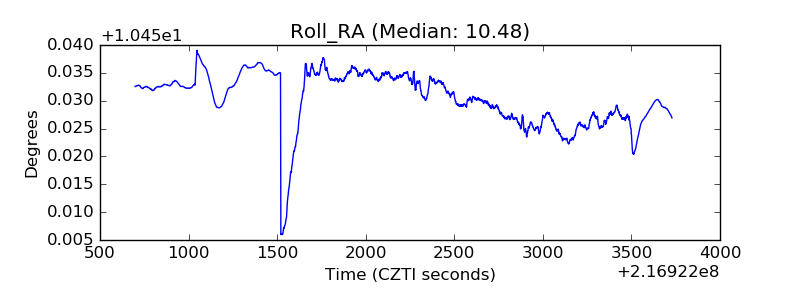 |
| Veto Counter | 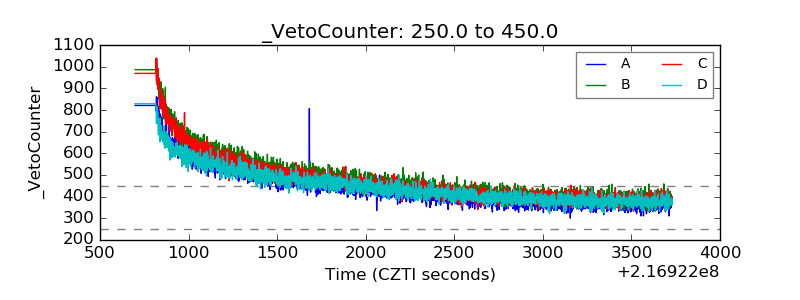 |