| Param | Original file | Final file |
|---|---|---|
| Filename | modeM0/AS1C02_018T01_9000000798cztM0_level2.fits | modeM0/AS1C02_018T01_9000000798cztM0_level2_quad_clean.evt |
| Size (bytes) | 454,127,040 | 449,760,960 |
| Size | 433.1 MB | 428.9 MB |
| Events in quadrant A | 2,695,756 | 2,594,862 |
| Events in quadrant B | 2,578,974 | 2,554,015 |
| Events in quadrant C | 2,705,024 | 2,637,469 |
| Events in quadrant D | 2,341,482 | 2,404,914 |
| Mode M9 | |||
|---|---|---|---|
| Quadrant | BADHDUFLAG | Total packets | Discarded packets |
| A | 0 | 52 | 0 |
| B | 0 | 50 | 0 |
| C | 0 | 52 | 0 |
| D | 0 | 51 | 0 |
| Mode SS | |||
|---|---|---|---|
| Quadrant | BADHDUFLAG | Total packets | Discarded packets |
| A | 0 | 1016 | 0 |
| B | 0 | 1014 | 0 |
| C | 0 | 1010 | 0 |
| D | 0 | 1018 | 0 |
| Mode M0 | |||
|---|---|---|---|
| Quadrant | BADHDUFLAG | Total packets | Discarded packets |
| A | 0 | 110338 | 0 |
| B | 0 | 122171 | 0 |
| C | 0 | 103456 | 0 |
| D | 0 | 108317 | 0 |
| Quadrant | Total seconds | Saturated seconds | Saturation percentage |
|---|---|---|---|
| A | 49971 | 1175 | 2.351364% |
| B | 49883 | 2405 | 4.821282% |
| C | 50017 | 670 | 1.339545% |
| D | 50012 | 1039 | 2.077501% |
Noise dominated data is calculated using 1-second bins in cleaned event files. If a bin has >2000 counts, and if more than 50% of those come from <1% of pixels, then it is considered to be noise-dominated and hence unusable.
| Quadrant | # 1 sec bins | Bins with >0 counts | Bins with >2000 counts | High rate bins dominated by noise | Noise dominated (total time) | Noise dominated (detector-on time) | Marked lightcurve |
|---|---|---|---|---|---|---|---|
| A | 55945 | 50503 | 0 | 0 | 0.00% | 0.00% |  |
| B | 55945 | 50409 | 0 | 0 | 0.00% | 0.00% |  |
| C | 55945 | 50521 | 0 | 0 | 0.00% | 0.00% |  |
| D | 55945 | 50523 | 0 | 0 | 0.00% | 0.00% |  |
Top three noisy pixels from each quadrant. If the there are fewer than three noisy pixels in the level2.evt file, extra rows are filled as -1
| Pixel properties | Quadrant properties | ||||||
|---|---|---|---|---|---|---|---|
| Quadrant | DetID | PixID | Counts | Sigma | Mean | Median | Sigma |
| A | 14 | 188 | 2695 | 11.39 | 698 | 647 | 179.9 |
| A | 0 | 29 | 2655 | 11.16 | 698 | 647 | 179.9 |
| A | 14 | 204 | 2325 | 9.33 | 698 | 647 | 179.9 |
| B | 2 | 9 | 2296 | 11.88 | 679 | 642 | 139.2 |
| B | 12 | 226 | 1857 | 8.73 | 679 | 642 | 139.2 |
| B | 3 | 17 | 1764 | 8.06 | 679 | 642 | 139.2 |
| C | 12 | 241 | 1976 | 6.79 | 713 | 655 | 194.5 |
| C | 1 | 80 | 1946 | 6.64 | 713 | 655 | 194.5 |
| C | 1 | 81 | 1908 | 6.44 | 713 | 655 | 194.5 |
| D | 3 | 14 | 1727 | 6.11 | 666 | 602 | 184.0 |
| D | 6 | 231 | 1691 | 5.92 | 666 | 602 | 184.0 |
| D | 11 | 82 | 1689 | 5.91 | 666 | 602 | 184.0 |
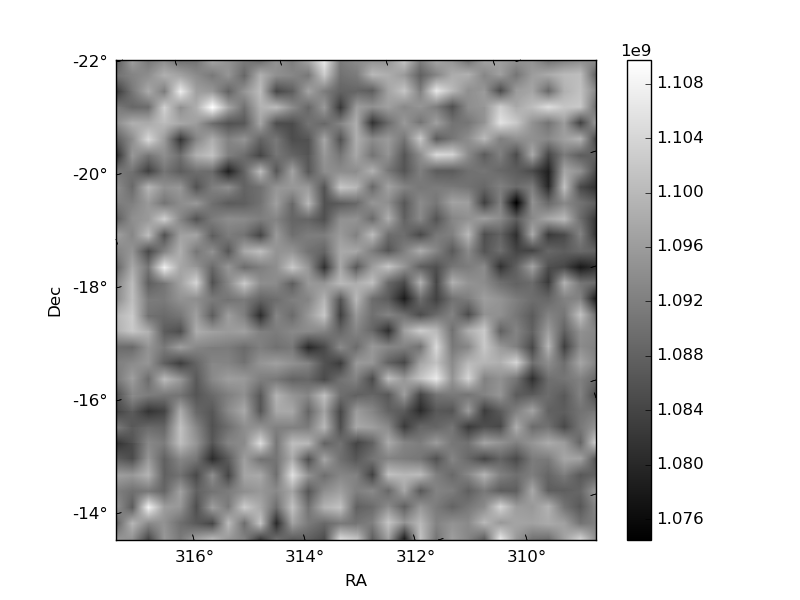
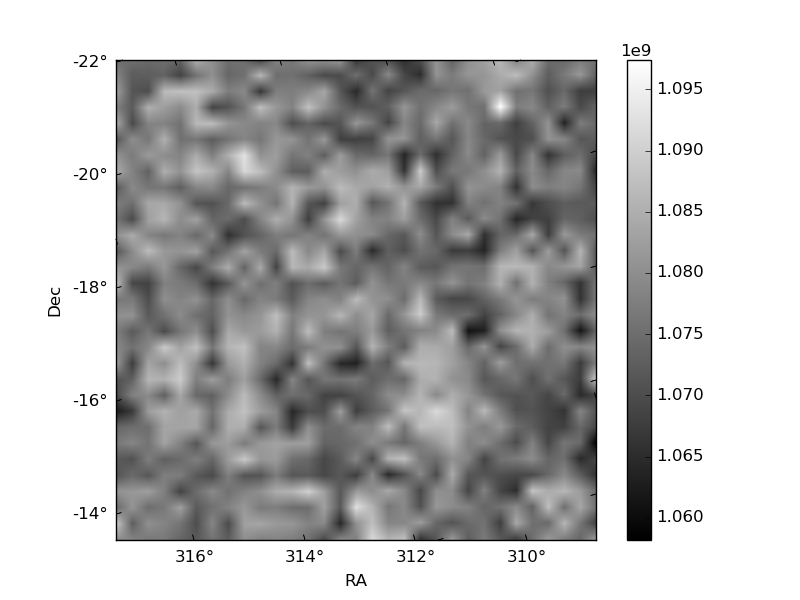
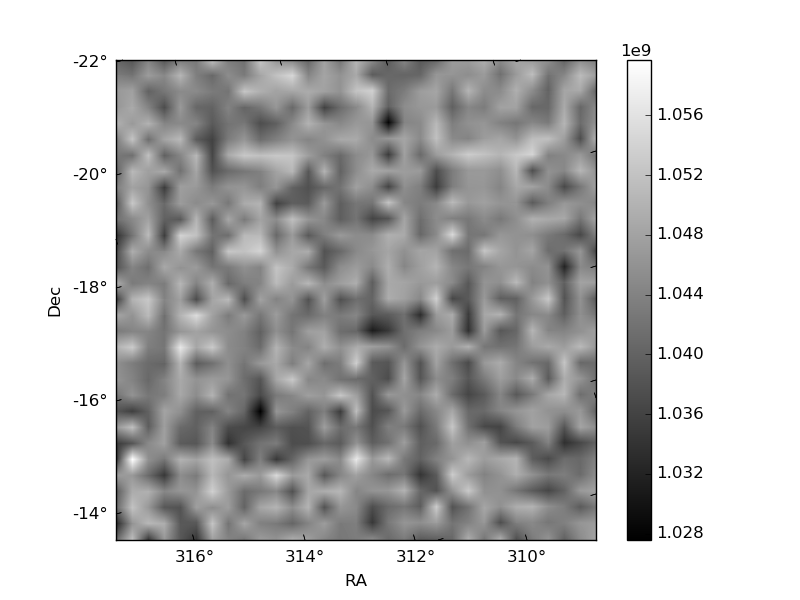
Histogram calculated using DETX and DETY for each event in the final _common_clean file
| Quadrant A |  |
 |
Quadrant B |
|---|---|---|---|
| Quadrant D |  |
 |
Quadrant C |
| Plot type | Count rate plots | Images |
|---|---|---|
| Comparison with Poisson distribution Blue bars denote a histogram of data divided into 1 sec bins. Red curve is a Poisson curve with rate = median count rate of data. |
 |
 |
| Quadrant-wise count rates Data is divided into 100 sec bins |
 |
|
| Module-wise count rates for Quadrant A Data is divided into 100 sec bins |
 |
 |
| Module-wise count rates for Quadrant B Data is divided into 100 sec bins |
 |
 |
| Module-wise count rates for Quadrant C Data is divided into 100 sec bins |
 |
 |
| Module-wise count rates for Quadrant D Data is divided into 100 sec bins |
 |
 |
| Parameter | Plot |
|---|---|
| CZT HV Monitor |  |
| D_VDD | 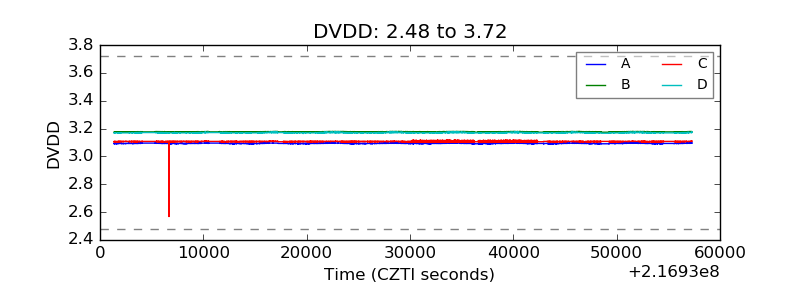 |
| Temperature 1 |  |
| Veto HV Monitor |  |
| Veto LLD |  |
| Alpha Counter |  |
| _CPM_Rate |  |
| CZT Counter |  |
| +2.5 Volts monitor | 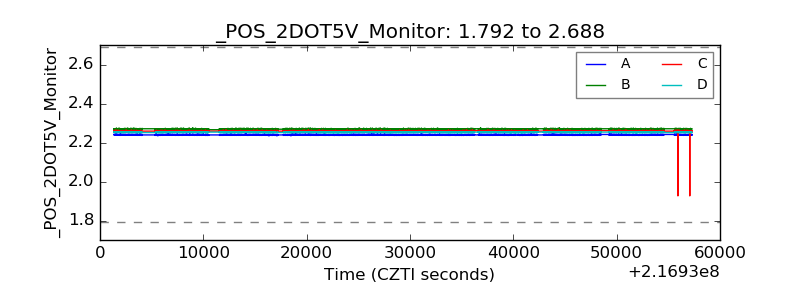 |
| +5 Volts monitor |  |
| _ROLL_ROT |  |
| _Roll_DEC |  |
| _Roll_RA | 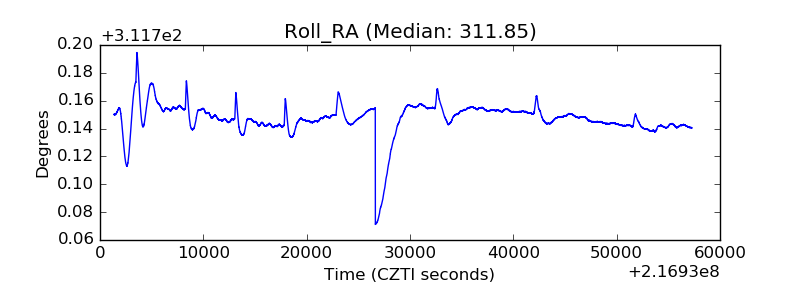 |
| Veto Counter |  |