| Param | Original file | Final file |
|---|---|---|
| Filename | modeM0/AS1C02_018T01_9000000798_06140cztM0_level2.evt | modeM0/AS1C02_018T01_9000000798_06140cztM0_level2_quad_clean.evt |
| Size (bytes) | 529,896,960 | 87,238,080 |
| Size | 505.3 MB | 83.2 MB |
| Events in quadrant A | 3,677,848 | 525,176 |
| Events in quadrant B | 4,247,913 | 533,820 |
| Events in quadrant C | 3,431,647 | 544,522 |
| Events in quadrant D | 4,176,726 | 511,576 |
| Mode M9 | |||
|---|---|---|---|
| Quadrant | BADHDUFLAG | Total packets | Discarded packets |
| A | 0 | 15 | 0 |
| B | 0 | 15 | 0 |
| C | 0 | 15 | 0 |
| D | 0 | 15 | 0 |
| Mode SS | |||
|---|---|---|---|
| Quadrant | BADHDUFLAG | Total packets | Discarded packets |
| A | 0 | 156 | 0 |
| B | 0 | 156 | 0 |
| C | 0 | 156 | 0 |
| D | 0 | 156 | 0 |
| Mode M0 | |||
|---|---|---|---|
| Quadrant | BADHDUFLAG | Total packets | Discarded packets |
| A | 0 | 16000 | 3 |
| B | 0 | 17782 | 2 |
| C | 0 | 15634 | 2 |
| D | 0 | 17947 | 2 |
| Quadrant | Total seconds | Saturated seconds | Saturation percentage |
|---|---|---|---|
| A | 7565 | 77 | 1.017845% |
| B | 7565 | 156 | 2.062128% |
| C | 7565 | 69 | 0.912095% |
| D | 7565 | 270 | 3.569068% |
Noise dominated data is calculated using 1-second bins in cleaned event files. If a bin has >2000 counts, and if more than 50% of those come from <1% of pixels, then it is considered to be noise-dominated and hence unusable.
| Quadrant | # 1 sec bins | Bins with >0 counts | Bins with >2000 counts | High rate bins dominated by noise | Noise dominated (total time) | Noise dominated (detector-on time) | Marked lightcurve |
|---|---|---|---|---|---|---|---|
| A | 9050 | 7568 | 7 | 7 | 0.08% | 0.09% | 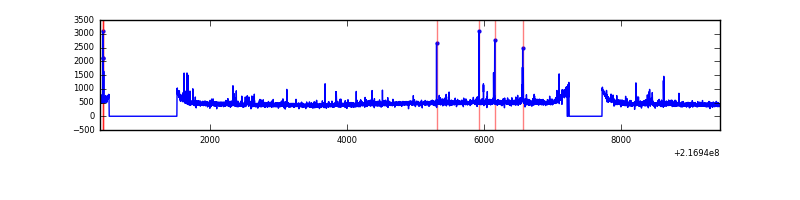 |
| B | 9050 | 7568 | 30 | 30 | 0.33% | 0.40% | 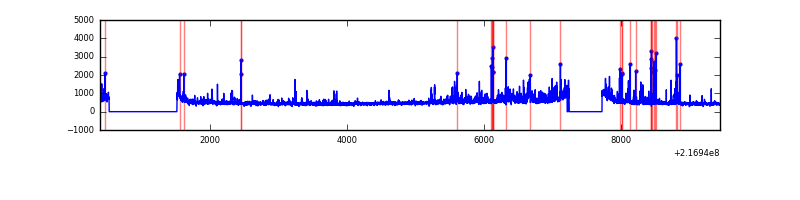 |
| C | 9050 | 7568 | 2 | 2 | 0.02% | 0.03% | 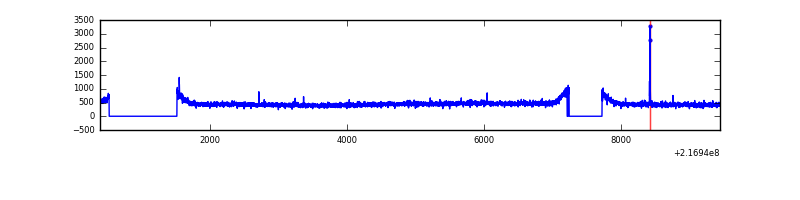 |
| D | 9050 | 7568 | 145 | 145 | 1.60% | 1.92% | 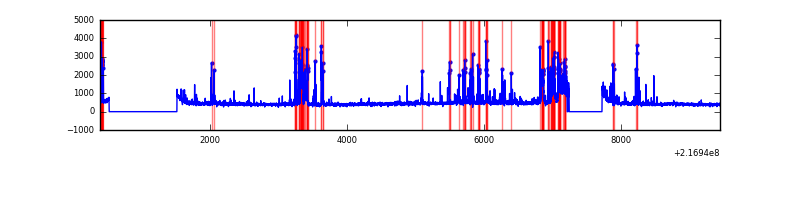 |
Top three noisy pixels from each quadrant. If the there are fewer than three noisy pixels in the level2.evt file, extra rows are filled as -1
| Pixel properties | Quadrant properties | ||||||
|---|---|---|---|---|---|---|---|
| Quadrant | DetID | PixID | Counts | Sigma | Mean | Median | Sigma |
| A | 8 | 15 | 172706 | 942.63 | 885 | 866 | 182.3 |
| A | 13 | 251 | 43456 | 233.63 | 885 | 866 | 182.3 |
| A | 4 | 2 | 29785 | 158.64 | 885 | 866 | 182.3 |
| B | 0 | 219 | 227359 | 1296.62 | 897 | 872 | 174.7 |
| B | 15 | 204 | 185675 | 1057.98 | 897 | 872 | 174.7 |
| B | 3 | 64 | 154668 | 880.47 | 897 | 872 | 174.7 |
| C | 1 | 16 | 23887 | 114.16 | 865 | 871 | 201.6 |
| C | 9 | 16 | 14626 | 68.22 | 865 | 871 | 201.6 |
| C | 9 | 54 | 14367 | 66.94 | 865 | 871 | 201.6 |
| D | 13 | 169 | 629912 | 2970.36 | 854 | 827 | 211.8 |
| D | 2 | 33 | 185663 | 872.74 | 854 | 827 | 211.8 |
| D | 8 | 195 | 61057 | 284.39 | 854 | 827 | 211.8 |
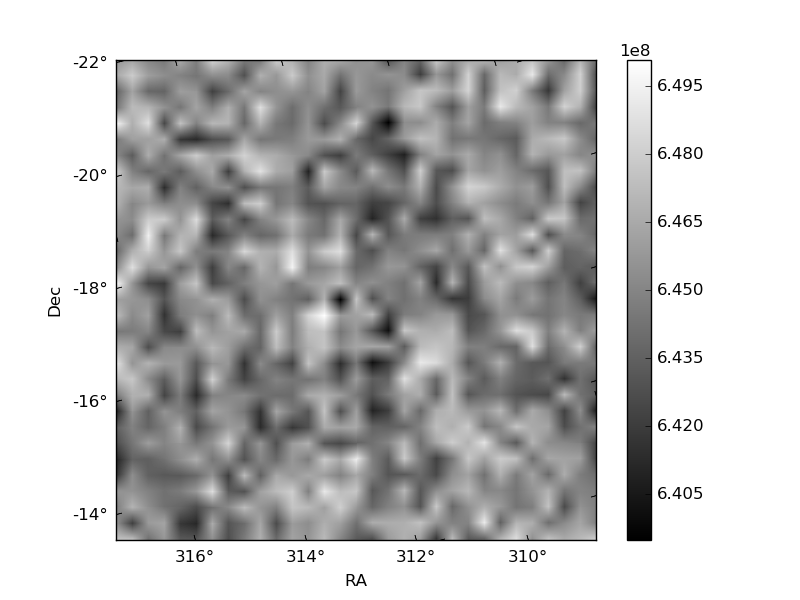
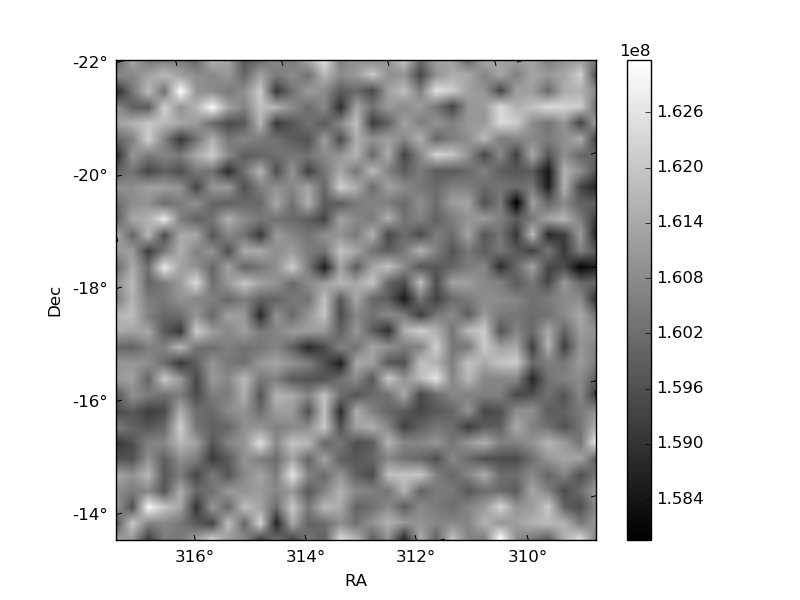
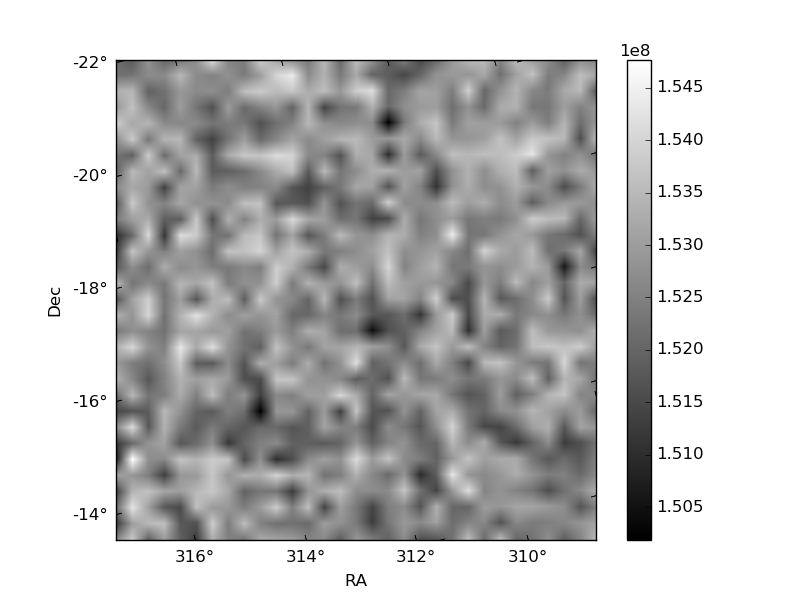
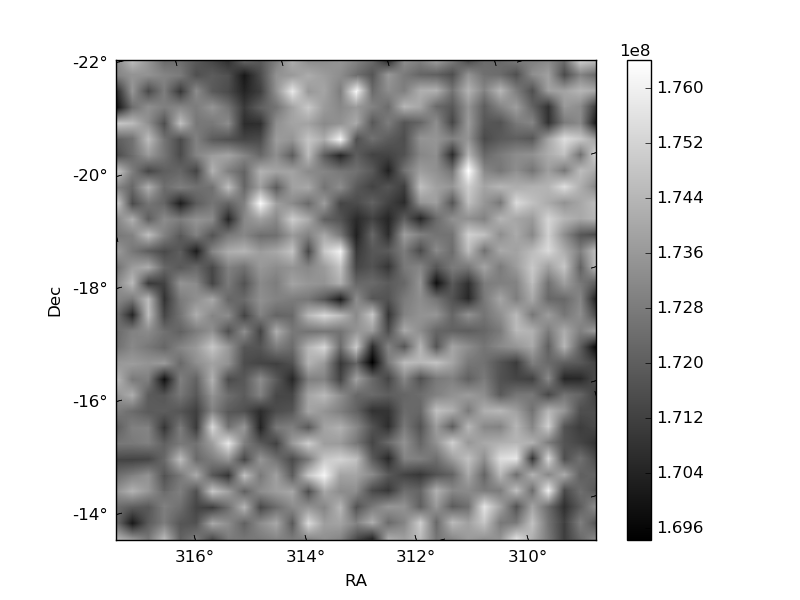
Histogram calculated using DETX and DETY for each event in the final _common_clean file
| Quadrant A | 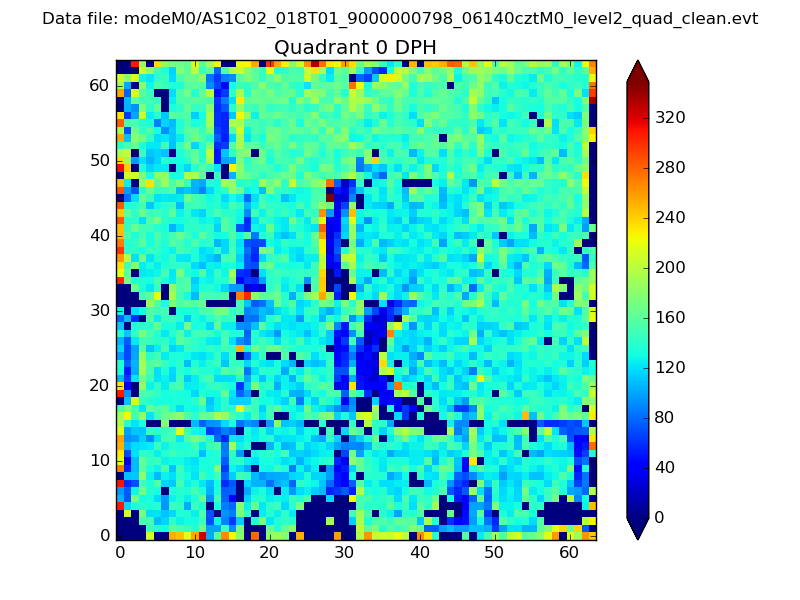 |
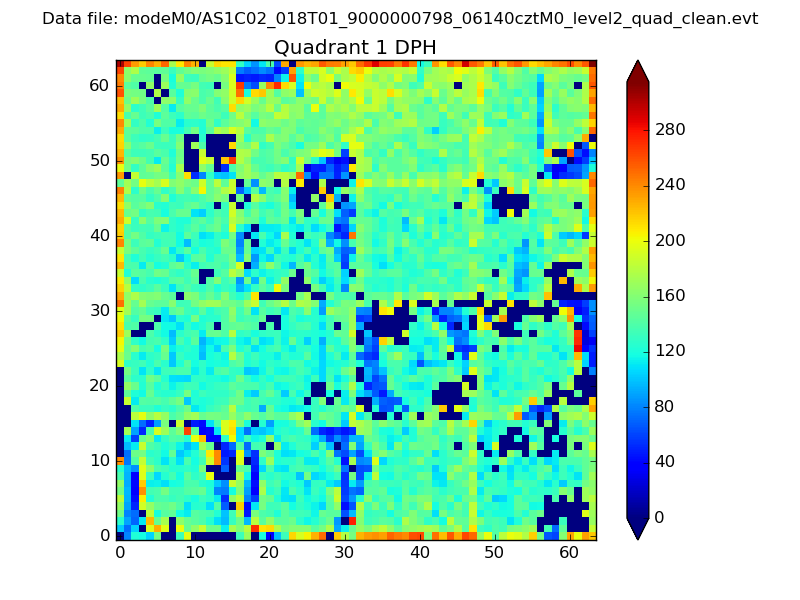 |
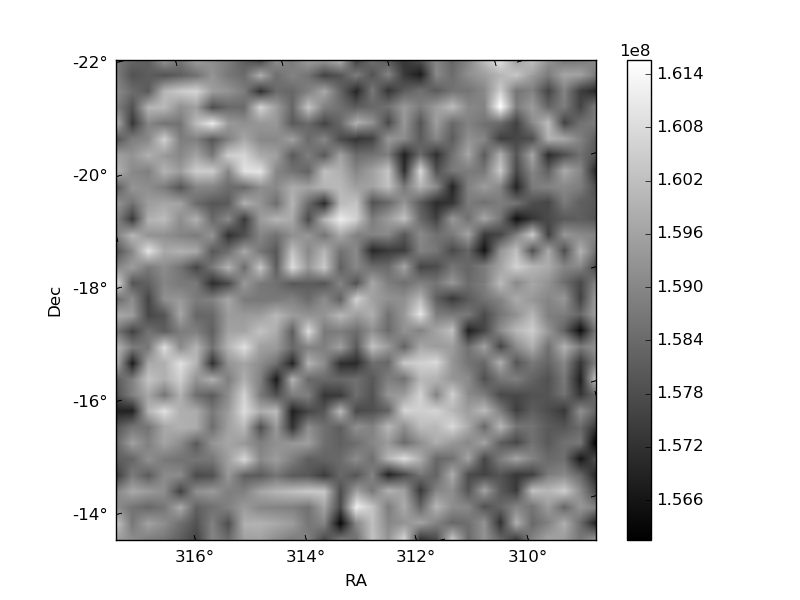
Quadrant B |
|---|---|---|---|
| Quadrant D | 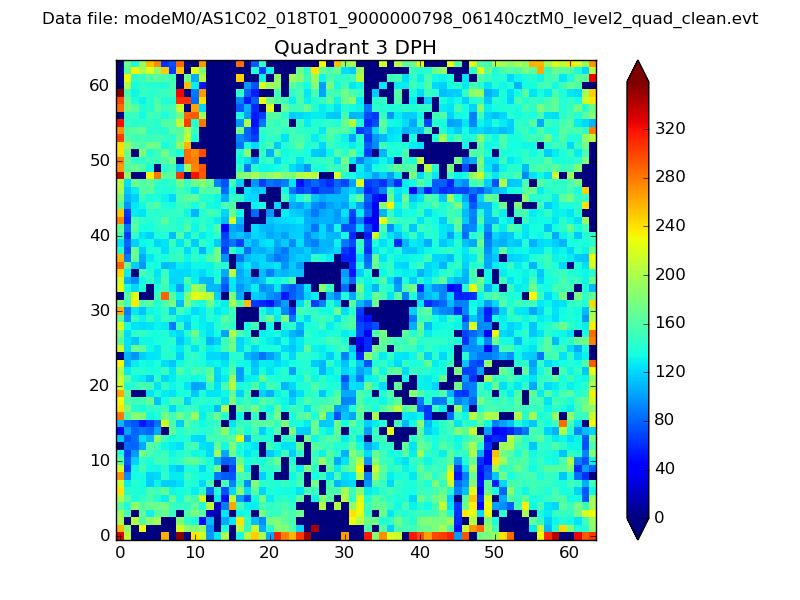 |
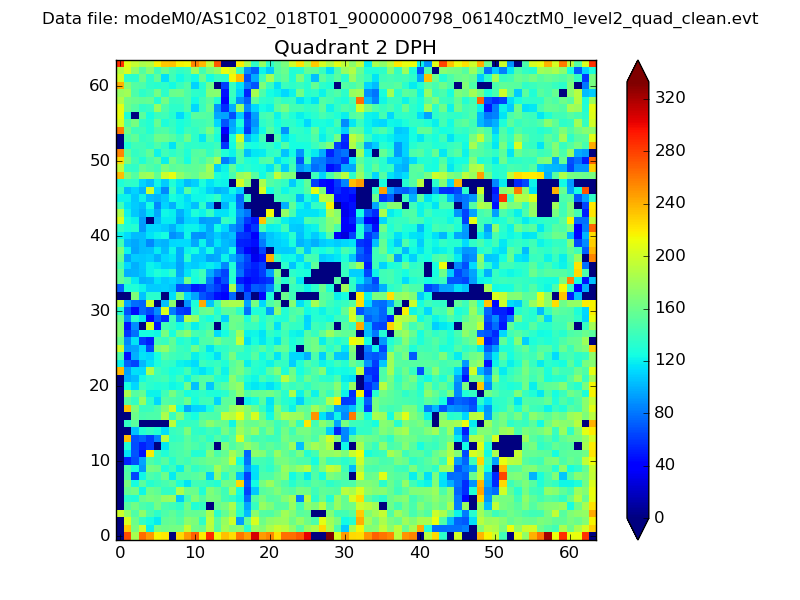 |
Quadrant C |
| Plot type | Count rate plots | Images |
|---|---|---|
| Comparison with Poisson distribution Blue bars denote a histogram of data divided into 1 sec bins. Red curve is a Poisson curve with rate = median count rate of data. |
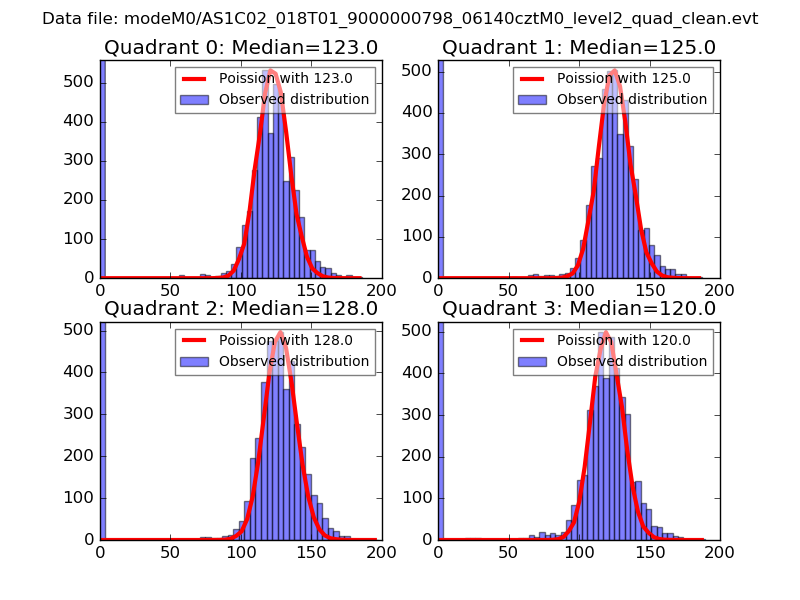 |
 |
| Quadrant-wise count rates Data is divided into 100 sec bins |
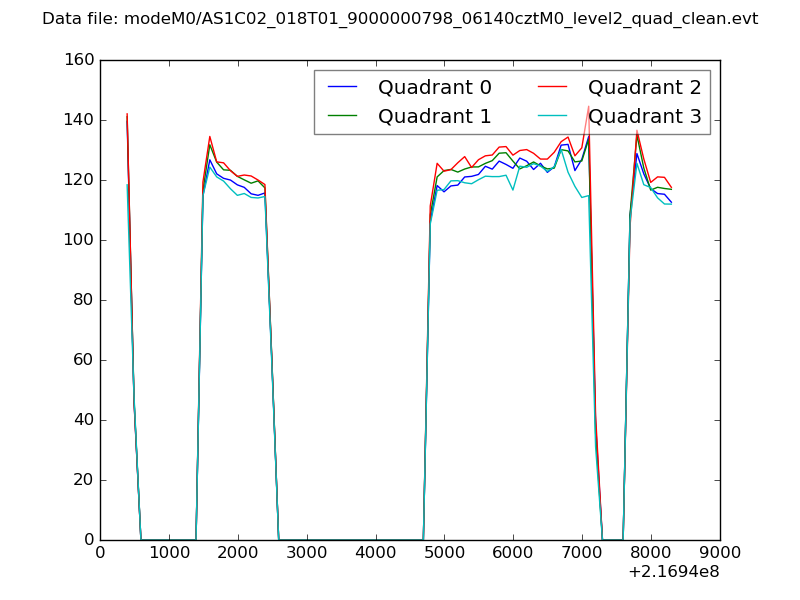 |
|
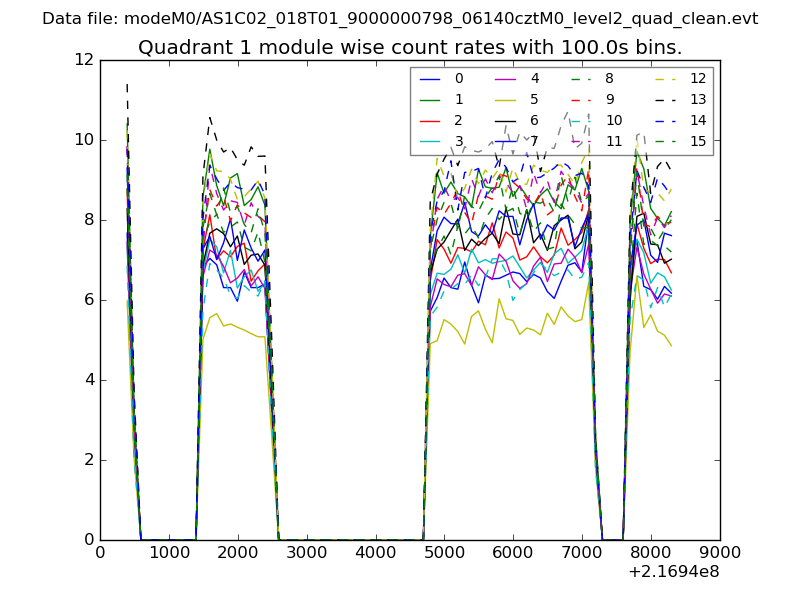
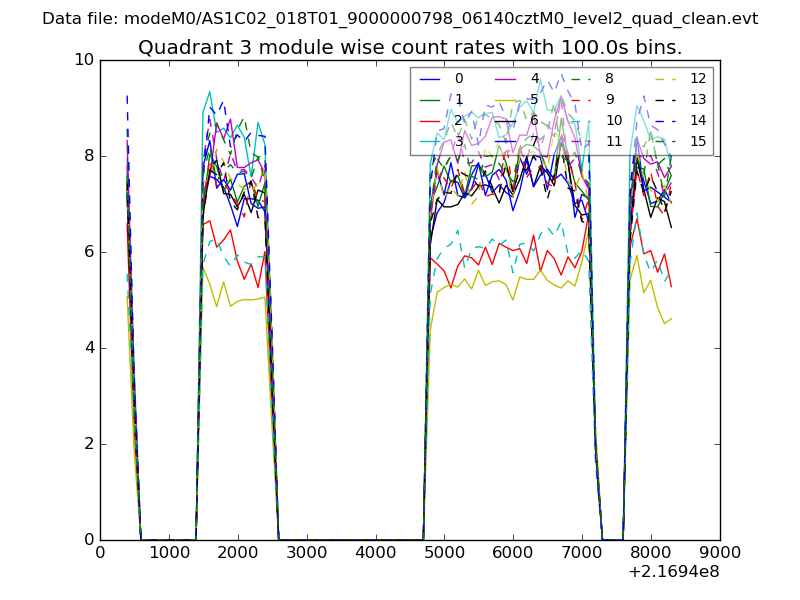
| Module-wise count rates for Quadrant A Data is divided into 100 sec bins |
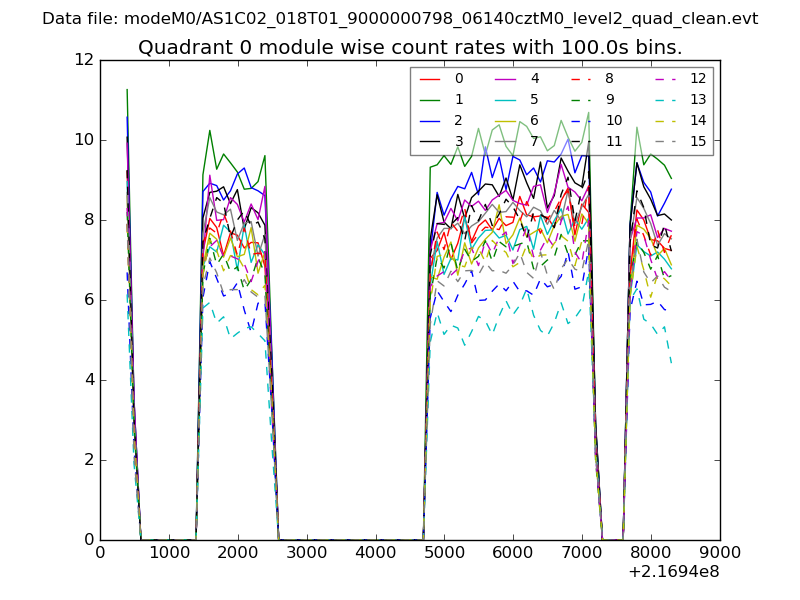 |
 |
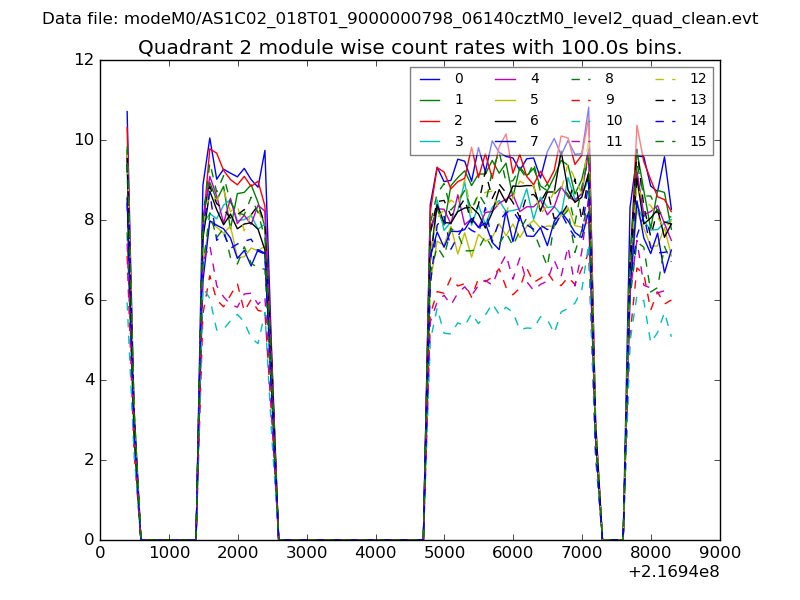
| Module-wise count rates for Quadrant B Data is divided into 100 sec bins |
 |
 |
| Module-wise count rates for Quadrant C Data is divided into 100 sec bins |
 |
 |
| Module-wise count rates for Quadrant D Data is divided into 100 sec bins |
 |
 |
| Parameter | Plot |
|---|---|
| CZT HV Monitor | 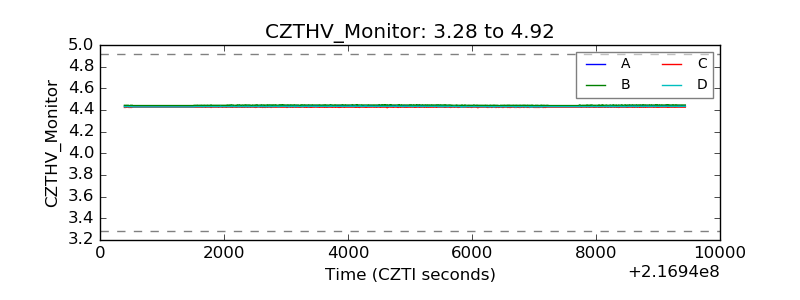 |
| D_VDD | 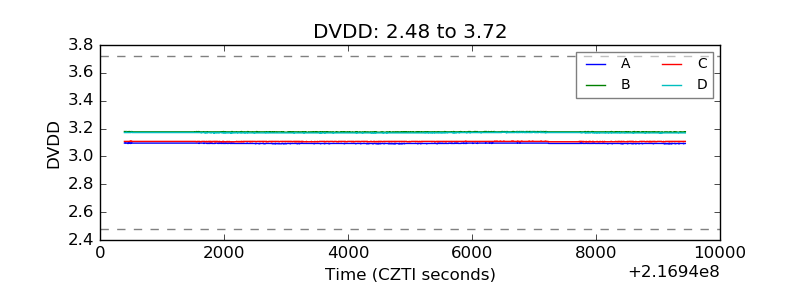 |
| Temperature 1 | 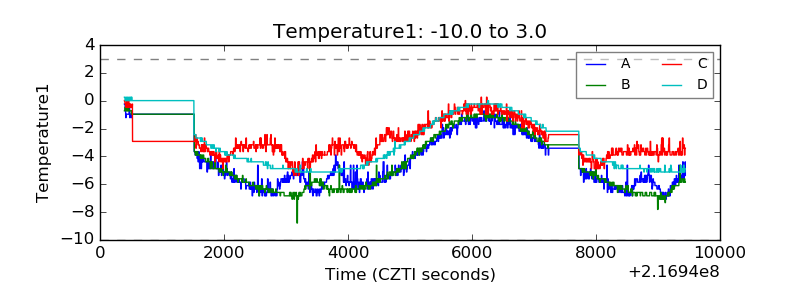 |
| Veto HV Monitor | 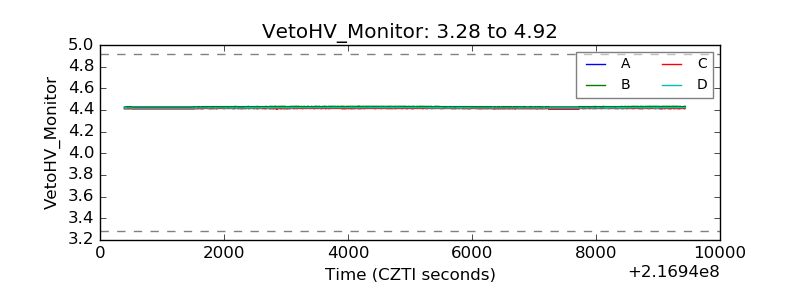 |
| Veto LLD | 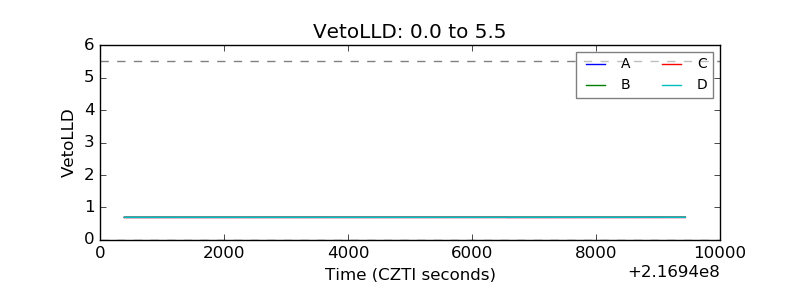 |
| Alpha Counter | 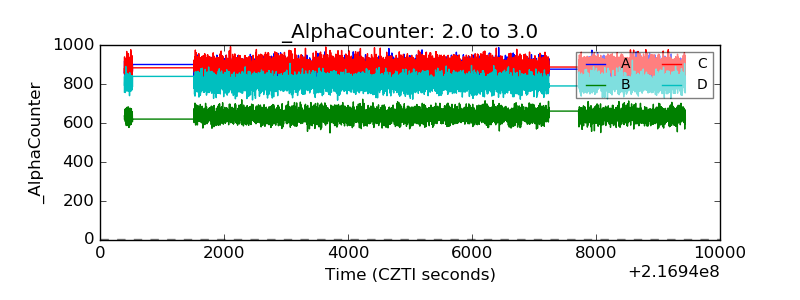 |
| _CPM_Rate | 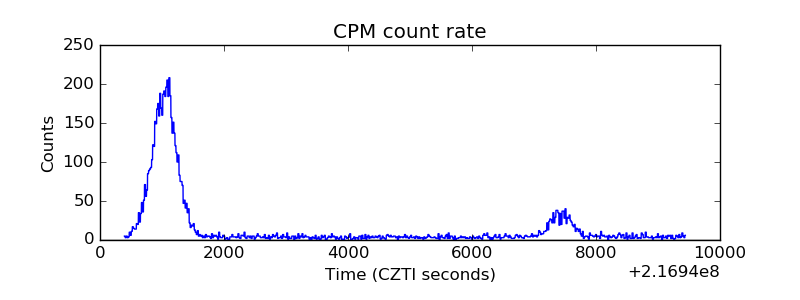 |
| CZT Counter | 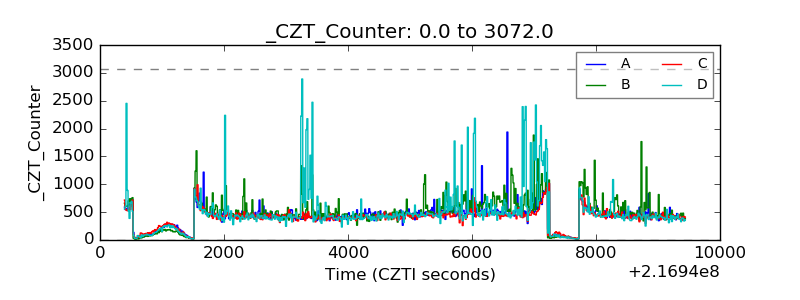 |
| +2.5 Volts monitor |  |
| +5 Volts monitor | 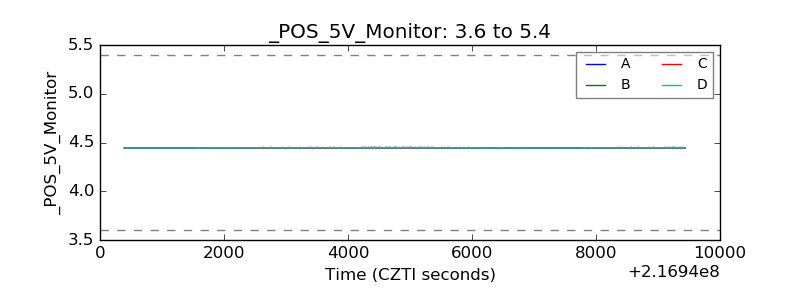 |
| _ROLL_ROT | 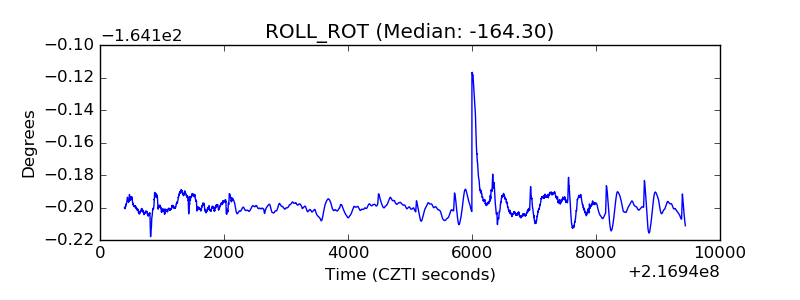 |
| _Roll_DEC | 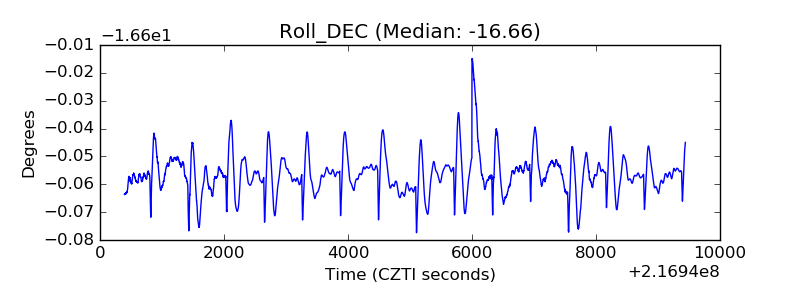 |
| _Roll_RA | 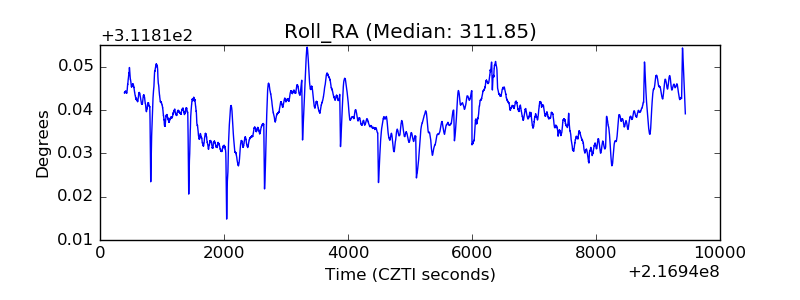 |
| Veto Counter | 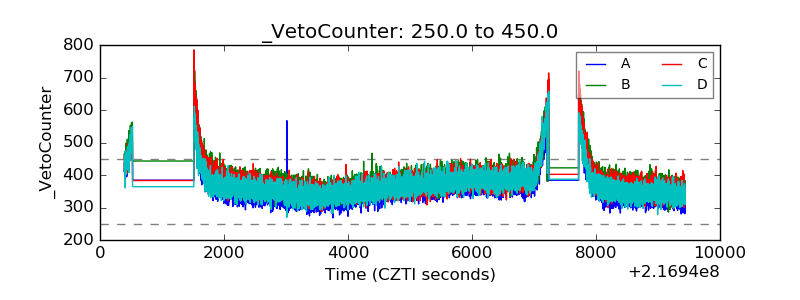 |