| Param | Original file | Final file |
|---|---|---|
| Filename | modeM0/AS1C02_018T01_9000000798_06141cztM0_level2.evt | modeM0/AS1C02_018T01_9000000798_06141cztM0_level2_quad_clean.evt |
| Size (bytes) | 538,764,480 | 88,128,000 |
| Size | 513.8 MB | 84.0 MB |
| Events in quadrant A | 3,907,783 | 519,304 |
| Events in quadrant B | 4,399,715 | 528,844 |
| Events in quadrant C | 3,688,949 | 546,074 |
| Events in quadrant D | 3,779,587 | 521,146 |
| Mode M9 | |||
|---|---|---|---|
| Quadrant | BADHDUFLAG | Total packets | Discarded packets |
| A | 0 | 1 | 0 |
| B | 0 | 1 | 0 |
| C | 0 | 1 | 0 |
| D | 0 | 2 | 0 |
| Mode SS | |||
|---|---|---|---|
| Quadrant | BADHDUFLAG | Total packets | Discarded packets |
| A | 0 | 158 | 0 |
| B | 0 | 158 | 0 |
| C | 0 | 158 | 0 |
| D | 0 | 158 | 0 |
| Mode M0 | |||
|---|---|---|---|
| Quadrant | BADHDUFLAG | Total packets | Discarded packets |
| A | 0 | 17028 | 2 |
| B | 0 | 18449 | 3 |
| C | 0 | 16773 | 1 |
| D | 0 | 17101 | 1 |
| Quadrant | Total seconds | Saturated seconds | Saturation percentage |
|---|---|---|---|
| A | 7961 | 190 | 2.386635% |
| B | 7960 | 332 | 4.170854% |
| C | 7961 | 140 | 1.758573% |
| D | 7961 | 104 | 1.306369% |
Noise dominated data is calculated using 1-second bins in cleaned event files. If a bin has >2000 counts, and if more than 50% of those come from <1% of pixels, then it is considered to be noise-dominated and hence unusable.
| Quadrant | # 1 sec bins | Bins with >0 counts | Bins with >2000 counts | High rate bins dominated by noise | Noise dominated (total time) | Noise dominated (detector-on time) | Marked lightcurve |
|---|---|---|---|---|---|---|---|
| A | 7961 | 7961 | 1 | 1 | 0.01% | 0.01% |  |
| B | 7961 | 7961 | 62 | 62 | 0.78% | 0.78% |  |
| C | 7961 | 7961 | 2 | 2 | 0.03% | 0.03% |  |
| D | 7961 | 7961 | 11 | 11 | 0.14% | 0.14% |  |
Top three noisy pixels from each quadrant. If the there are fewer than three noisy pixels in the level2.evt file, extra rows are filled as -1
| Pixel properties | Quadrant properties | ||||||
|---|---|---|---|---|---|---|---|
| Quadrant | DetID | PixID | Counts | Sigma | Mean | Median | Sigma |
| A | 8 | 15 | 130147 | 652.34 | 957 | 936 | 198.1 |
| A | 4 | 2 | 55004 | 272.97 | 957 | 936 | 198.1 |
| A | 12 | 227 | 10669 | 49.14 | 957 | 936 | 198.1 |
| B | 3 | 64 | 378315 | 1992.05 | 965 | 941 | 189.4 |
| B | 0 | 219 | 86125 | 449.66 | 965 | 941 | 189.4 |
| B | 15 | 204 | 53604 | 277.99 | 965 | 941 | 189.4 |
| C | 9 | 54 | 15654 | 66.73 | 939 | 946 | 220.4 |
| C | 13 | 61 | 7490 | 29.69 | 939 | 946 | 220.4 |
| C | 9 | 16 | 4797 | 17.47 | 939 | 946 | 220.4 |
| D | 13 | 169 | 116677 | 503.25 | 936 | 907 | 230.0 |
| D | 8 | 195 | 55761 | 238.45 | 936 | 907 | 230.0 |
| D | 5 | 97 | 24437 | 102.28 | 936 | 907 | 230.0 |
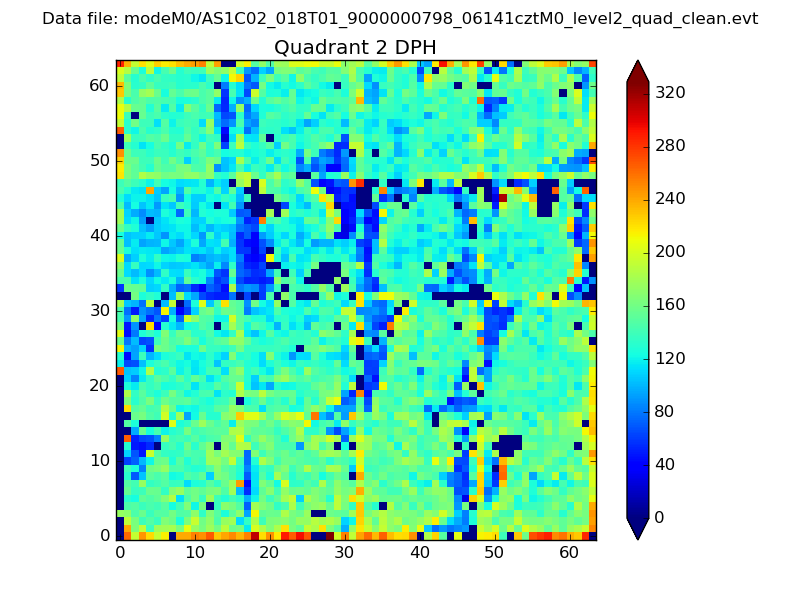
Histogram calculated using DETX and DETY for each event in the final _common_clean file
| Quadrant A | 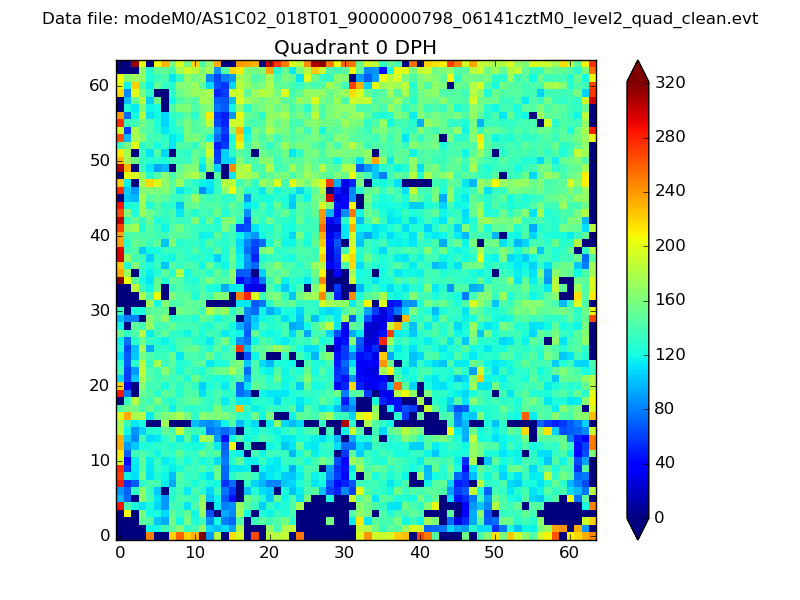 |
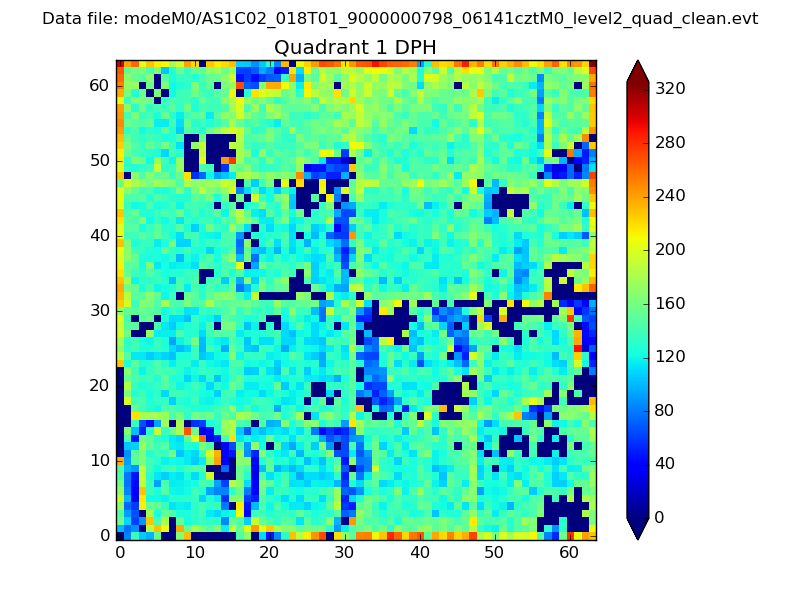 |
Quadrant B |
|---|---|---|---|
| Quadrant D | 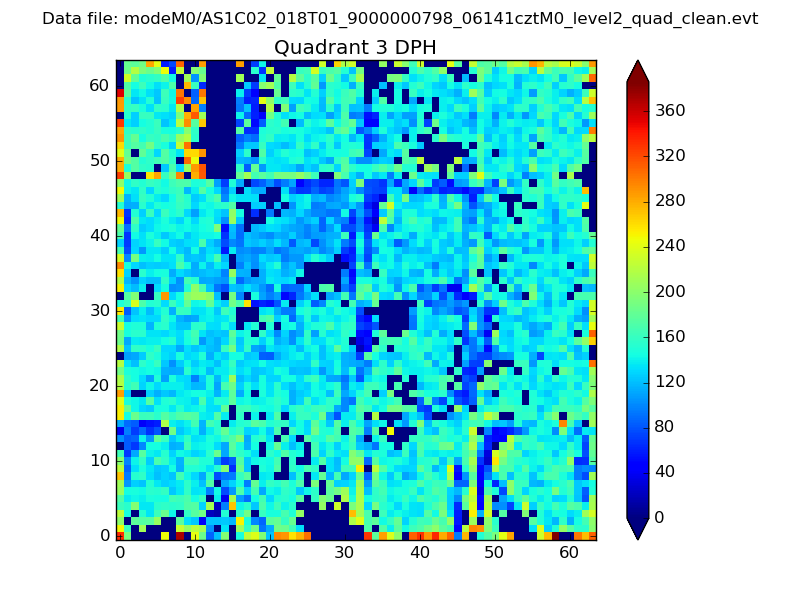 |
 |
Quadrant C |
| Plot type | Count rate plots | Images |
|---|---|---|
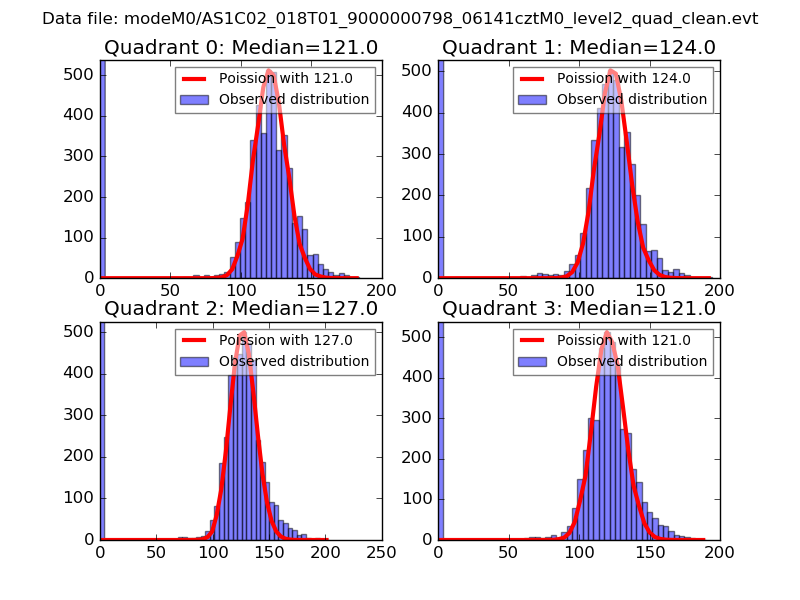
| Comparison with Poisson distribution Blue bars denote a histogram of data divided into 1 sec bins. Red curve is a Poisson curve with rate = median count rate of data. |
 |
 |
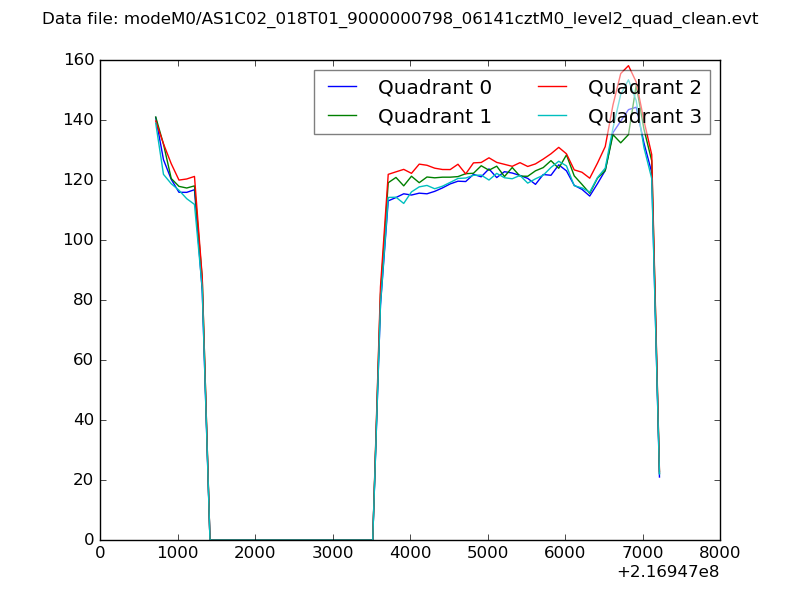
| Quadrant-wise count rates Data is divided into 100 sec bins |
 |
|
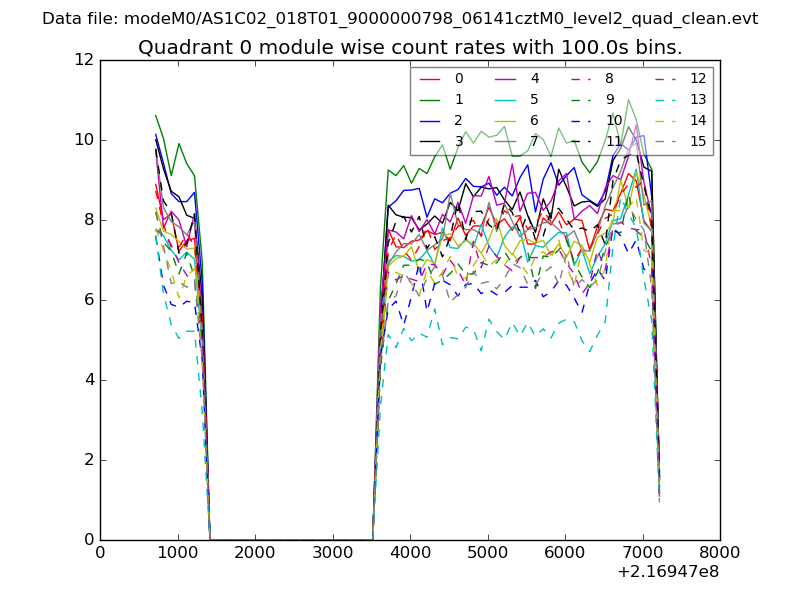
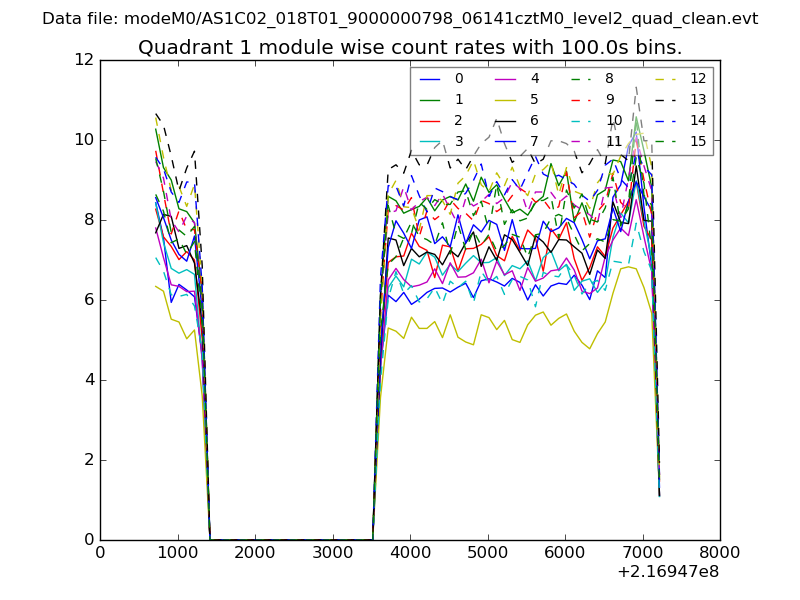
| Module-wise count rates for Quadrant A Data is divided into 100 sec bins |
 |
 |
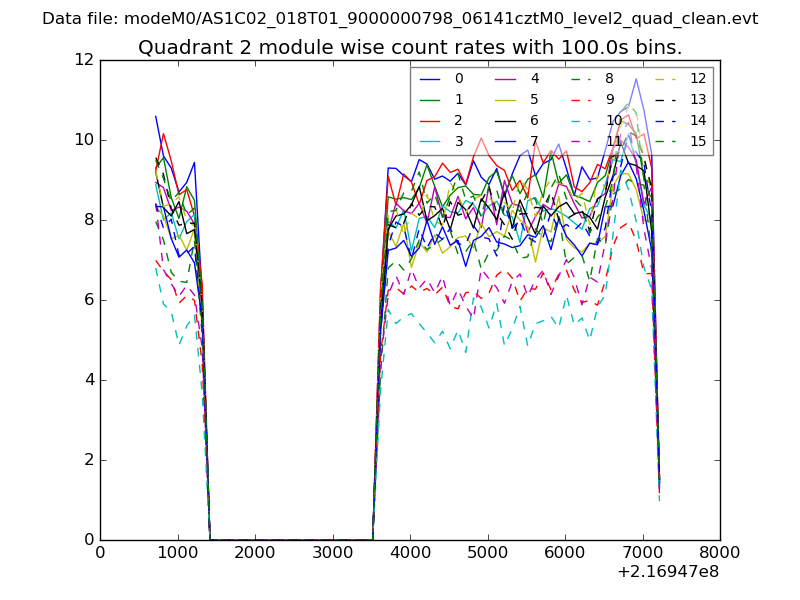
| Module-wise count rates for Quadrant B Data is divided into 100 sec bins |
 |
 |
| Module-wise count rates for Quadrant C Data is divided into 100 sec bins |
 |
 |
| Module-wise count rates for Quadrant D Data is divided into 100 sec bins |
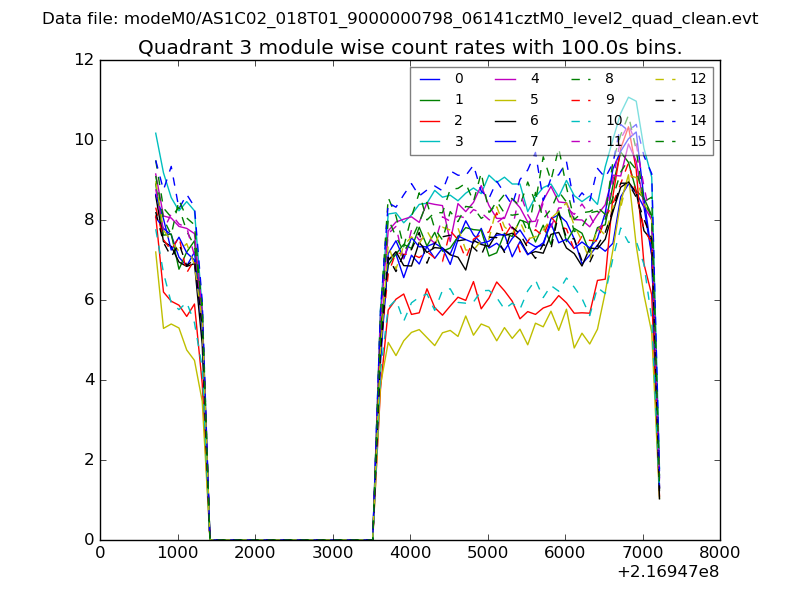 |
 |
| Parameter | Plot |
|---|---|
| CZT HV Monitor | 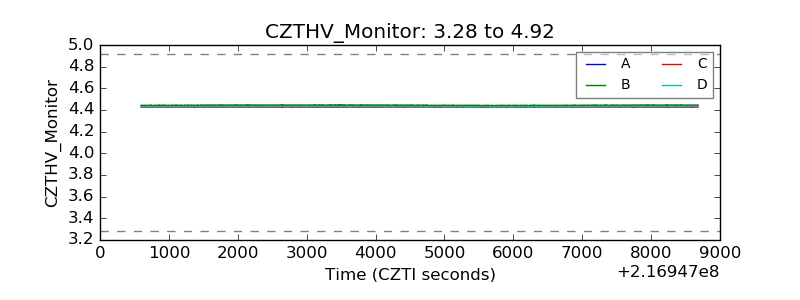 |
| D_VDD | 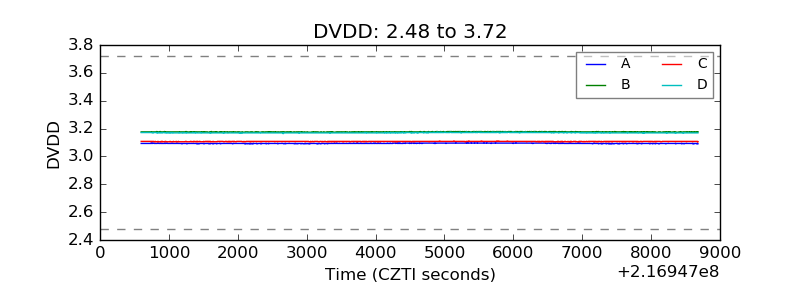 |
| Temperature 1 | 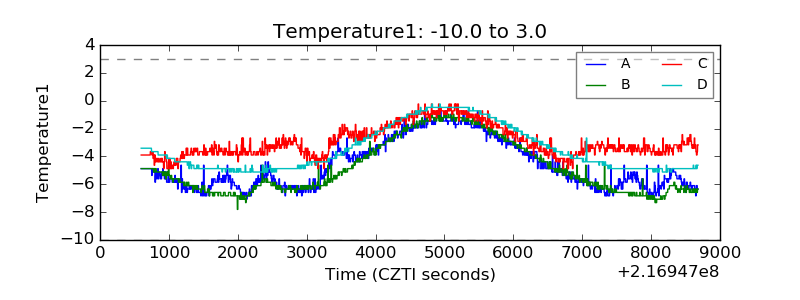 |
| Veto HV Monitor | 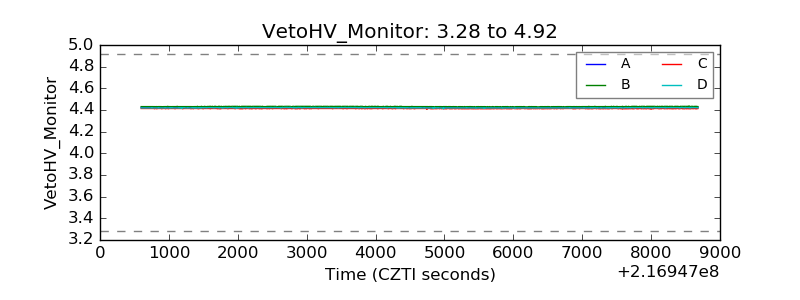 |
| Veto LLD | 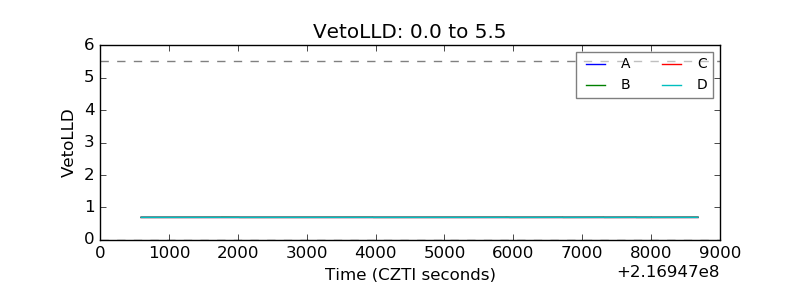 |
| Alpha Counter |  |
| _CPM_Rate | 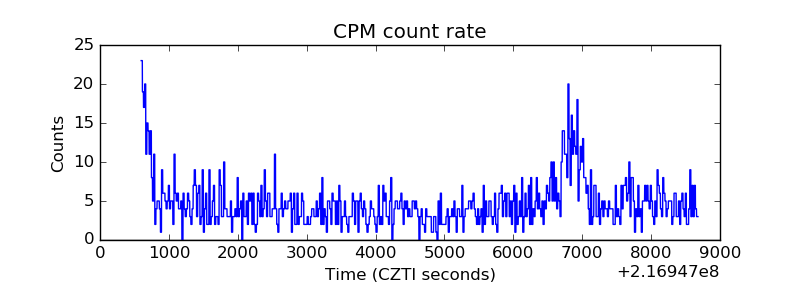 |
| CZT Counter | 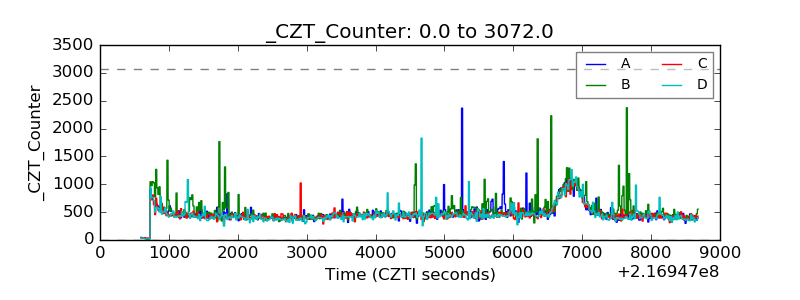 |
| +2.5 Volts monitor | 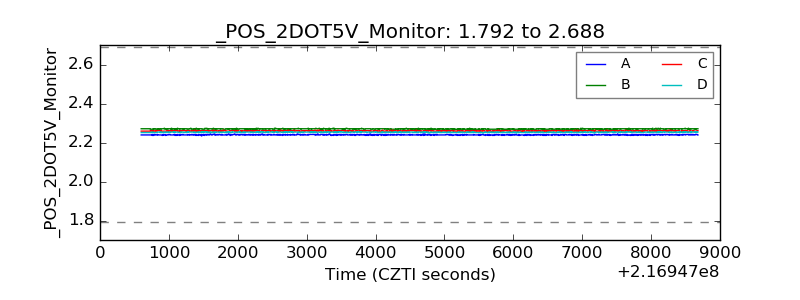 |
| +5 Volts monitor |  |
| _ROLL_ROT | 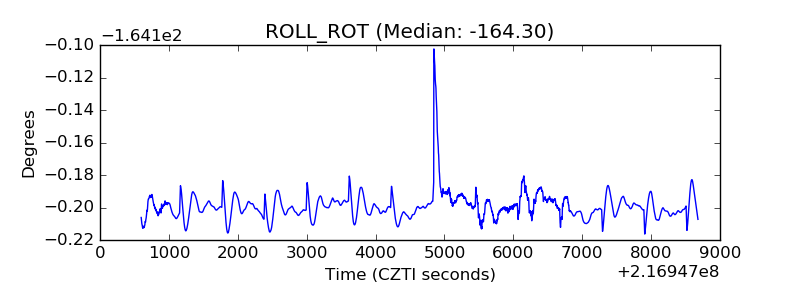 |
| _Roll_DEC | 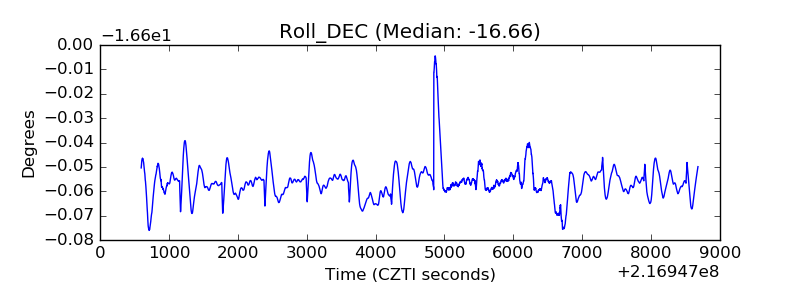 |
| _Roll_RA | 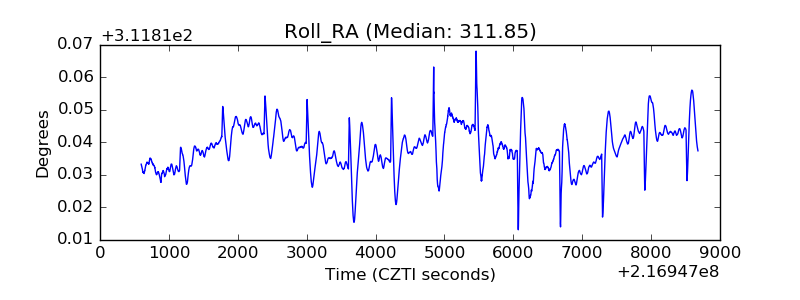 |
| Veto Counter | 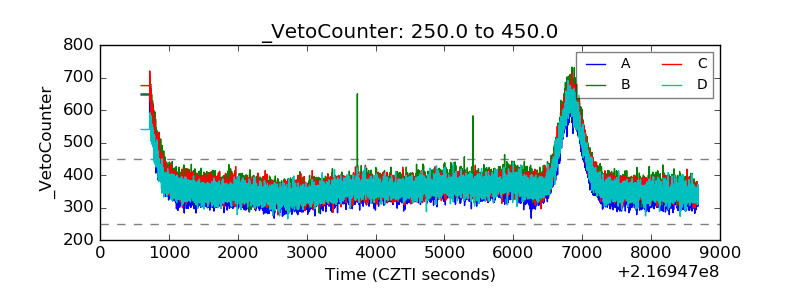 |