| Param | Original file | Final file |
|---|---|---|
| Filename | modeM0/AS1C02_018T01_9000000798_06142cztM0_level2.evt | modeM0/AS1C02_018T01_9000000798_06142cztM0_level2_quad_clean.evt |
| Size (bytes) | 448,479,360 | 69,180,480 |
| Size | 427.7 MB | 66.0 MB |
| Events in quadrant A | 3,223,165 | 405,914 |
| Events in quadrant B | 3,857,737 | 406,563 |
| Events in quadrant C | 3,000,420 | 424,512 |
| Events in quadrant D | 3,060,385 | 406,834 |
| Mode SS | |||
|---|---|---|---|
| Quadrant | BADHDUFLAG | Total packets | Discarded packets |
| A | 0 | 148 | 22 |
| B | 0 | 148 | 14 |
| C | 0 | 148 | 18 |
| D | 0 | 148 | 16 |
| Mode M0 | |||
|---|---|---|---|
| Quadrant | BADHDUFLAG | Total packets | Discarded packets |
| A | 0 | 15746 | 1826 |
| B | 0 | 18389 | 2649 |
| C | 0 | 15395 | 1798 |
| D | 0 | 15631 | 1790 |
| Quadrant | Total seconds | Saturated seconds | Saturation percentage |
|---|---|---|---|
| A | 6473 | 238 | 3.676811% |
| B | 6387 | 382 | 5.980899% |
| C | 6468 | 189 | 2.922078% |
| D | 6478 | 205 | 3.164557% |
Noise dominated data is calculated using 1-second bins in cleaned event files. If a bin has >2000 counts, and if more than 50% of those come from <1% of pixels, then it is considered to be noise-dominated and hence unusable.
| Quadrant | # 1 sec bins | Bins with >0 counts | Bins with >2000 counts | High rate bins dominated by noise | Noise dominated (total time) | Noise dominated (detector-on time) | Marked lightcurve |
|---|---|---|---|---|---|---|---|
| A | 7389 | 6928 | 0 | 0 | 0.00% | 0.00% | 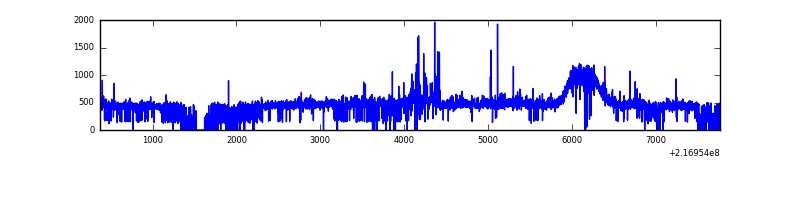 |
| B | 7388 | 6862 | 62 | 62 | 0.84% | 0.90% | 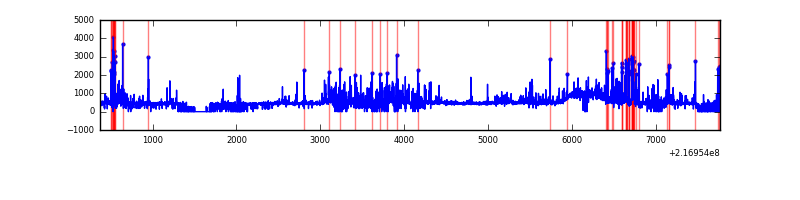 |
| C | 7389 | 6923 | 0 | 0 | 0.00% | 0.00% | 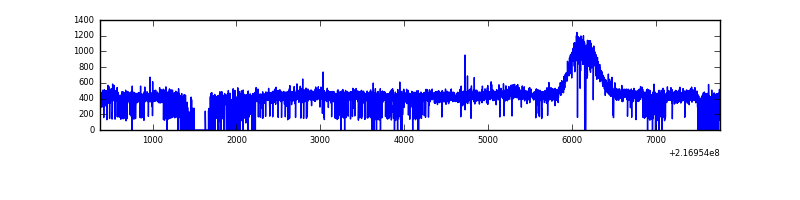 |
| D | 7389 | 6939 | 6 | 6 | 0.08% | 0.09% | 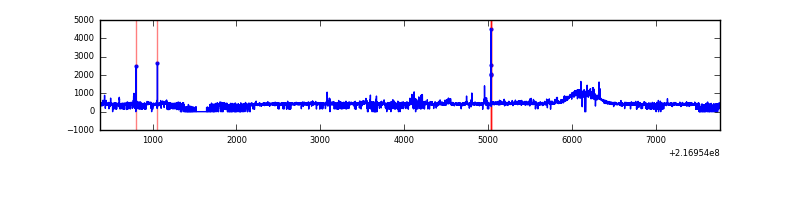 |
Top three noisy pixels from each quadrant. If the there are fewer than three noisy pixels in the level2.evt file, extra rows are filled as -1
| Pixel properties | Quadrant properties | ||||||
|---|---|---|---|---|---|---|---|
| Quadrant | DetID | PixID | Counts | Sigma | Mean | Median | Sigma |
| A | 8 | 15 | 209616 | 1283.53 | 780 | 761 | 162.7 |
| A | 0 | 226 | 7555 | 41.75 | 780 | 761 | 162.7 |
| A | 12 | 194 | 7495 | 41.38 | 780 | 761 | 162.7 |
| B | 3 | 64 | 457709 | 3017.13 | 773 | 753 | 151.5 |
| B | 0 | 219 | 322208 | 2122.46 | 773 | 753 | 151.5 |
| B | 0 | 214 | 27769 | 178.38 | 773 | 753 | 151.5 |
| C | 13 | 61 | 6299 | 30.55 | 766 | 772 | 180.9 |
| C | 8 | 128 | 3910 | 17.34 | 766 | 772 | 180.9 |
| C | 9 | 16 | 3299 | 13.97 | 766 | 772 | 180.9 |
| D | 14 | 173 | 51275 | 266.53 | 765 | 739 | 189.6 |
| D | 13 | 169 | 33287 | 171.66 | 765 | 739 | 189.6 |
| D | 5 | 97 | 32932 | 169.79 | 765 | 739 | 189.6 |
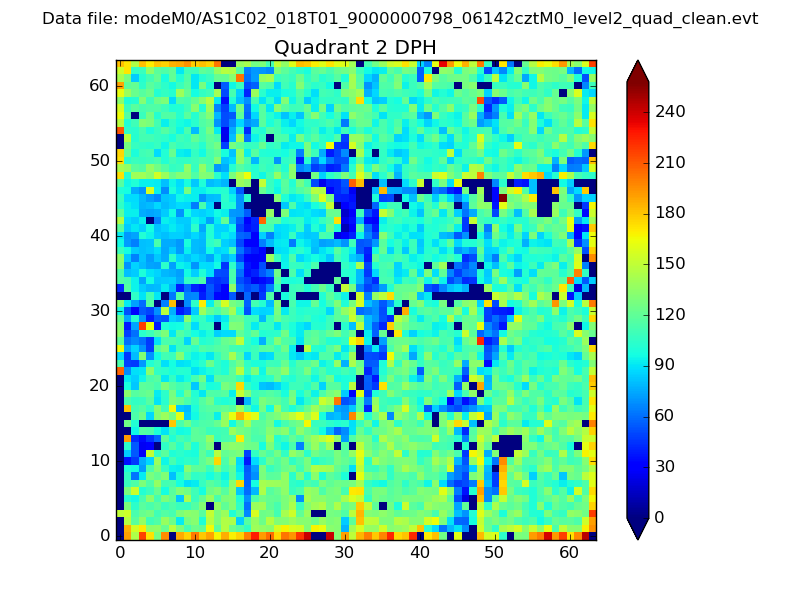
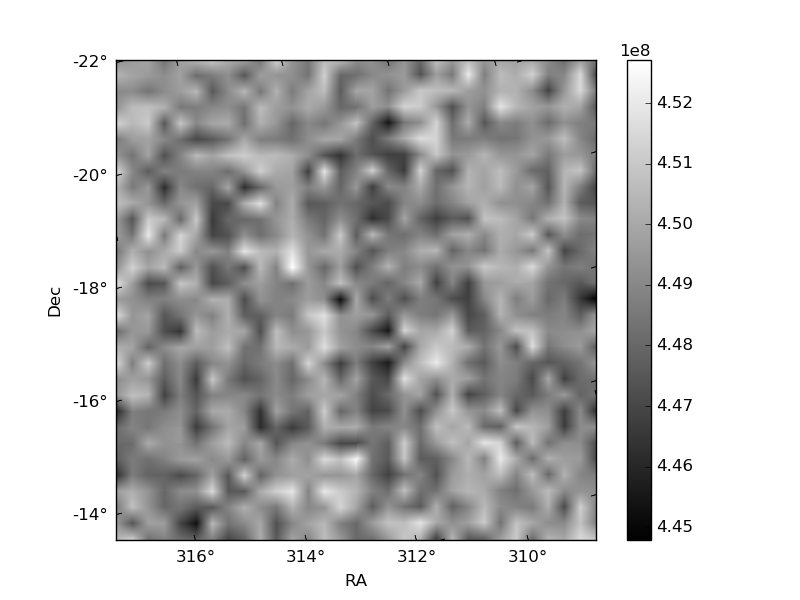
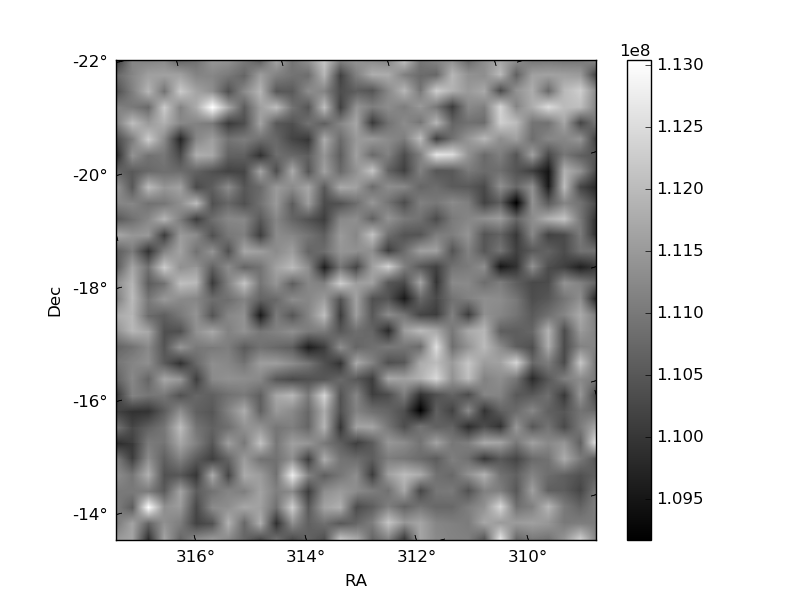
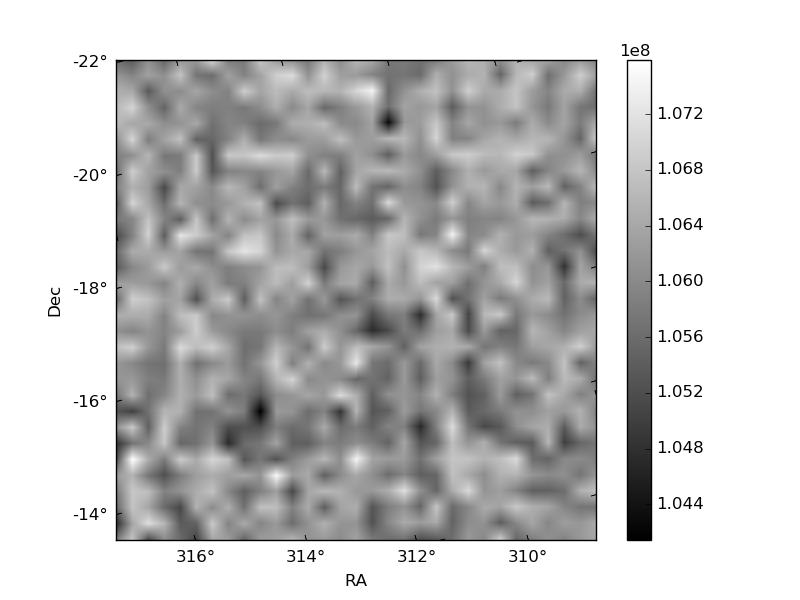
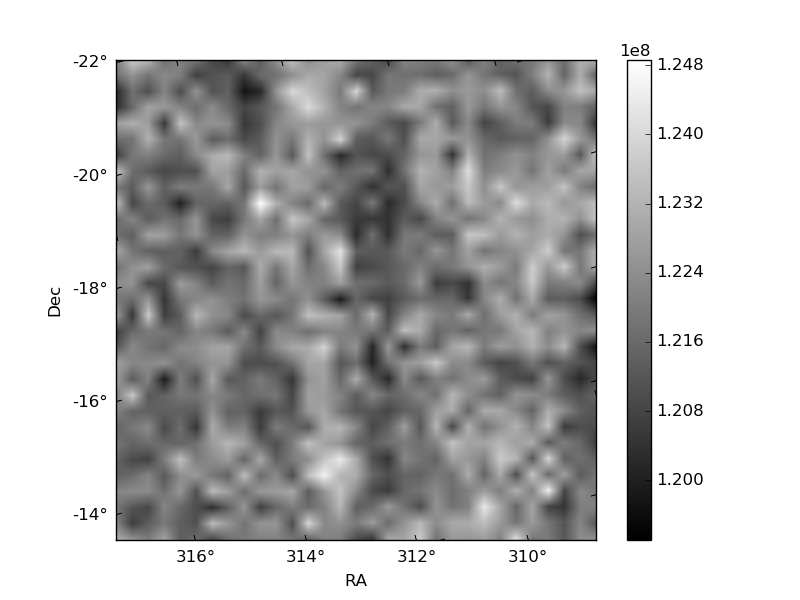
Histogram calculated using DETX and DETY for each event in the final _common_clean file
| Quadrant A | 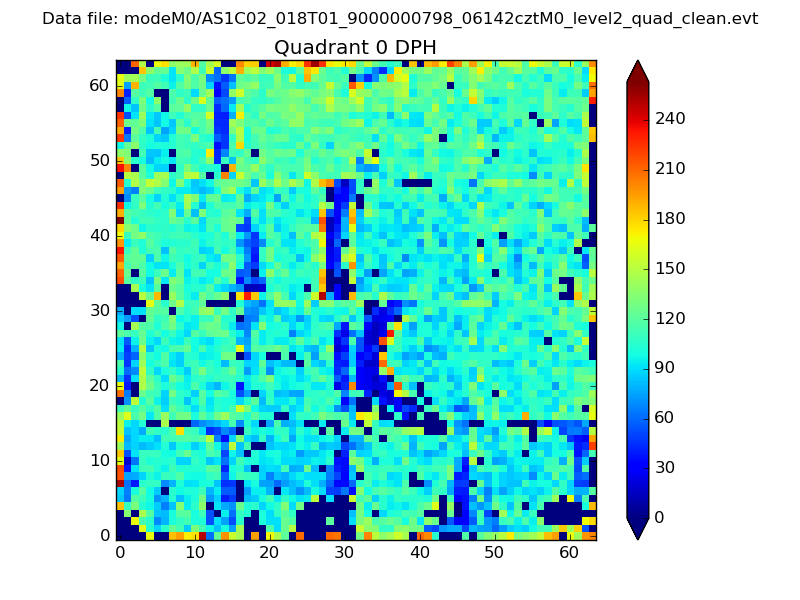 |
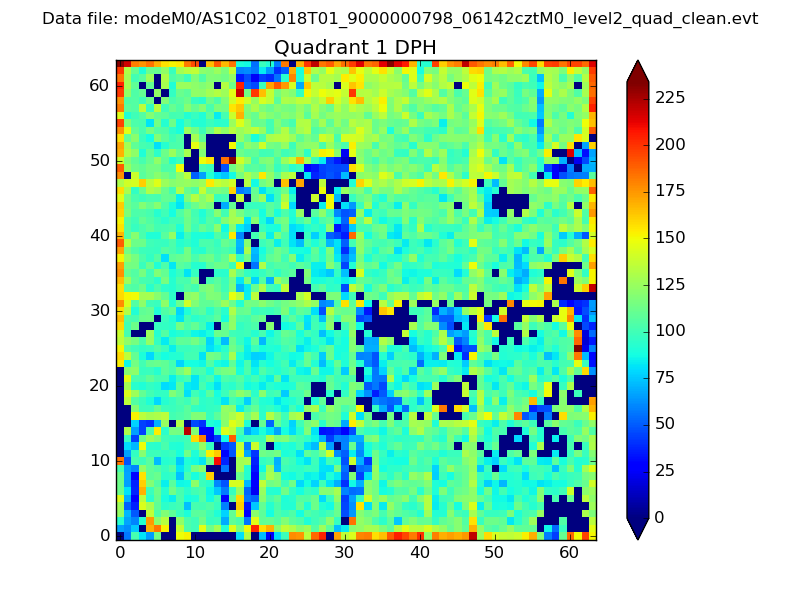 |
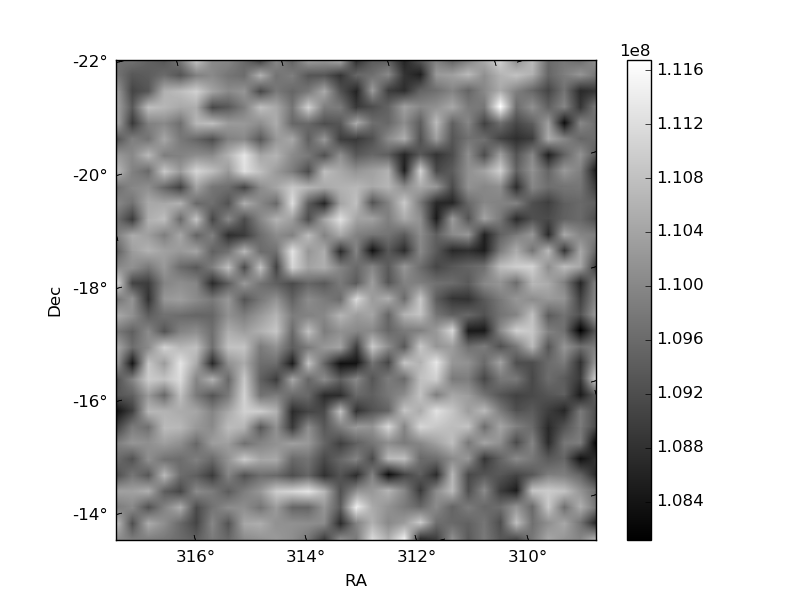
Quadrant B |
|---|---|---|---|
| Quadrant D | 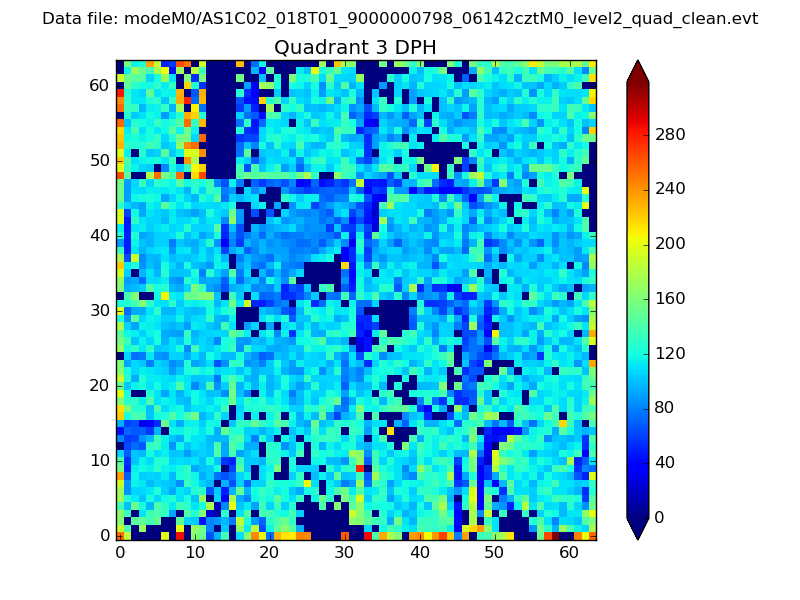 |
 |
Quadrant C |
| Plot type | Count rate plots | Images |
|---|---|---|
| Comparison with Poisson distribution Blue bars denote a histogram of data divided into 1 sec bins. Red curve is a Poisson curve with rate = median count rate of data. |
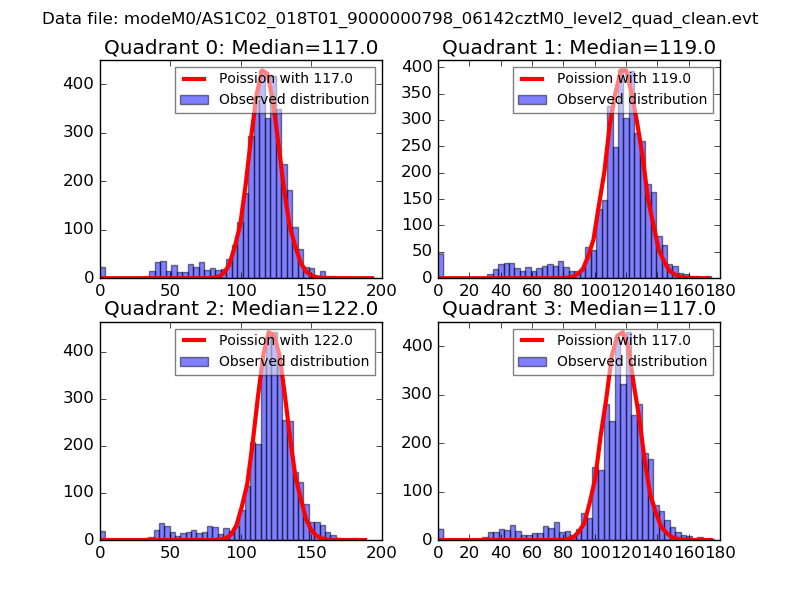 |
 |
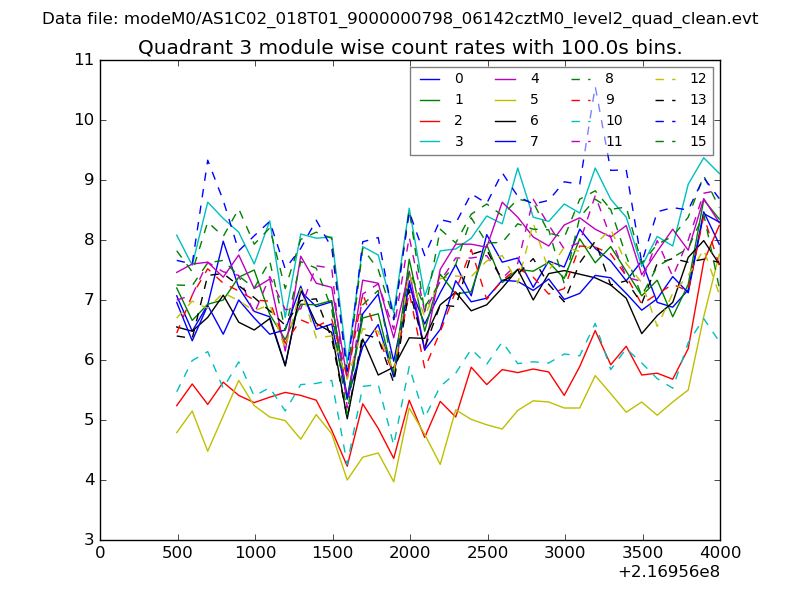
| Quadrant-wise count rates Data is divided into 100 sec bins |
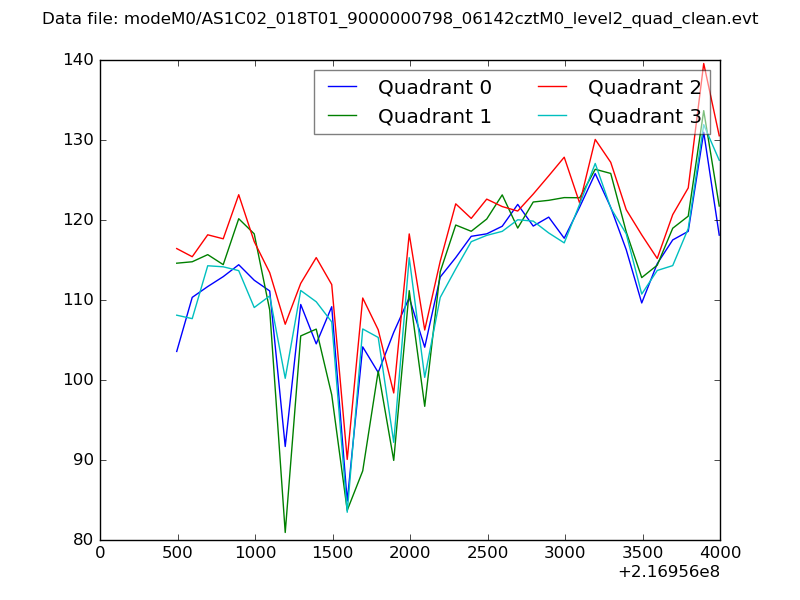 |
|
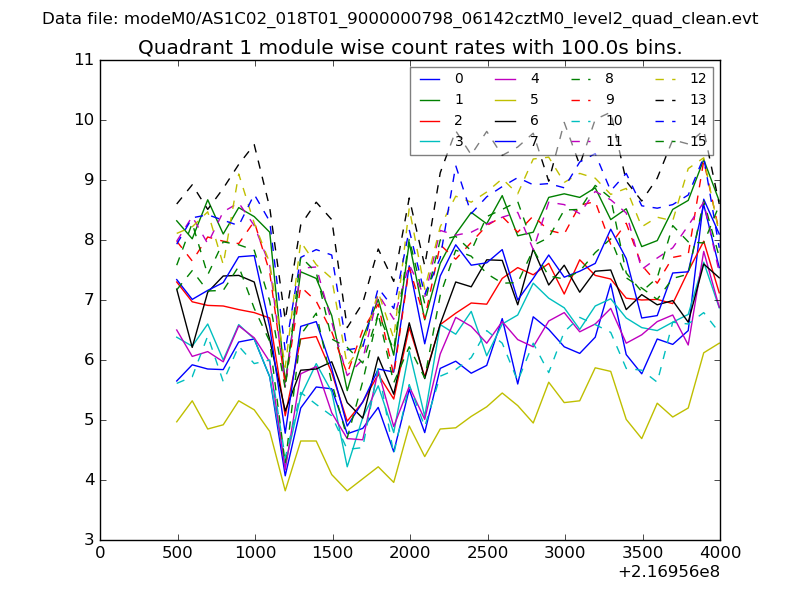
| Module-wise count rates for Quadrant A Data is divided into 100 sec bins |
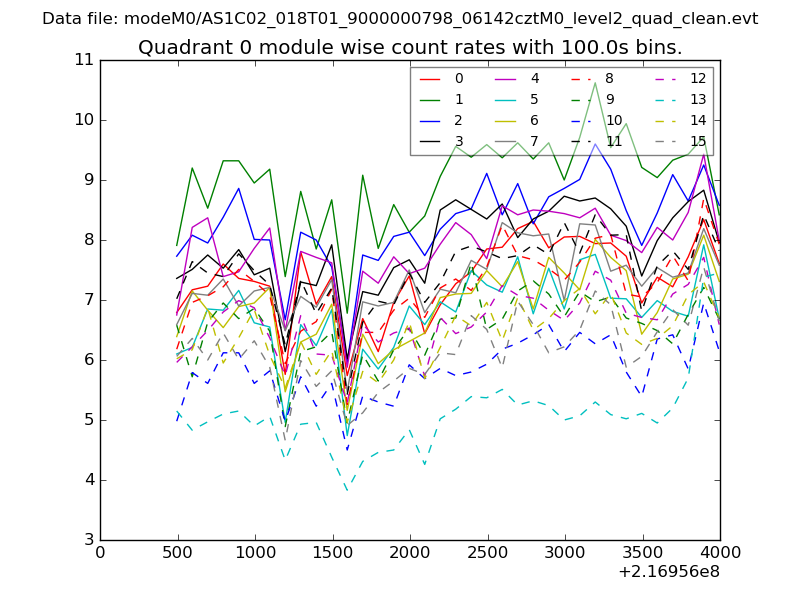 |
 |
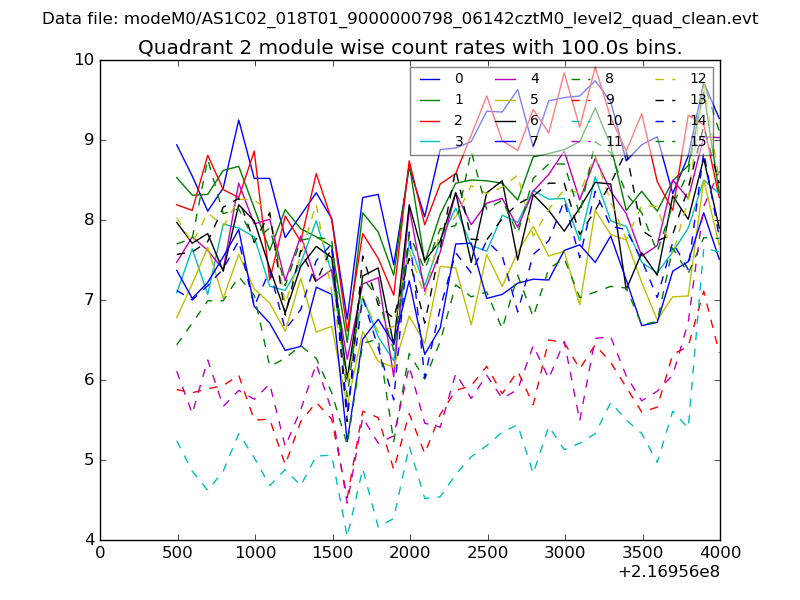
| Module-wise count rates for Quadrant B Data is divided into 100 sec bins |
 |
 |
| Module-wise count rates for Quadrant C Data is divided into 100 sec bins |
 |
 |
| Module-wise count rates for Quadrant D Data is divided into 100 sec bins |
 |
 |
| Parameter | Plot |
|---|---|
| CZT HV Monitor | 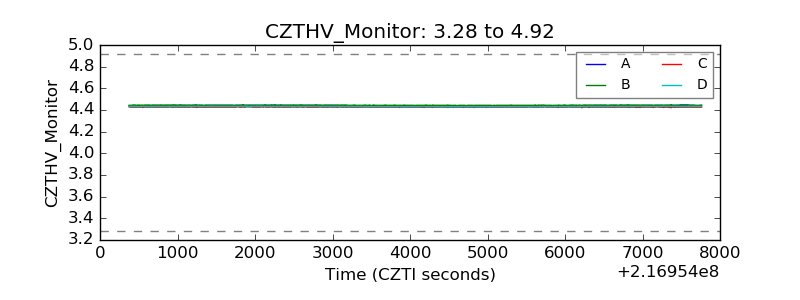 |
| D_VDD | 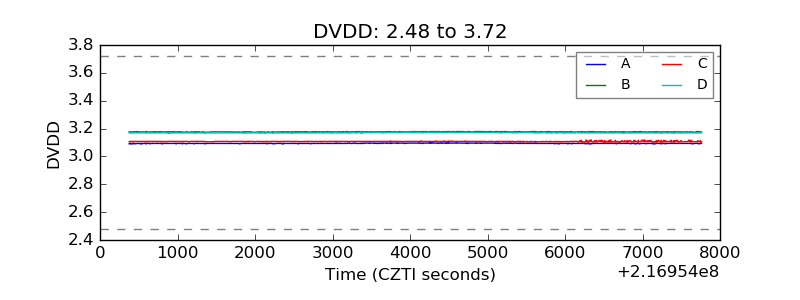 |
| Temperature 1 | 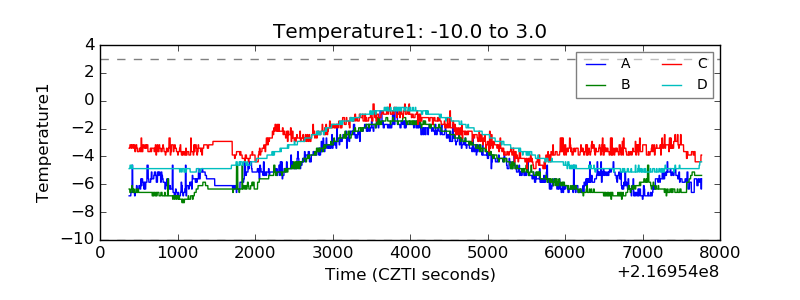 |
| Veto HV Monitor | 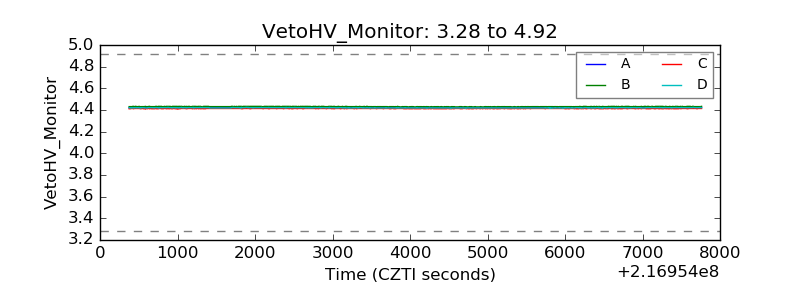 |
| Veto LLD | 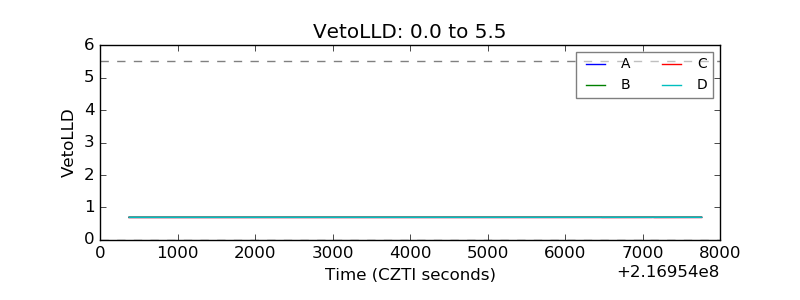 |
| Alpha Counter | 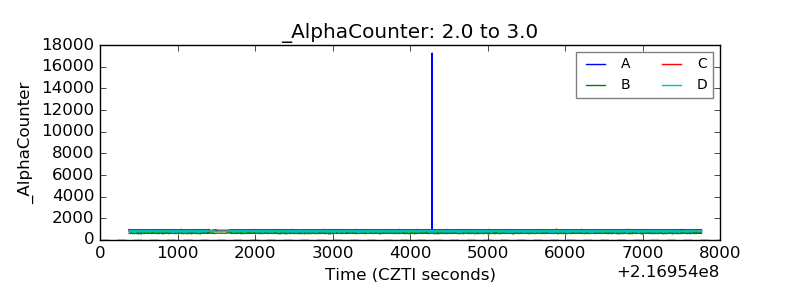 |
| _CPM_Rate | 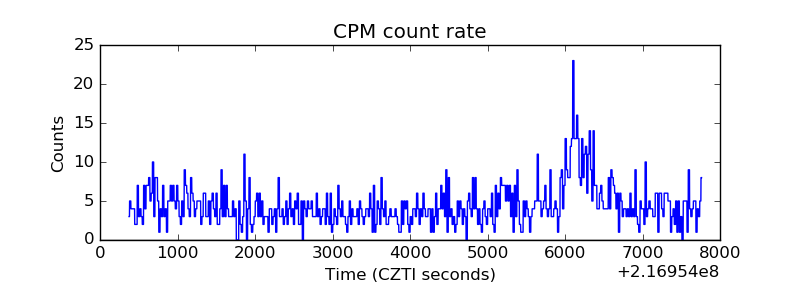 |
| CZT Counter | 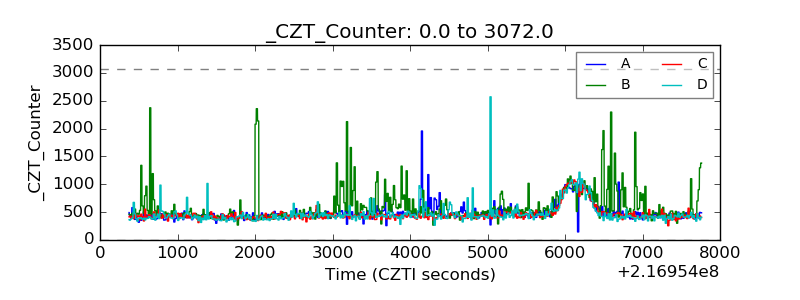 |
| +2.5 Volts monitor |  |
| +5 Volts monitor |  |
| _ROLL_ROT | 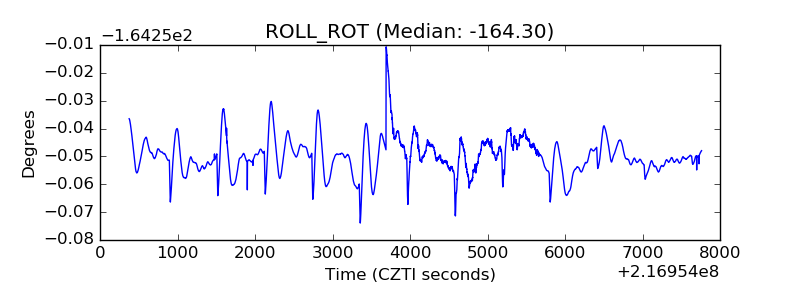 |
| _Roll_DEC | 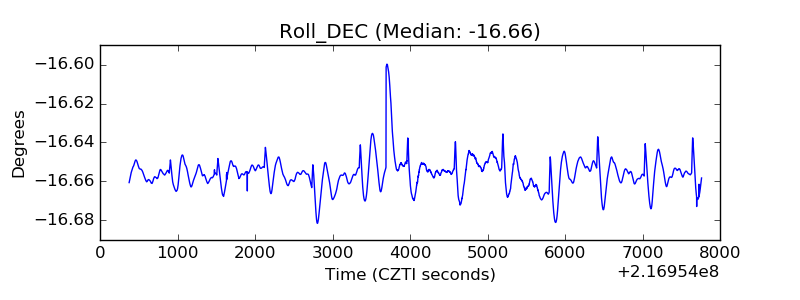 |
| _Roll_RA | 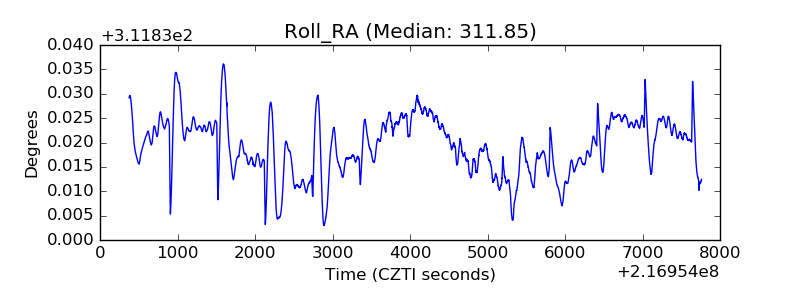 |
| Veto Counter | 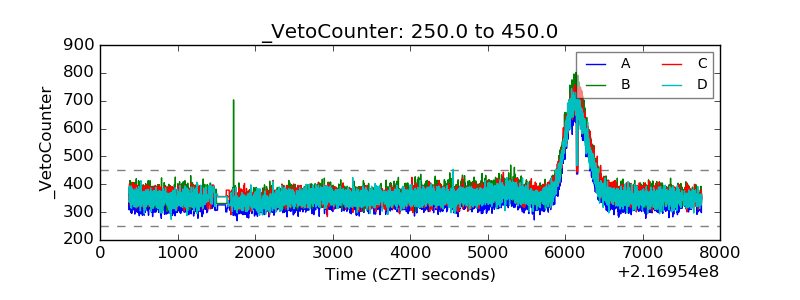 |