| Param | Original file | Final file |
|---|---|---|
| Filename | modeM0/AS1C02_018T01_9000000798_06145cztM0_level2.evt | modeM0/AS1C02_018T01_9000000798_06145cztM0_level2_quad_clean.evt |
| Size (bytes) | 997,525,440 | 170,596,800 |
| Size | 951.3 MB | 162.7 MB |
| Events in quadrant A | 7,541,365 | 1,016,643 |
| Events in quadrant B | 8,486,801 | 1,048,127 |
| Events in quadrant C | 6,547,224 | 1,071,615 |
| Events in quadrant D | 6,653,667 | 1,032,054 |
| Mode M9 | |||
|---|---|---|---|
| Quadrant | BADHDUFLAG | Total packets | Discarded packets |
| A | 0 | 16 | 1 |
| B | 0 | 16 | 1 |
| C | 0 | 16 | 1 |
| D | 0 | 16 | 1 |
| Mode SS | |||
|---|---|---|---|
| Quadrant | BADHDUFLAG | Total packets | Discarded packets |
| A | 0 | 375 | 97 |
| B | 0 | 374 | 90 |
| C | 0 | 376 | 80 |
| D | 0 | 374 | 66 |
| Mode M0 | |||
|---|---|---|---|
| Quadrant | BADHDUFLAG | Total packets | Discarded packets |
| A | 0 | 40791 | 8682 |
| B | 0 | 45691 | 11330 |
| C | 0 | 37668 | 8028 |
| D | 0 | 38700 | 8426 |
| Quadrant | Total seconds | Saturated seconds | Saturation percentage |
|---|---|---|---|
| A | 14467 | 306 | 2.115159% |
| B | 14136 | 774 | 5.475382% |
| C | 14549 | 158 | 1.085985% |
| D | 14536 | 205 | 1.410292% |
Noise dominated data is calculated using 1-second bins in cleaned event files. If a bin has >2000 counts, and if more than 50% of those come from <1% of pixels, then it is considered to be noise-dominated and hence unusable.
| Quadrant | # 1 sec bins | Bins with >0 counts | Bins with >2000 counts | High rate bins dominated by noise | Noise dominated (total time) | Noise dominated (detector-on time) | Marked lightcurve |
|---|---|---|---|---|---|---|---|
| A | 20113 | 16447 | 56 | 56 | 0.28% | 0.34% | 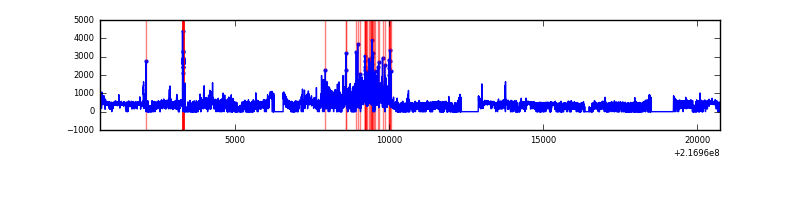 |
| B | 20112 | 16226 | 342 | 342 | 1.70% | 2.11% | 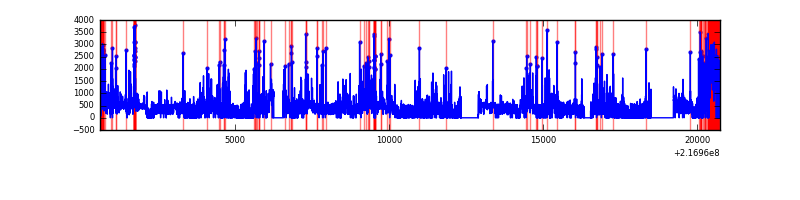 |
| C | 20112 | 16573 | 0 | 0 | 0.00% | 0.00% | 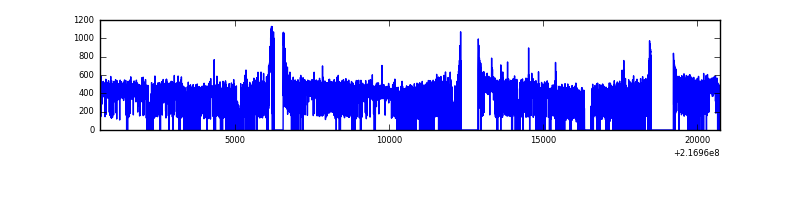 |
| D | 20113 | 16562 | 32 | 32 | 0.16% | 0.19% | 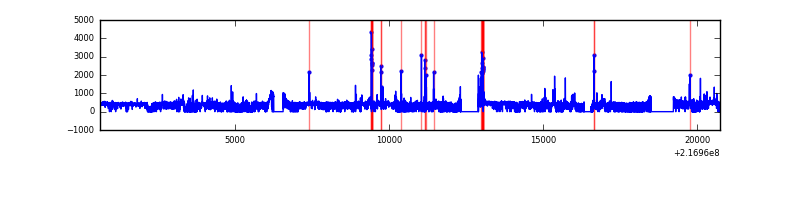 |
Top three noisy pixels from each quadrant. If the there are fewer than three noisy pixels in the level2.evt file, extra rows are filled as -1
| Pixel properties | Quadrant properties | ||||||
|---|---|---|---|---|---|---|---|
| Quadrant | DetID | PixID | Counts | Sigma | Mean | Median | Sigma |
| A | 8 | 15 | 909345 | 2629.6 | 1681 | 1641 | 345.2 |
| A | 0 | 50 | 69921 | 197.8 | 1681 | 1641 | 345.2 |
| A | 0 | 254 | 43276 | 120.61 | 1681 | 1641 | 345.2 |
| B | 3 | 64 | 1690234 | 5421.99 | 1623 | 1582 | 311.4 |
| B | 0 | 219 | 284228 | 907.53 | 1623 | 1582 | 311.4 |
| B | 0 | 214 | 70468 | 221.18 | 1623 | 1582 | 311.4 |
| C | 8 | 128 | 21495 | 51.32 | 1660 | 1671 | 386.3 |
| C | 9 | 16 | 16902 | 39.43 | 1660 | 1671 | 386.3 |
| C | 13 | 61 | 13158 | 29.73 | 1660 | 1671 | 386.3 |
| D | 13 | 169 | 180262 | 438.38 | 1656 | 1601 | 407.6 |
| D | 5 | 97 | 79715 | 191.67 | 1656 | 1601 | 407.6 |
| D | 8 | 195 | 67150 | 160.84 | 1656 | 1601 | 407.6 |
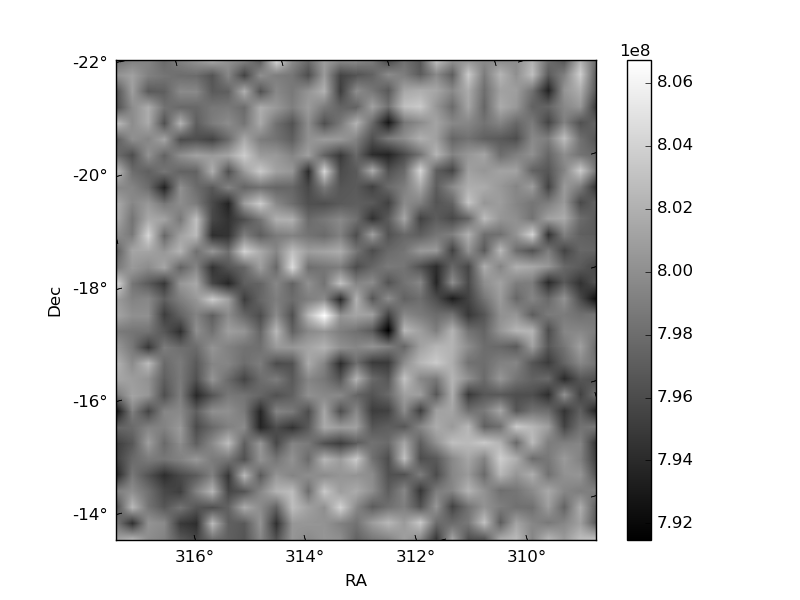
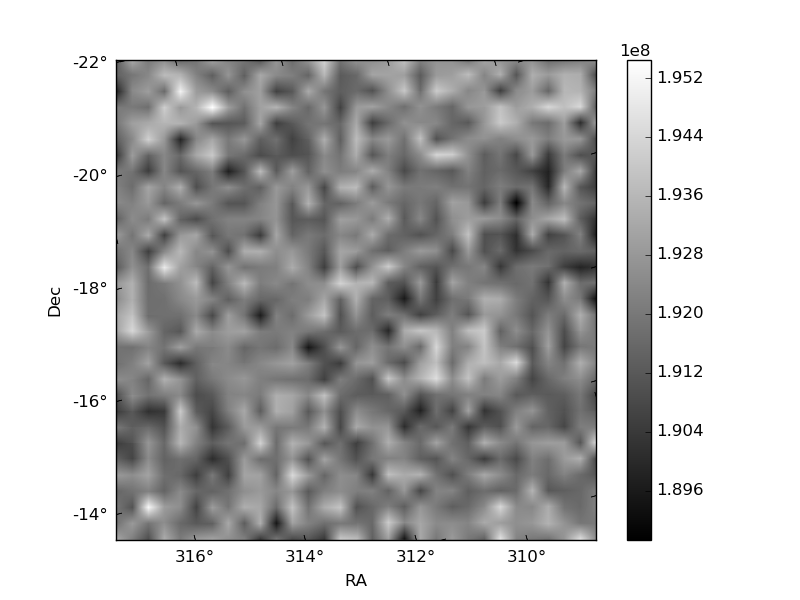
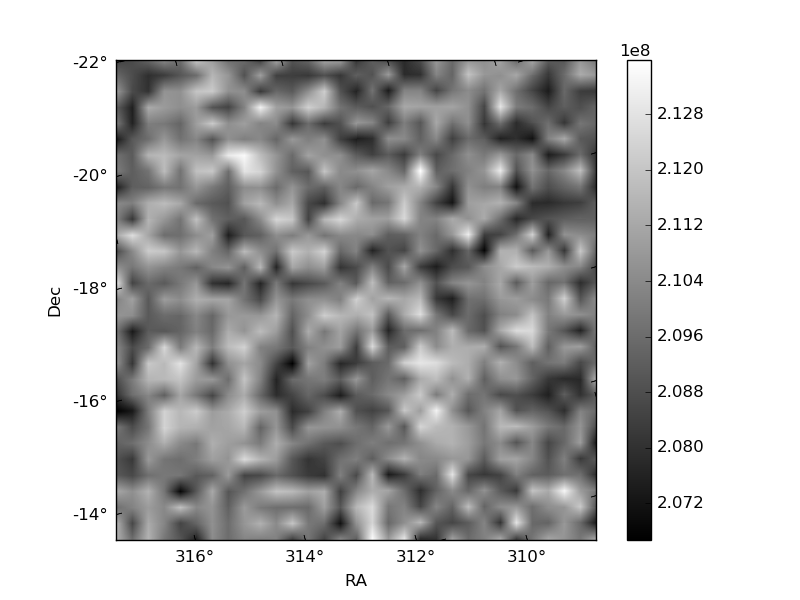
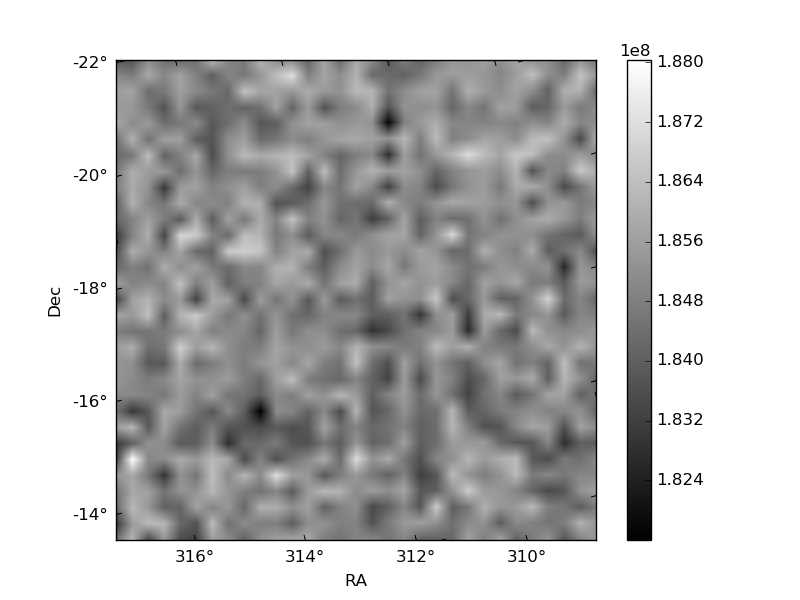
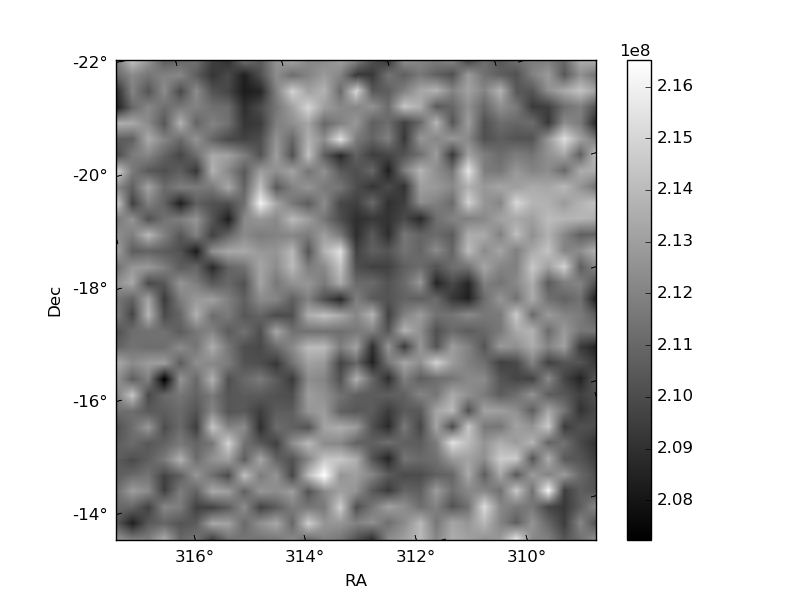
Histogram calculated using DETX and DETY for each event in the final _common_clean file
| Quadrant A | 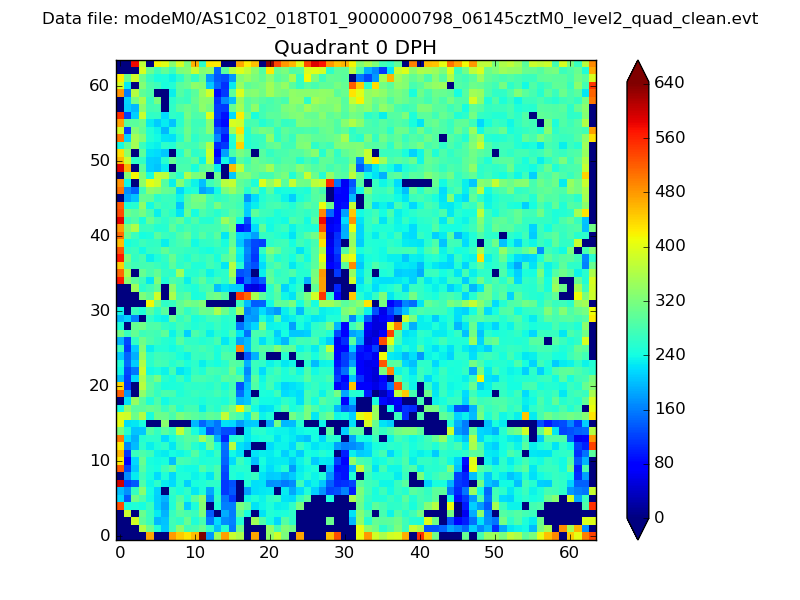 |
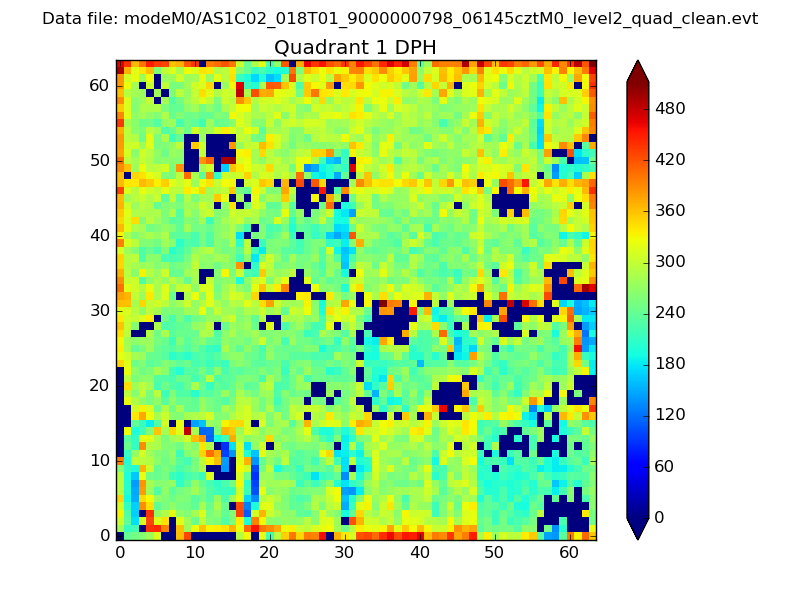 |
Quadrant B |
|---|---|---|---|
| Quadrant D |  |
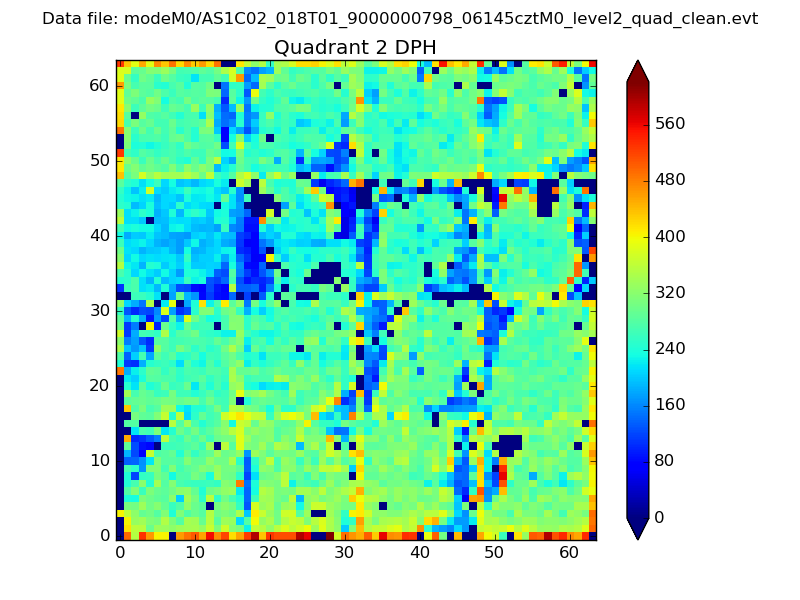 |
Quadrant C |
| Plot type | Count rate plots | Images |
|---|---|---|
| Comparison with Poisson distribution Blue bars denote a histogram of data divided into 1 sec bins. Red curve is a Poisson curve with rate = median count rate of data. |
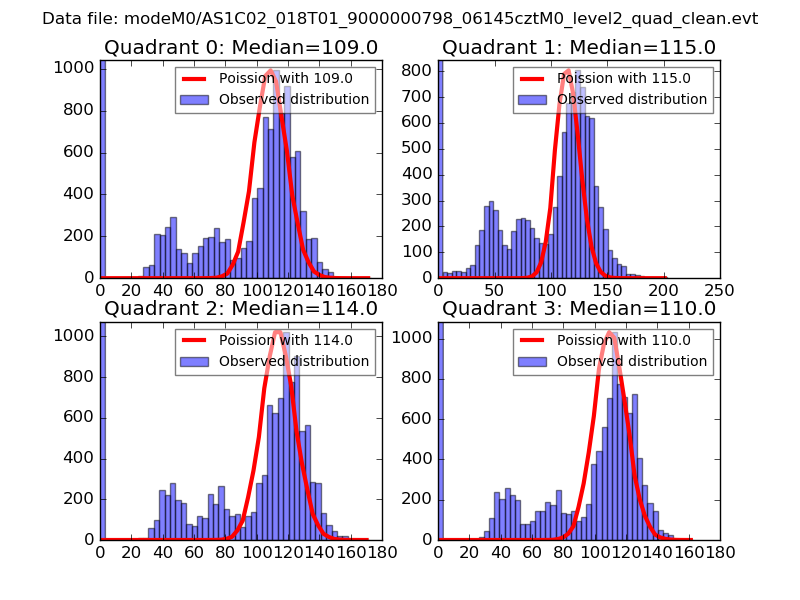 |
 |
| Quadrant-wise count rates Data is divided into 100 sec bins |
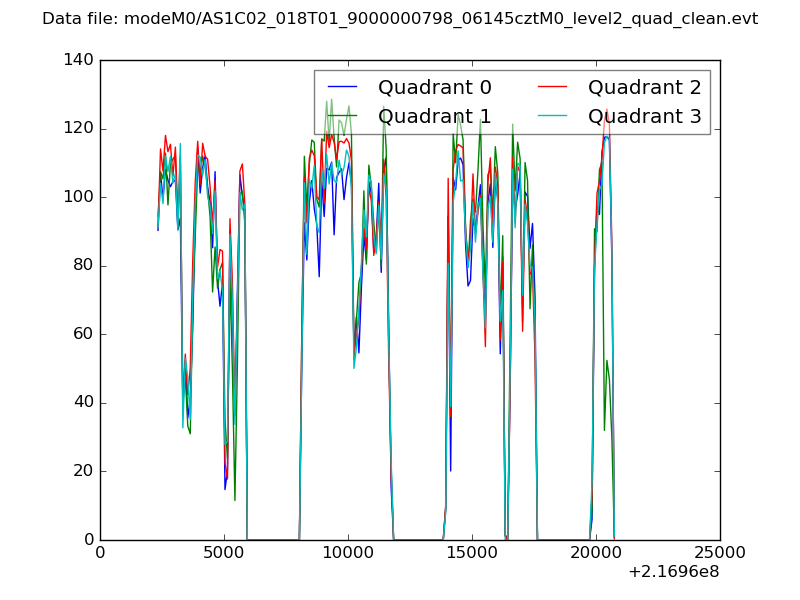 |
|
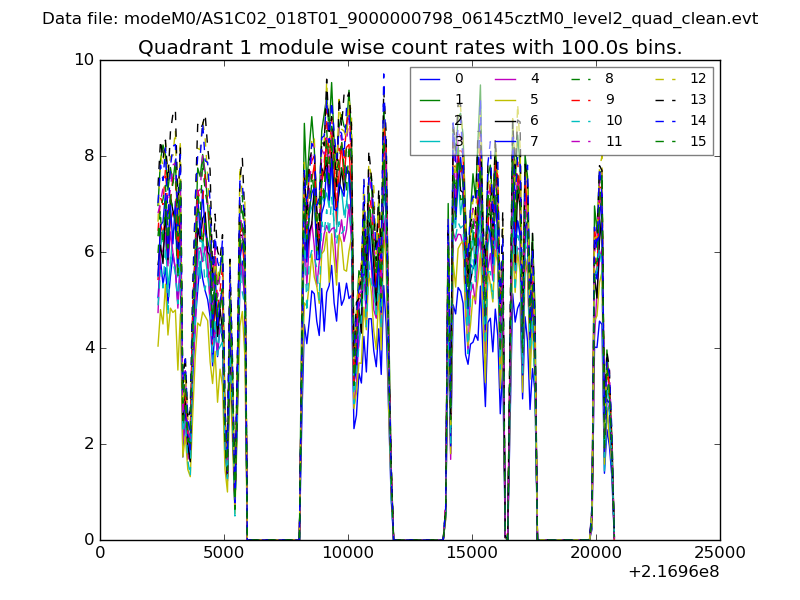
| Module-wise count rates for Quadrant A Data is divided into 100 sec bins |
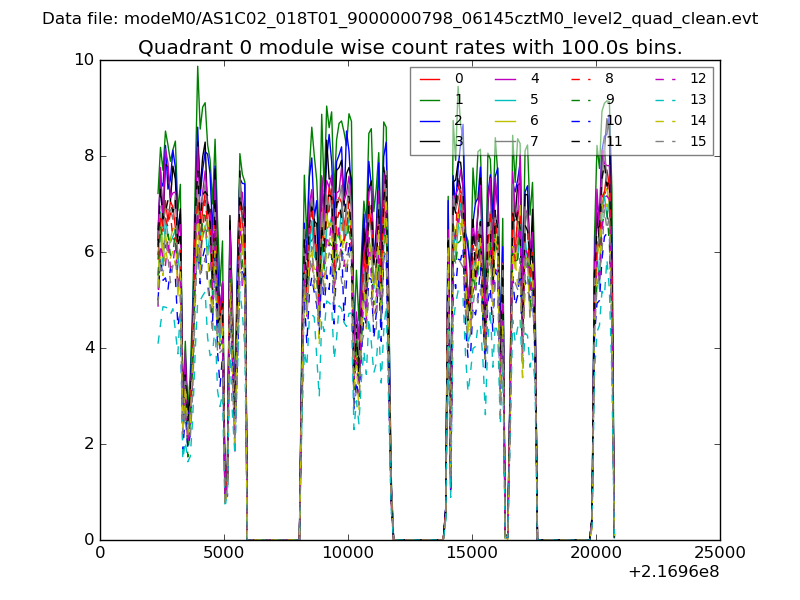 |
 |
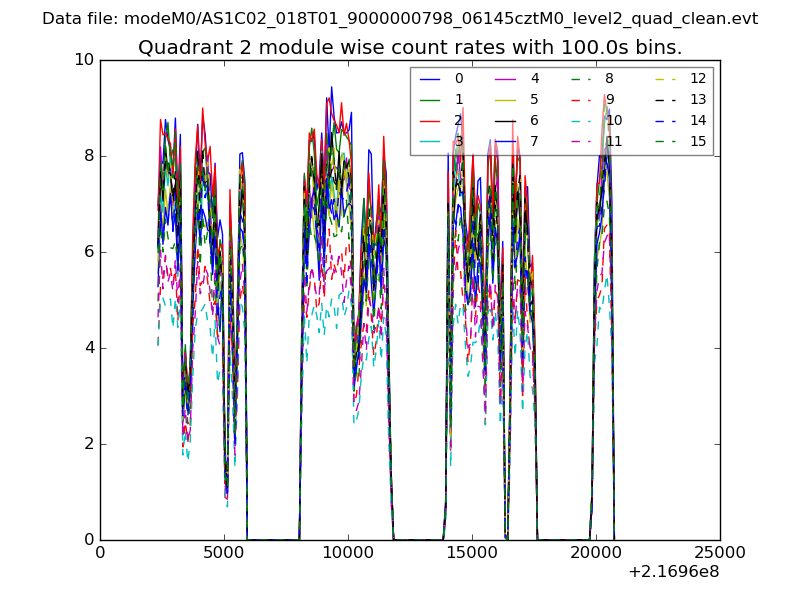
| Module-wise count rates for Quadrant B Data is divided into 100 sec bins |
 |
 |
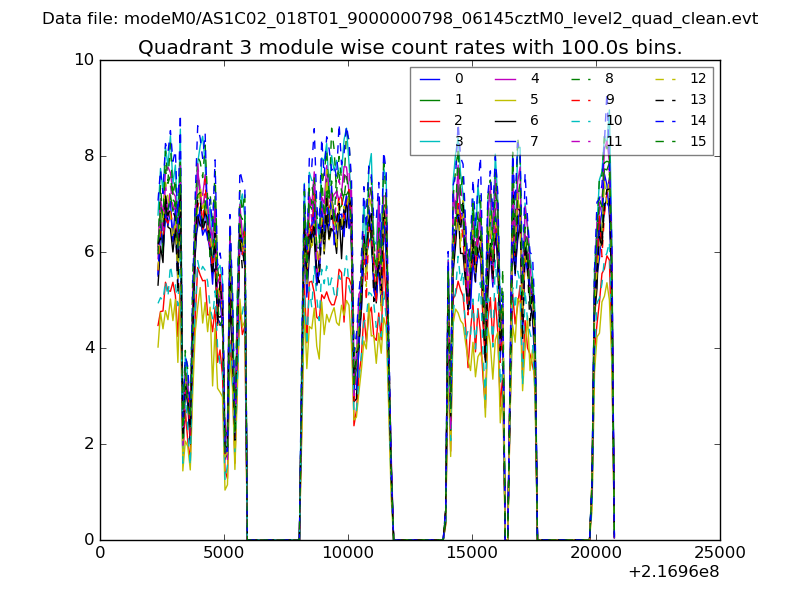
| Module-wise count rates for Quadrant C Data is divided into 100 sec bins |
 |
 |
| Module-wise count rates for Quadrant D Data is divided into 100 sec bins |
 |
 |
| Parameter | Plot |
|---|---|
| CZT HV Monitor | 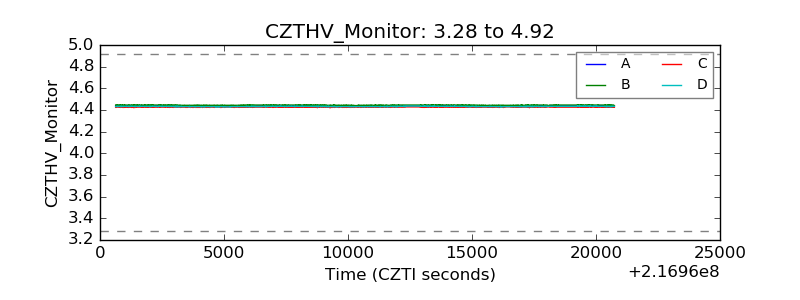 |
| D_VDD | 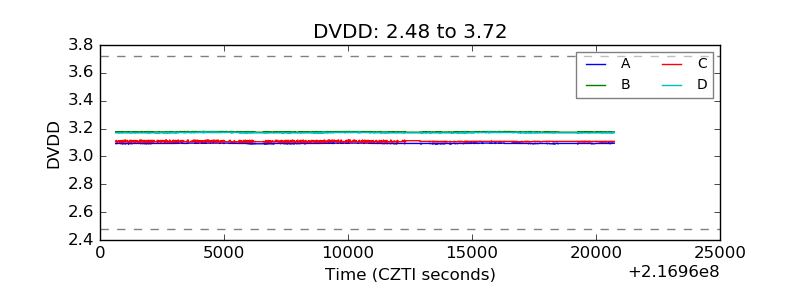 |
| Temperature 1 | 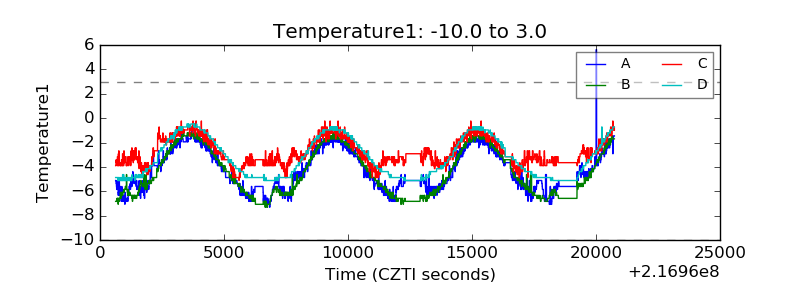 |
| Veto HV Monitor | 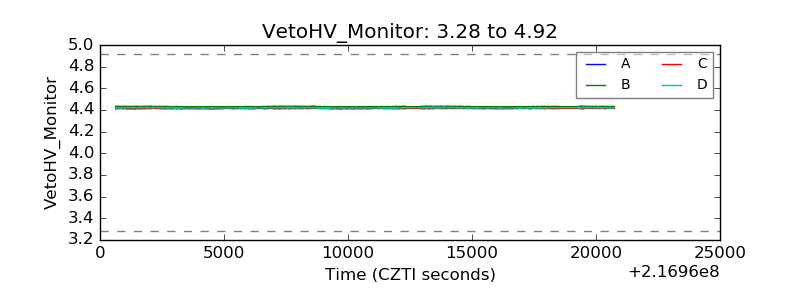 |
| Veto LLD |  |
| Alpha Counter | 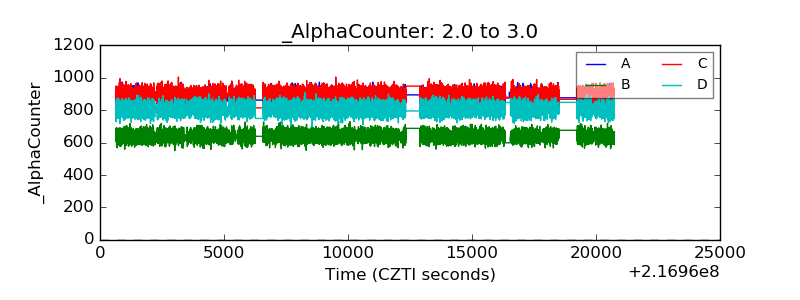 |
| _CPM_Rate | 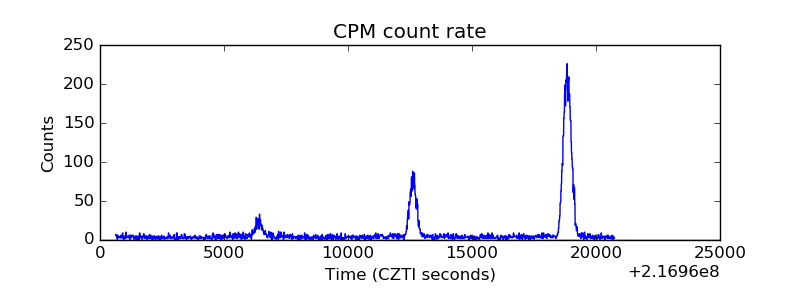 |
| CZT Counter | 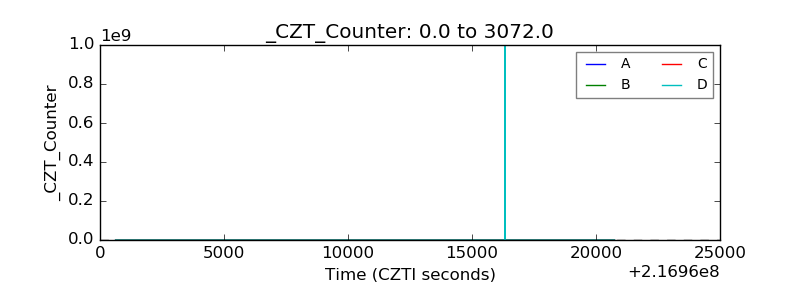 |
| +2.5 Volts monitor |  |
| +5 Volts monitor |  |
| _ROLL_ROT | 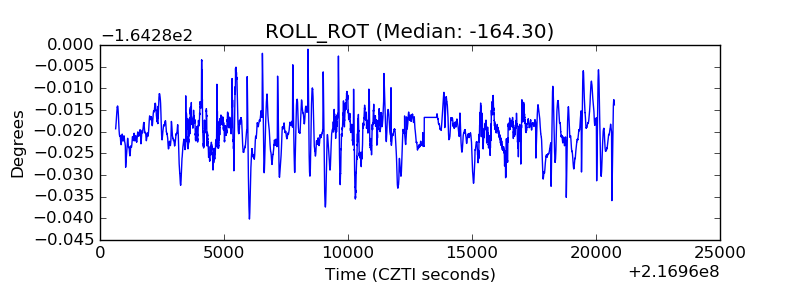 |
| _Roll_DEC | 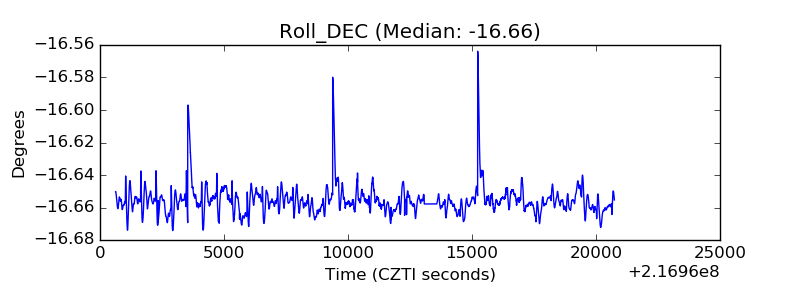 |
| _Roll_RA | 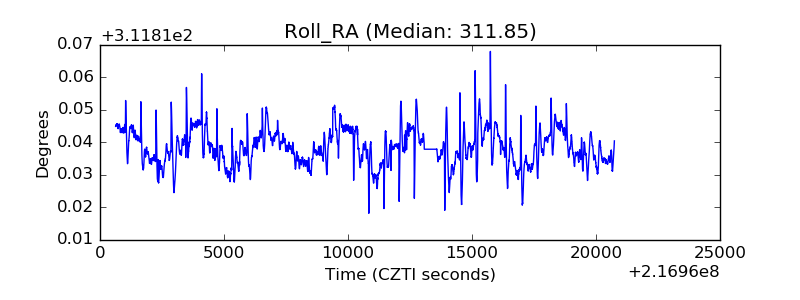 |
| Veto Counter | 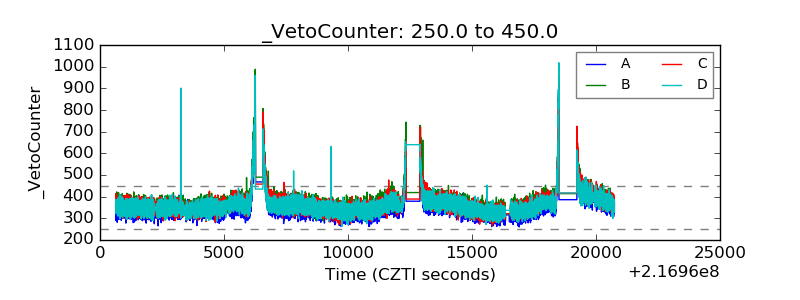 |