| Param | Original file | Final file |
|---|---|---|
| Filename | modeM0/AS1C02_018T01_9000000798_06146cztM0_level2.evt | modeM0/AS1C02_018T01_9000000798_06146cztM0_level2_quad_clean.evt |
| Size (bytes) | 2,038,374,720 | 361,166,400 |
| Size | 1.9 GB | 344.4 MB |
| Events in quadrant A | 14,891,078 | 2,213,607 |
| Events in quadrant B | 18,110,071 | 2,187,654 |
| Events in quadrant C | 13,185,298 | 2,316,898 |
| Events in quadrant D | 13,578,522 | 2,219,632 |
| Mode M9 | |||
|---|---|---|---|
| Quadrant | BADHDUFLAG | Total packets | Discarded packets |
| A | 0 | 25 | 0 |
| B | 0 | 25 | 2 |
| C | 0 | 25 | 0 |
| D | 0 | 25 | 1 |
| Mode SS | |||
|---|---|---|---|
| Quadrant | BADHDUFLAG | Total packets | Discarded packets |
| A | 0 | 596 | 2 |
| B | 0 | 596 | 6 |
| C | 0 | 596 | 4 |
| D | 0 | 596 | 0 |
| Mode M0 | |||
|---|---|---|---|
| Quadrant | BADHDUFLAG | Total packets | Discarded packets |
| A | 0 | 64375 | 572 |
| B | 0 | 73488 | 713 |
| C | 0 | 60219 | 428 |
| D | 0 | 61888 | 445 |
| Quadrant | Total seconds | Saturated seconds | Saturation percentage |
|---|---|---|---|
| A | 29080 | 711 | 2.444979% |
| B | 29068 | 1713 | 5.893078% |
| C | 29116 | 454 | 1.559280% |
| D | 29128 | 565 | 1.939714% |
Noise dominated data is calculated using 1-second bins in cleaned event files. If a bin has >2000 counts, and if more than 50% of those come from <1% of pixels, then it is considered to be noise-dominated and hence unusable.
| Quadrant | # 1 sec bins | Bins with >0 counts | Bins with >2000 counts | High rate bins dominated by noise | Noise dominated (total time) | Noise dominated (detector-on time) | Marked lightcurve |
|---|---|---|---|---|---|---|---|
| A | 31863 | 29308 | 83 | 83 | 0.26% | 0.28% | 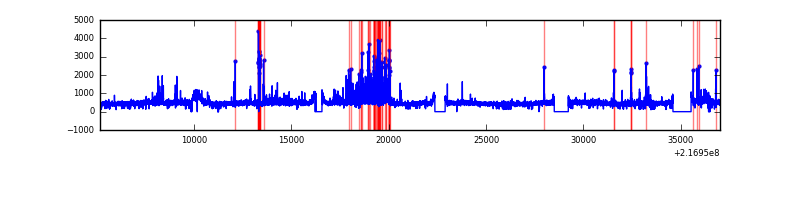 |
| B | 31863 | 29296 | 742 | 742 | 2.33% | 2.53% | 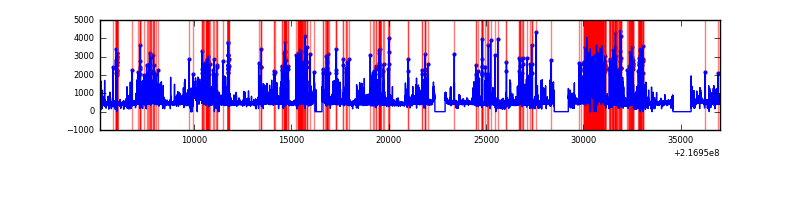 |
| C | 31863 | 29310 | 0 | 0 | 0.00% | 0.00% | 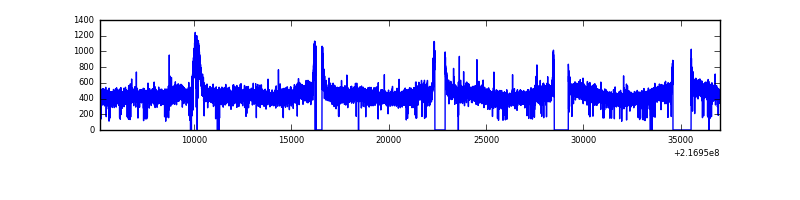 |
| D | 31863 | 29309 | 60 | 60 | 0.19% | 0.20% | 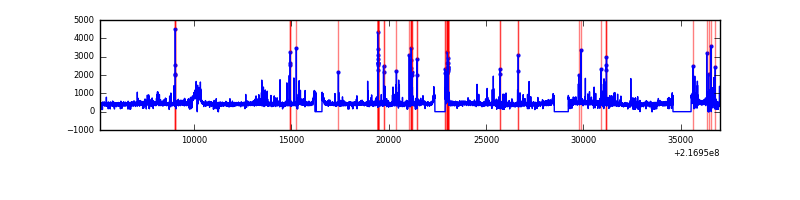 |
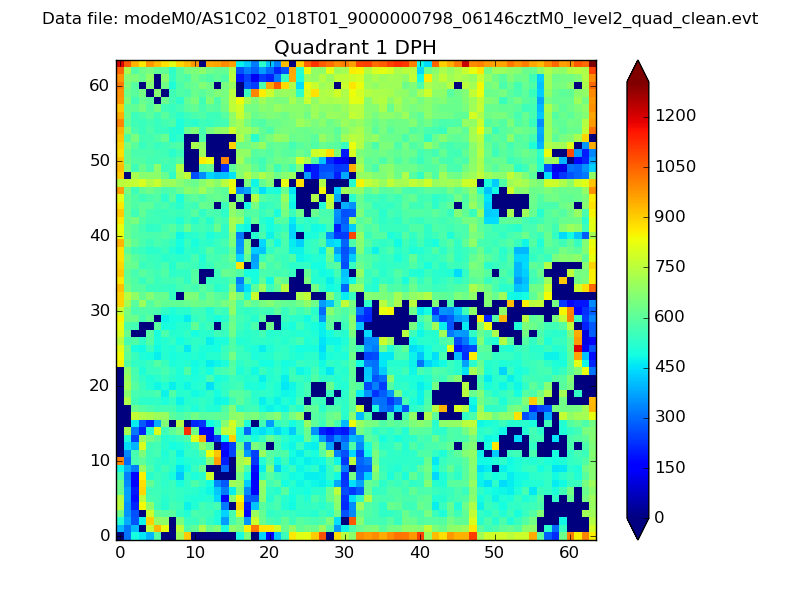
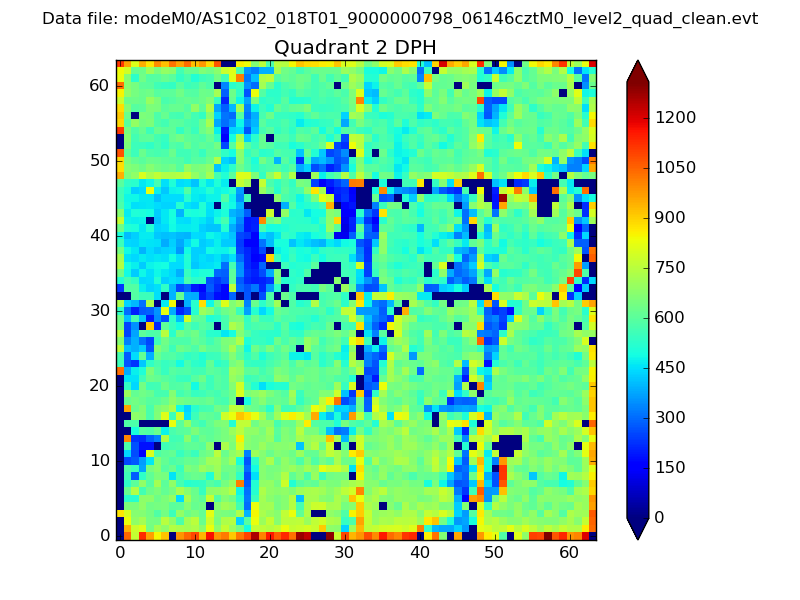
Top three noisy pixels from each quadrant. If the there are fewer than three noisy pixels in the level2.evt file, extra rows are filled as -1
| Pixel properties | Quadrant properties | ||||||
|---|---|---|---|---|---|---|---|
| Quadrant | DetID | PixID | Counts | Sigma | Mean | Median | Sigma |
| A | 8 | 15 | 1505692 | 2152.04 | 3417 | 3341 | 698.1 |
| A | 4 | 2 | 84864 | 116.78 | 3417 | 3341 | 698.1 |
| A | 0 | 50 | 81952 | 112.61 | 3417 | 3341 | 698.1 |
| B | 3 | 64 | 3515061 | 5398.18 | 3387 | 3305 | 650.5 |
| B | 0 | 219 | 909867 | 1393.54 | 3387 | 3305 | 650.5 |
| B | 0 | 214 | 222394 | 336.78 | 3387 | 3305 | 650.5 |
| C | 9 | 16 | 32741 | 37.7 | 3354 | 3374 | 778.9 |
| C | 8 | 128 | 28889 | 32.76 | 3354 | 3374 | 778.9 |
| C | 13 | 61 | 26729 | 29.99 | 3354 | 3374 | 778.9 |
| D | 13 | 169 | 414847 | 502.24 | 3352 | 3246 | 819.5 |
| D | 5 | 97 | 190067 | 227.96 | 3352 | 3246 | 819.5 |
| D | 8 | 195 | 124399 | 147.83 | 3352 | 3246 | 819.5 |
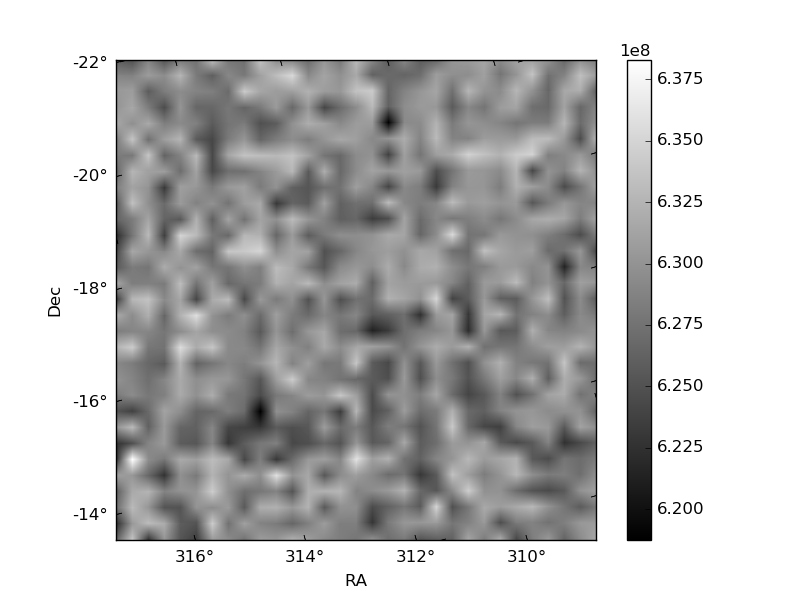
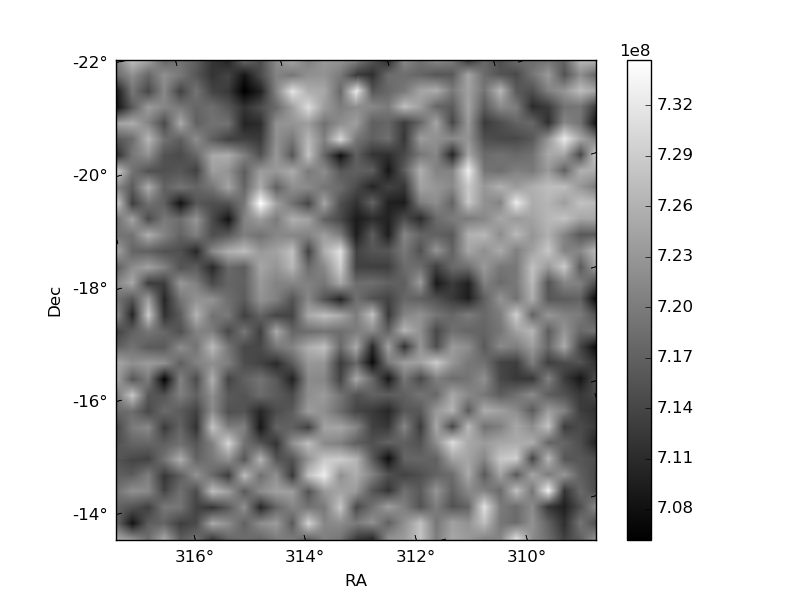
Histogram calculated using DETX and DETY for each event in the final _common_clean file
| Quadrant A | 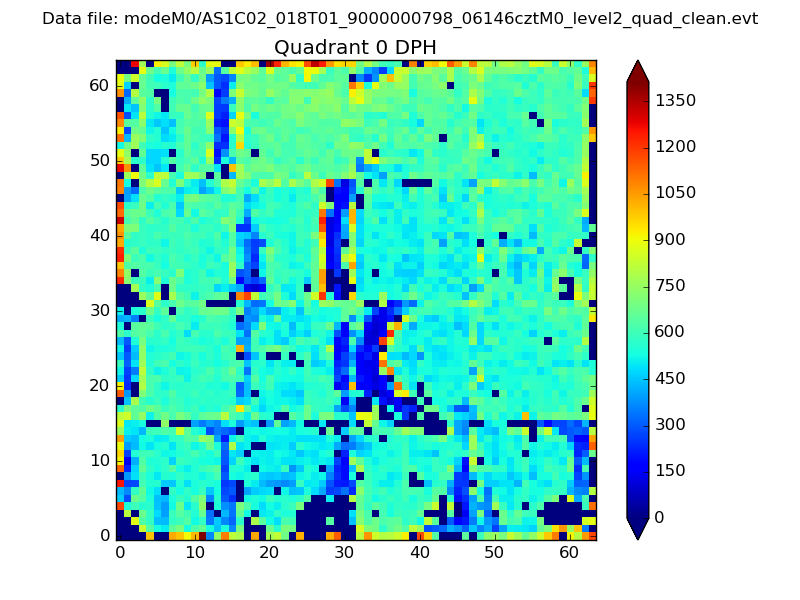 |
 |
Quadrant B |
|---|---|---|---|
| Quadrant D | 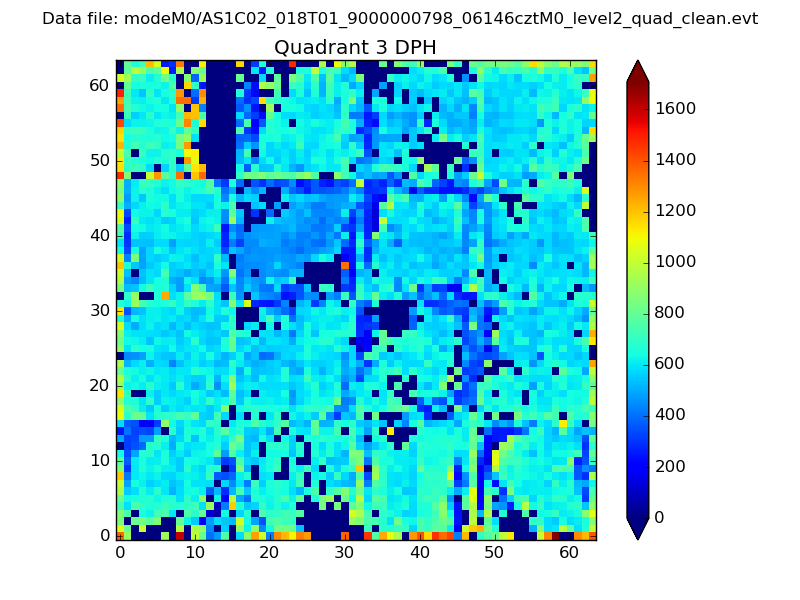 |
 |
Quadrant C |
| Plot type | Count rate plots | Images |
|---|---|---|
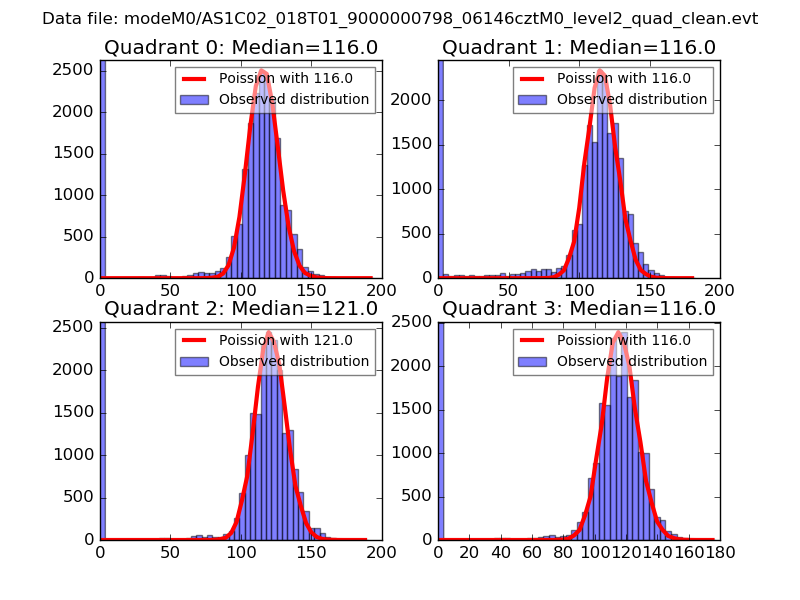
| Comparison with Poisson distribution Blue bars denote a histogram of data divided into 1 sec bins. Red curve is a Poisson curve with rate = median count rate of data. |
 |
 |
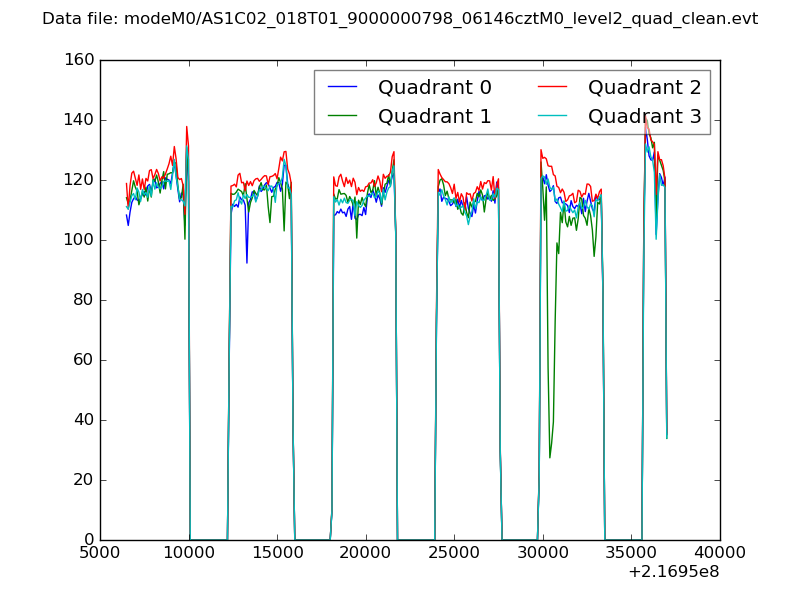
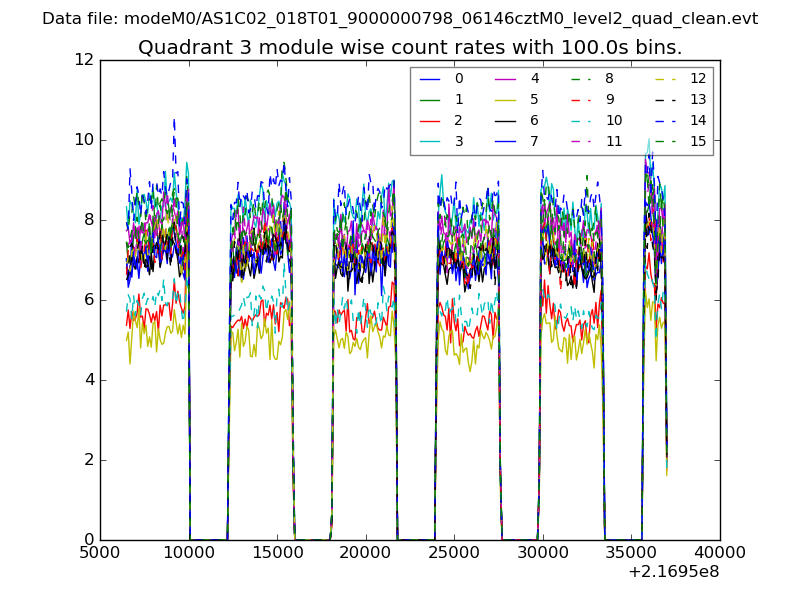
| Quadrant-wise count rates Data is divided into 100 sec bins |
 |
|
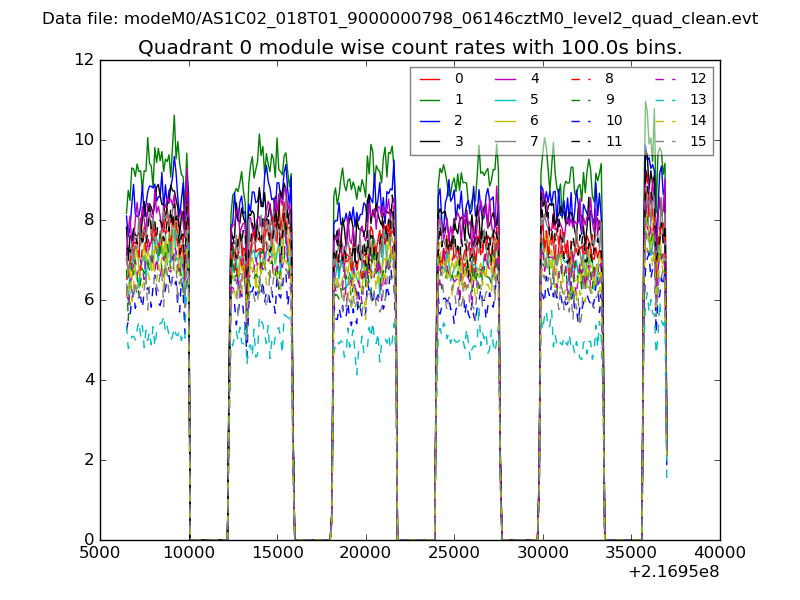
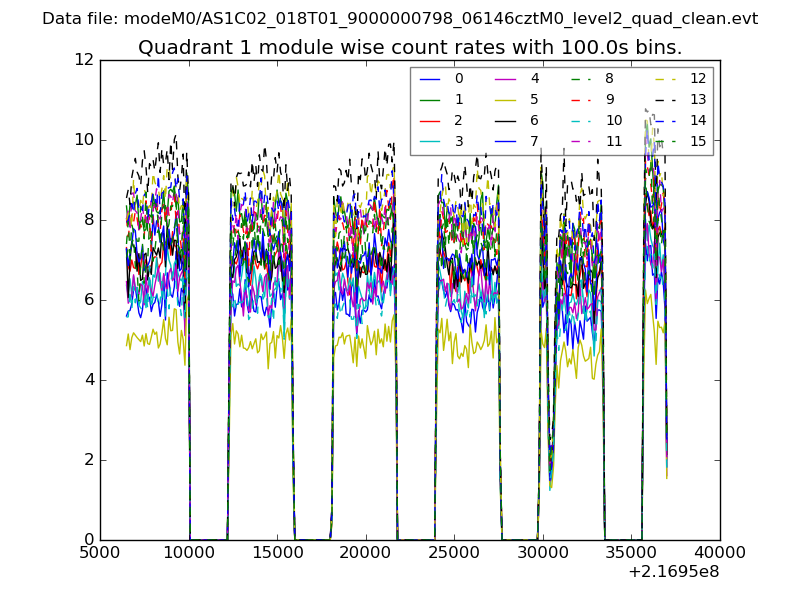
| Module-wise count rates for Quadrant A Data is divided into 100 sec bins |
 |
 |
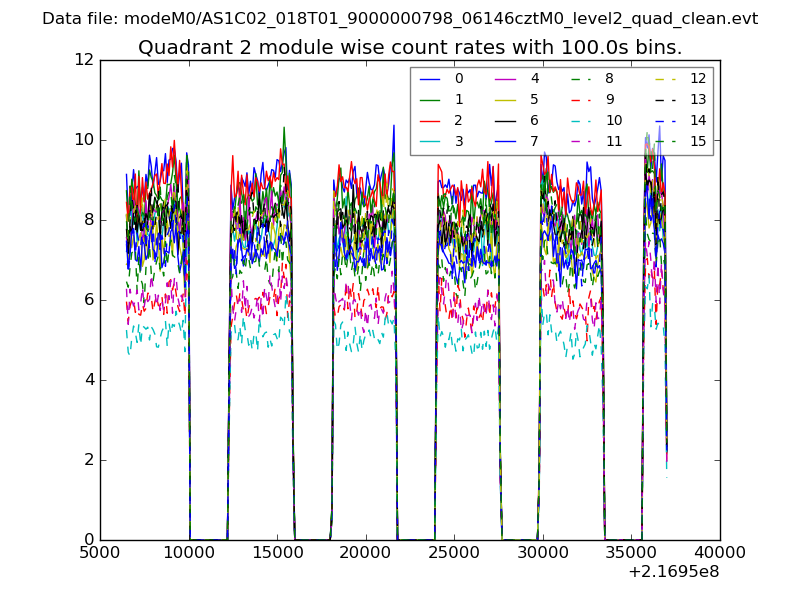
| Module-wise count rates for Quadrant B Data is divided into 100 sec bins |
 |
 |
| Module-wise count rates for Quadrant C Data is divided into 100 sec bins |
 |
 |
| Module-wise count rates for Quadrant D Data is divided into 100 sec bins |
 |
 |
| Parameter | Plot |
|---|---|
| CZT HV Monitor | 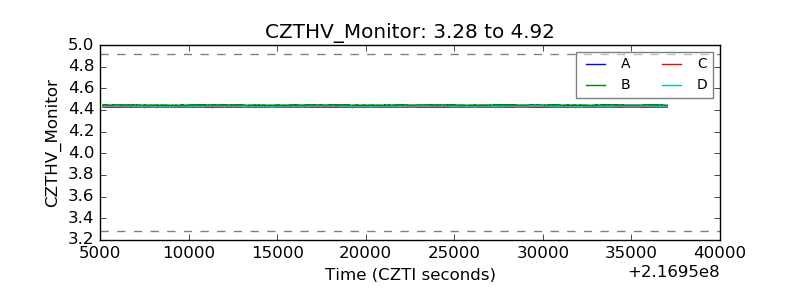 |
| D_VDD | 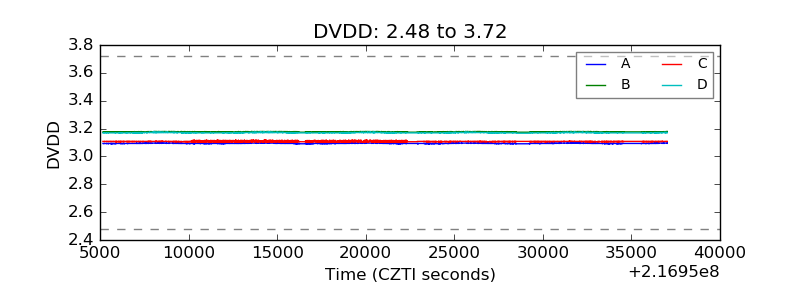 |
| Temperature 1 | 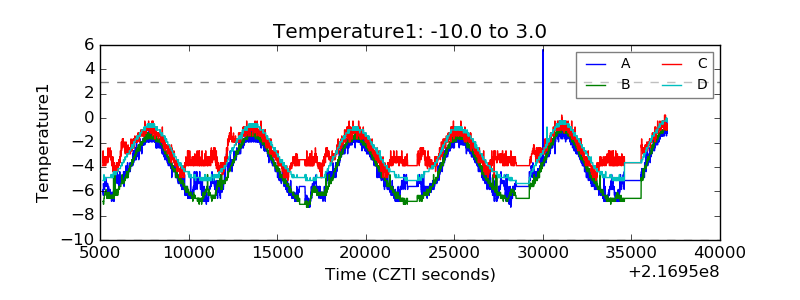 |
| Veto HV Monitor | 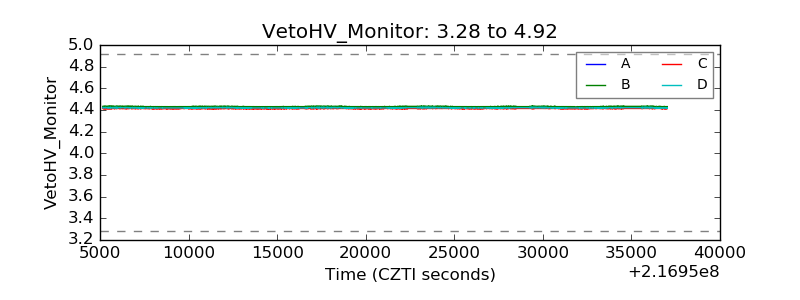 |
| Veto LLD | 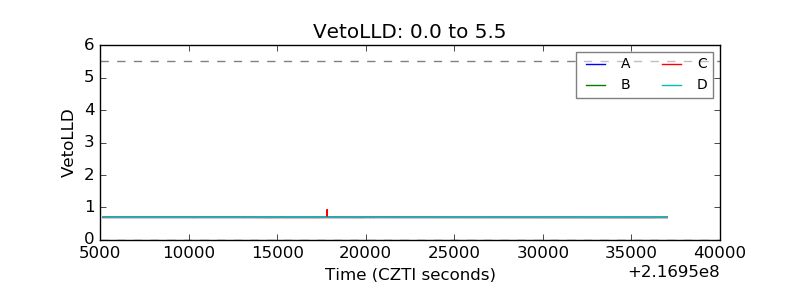 |
| Alpha Counter | 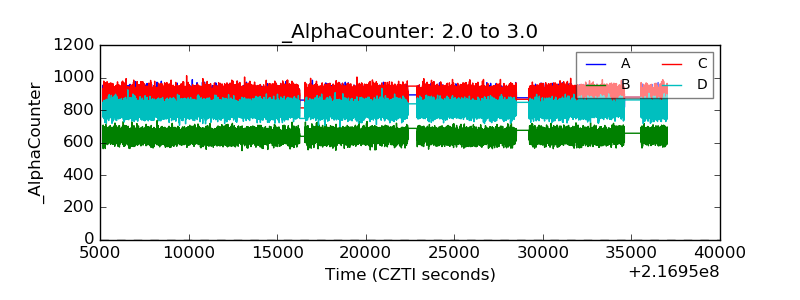 |
| _CPM_Rate | 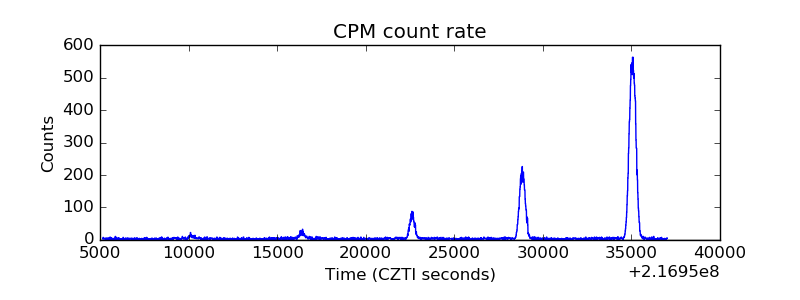 |
| CZT Counter | 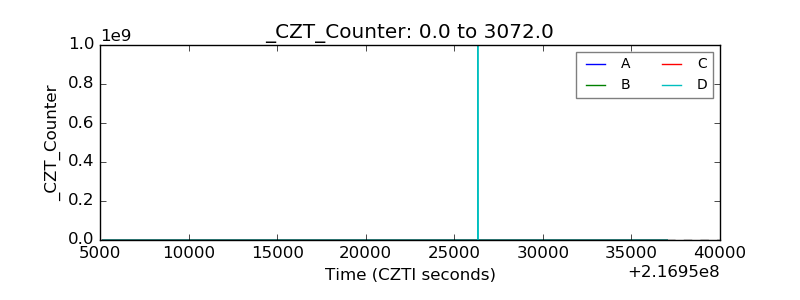 |
| +2.5 Volts monitor |  |
| +5 Volts monitor | 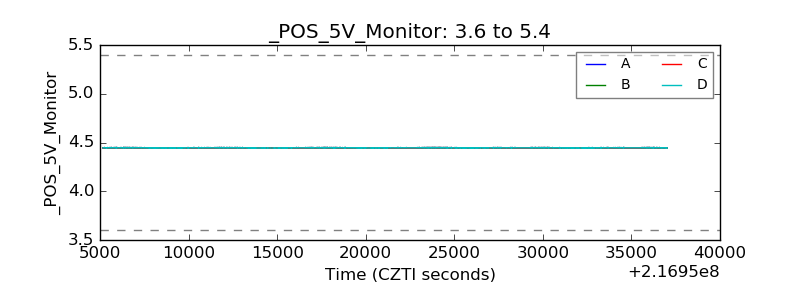 |
| _ROLL_ROT | 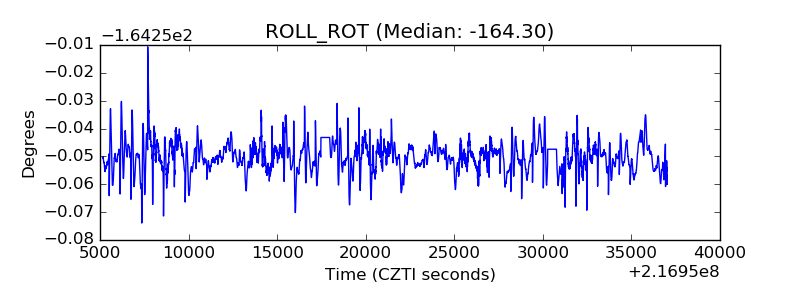 |
| _Roll_DEC | 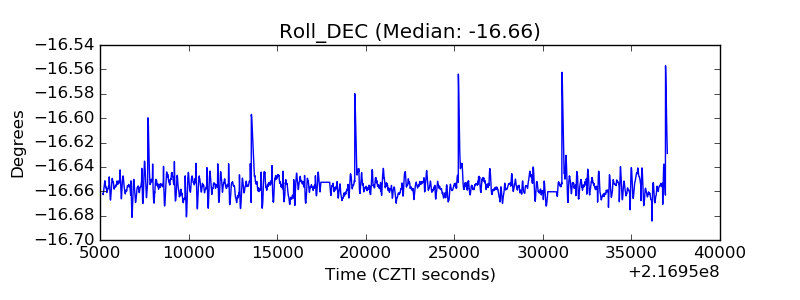 |
| _Roll_RA | 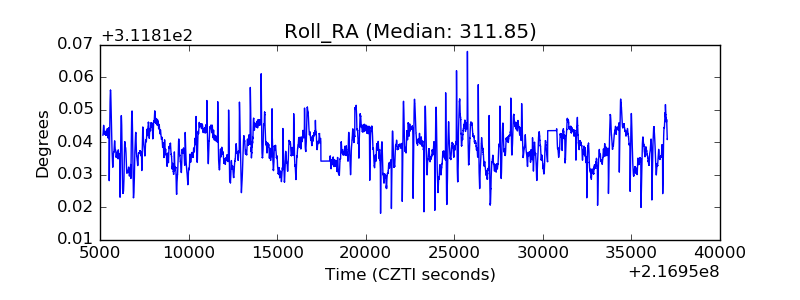 |
| Veto Counter | 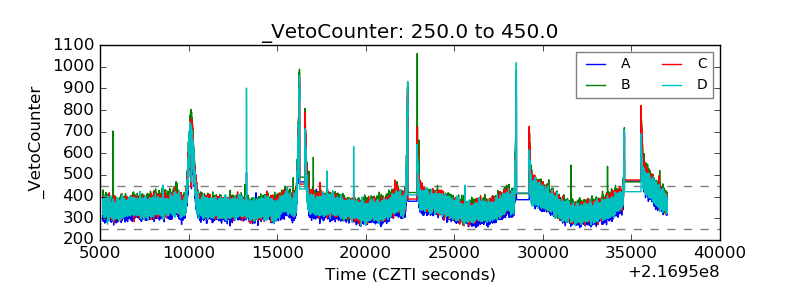 |