| Param | Original file | Final file |
|---|---|---|
| Filename | modeM0/AS1C02_018T01_9000000798_06148cztM0_level2.evt | modeM0/AS1C02_018T01_9000000798_06148cztM0_level2_quad_clean.evt |
| Size (bytes) | 55,008,000 | 13,812,480 |
| Size | 52.5 MB | 13.2 MB |
| Events in quadrant A | 425,155 | 85,793 |
| Events in quadrant B | 416,795 | 84,329 |
| Events in quadrant C | 389,303 | 97,177 |
| Events in quadrant D | 378,559 | 88,688 |
| Mode M9 | |||
|---|---|---|---|
| Quadrant | BADHDUFLAG | Total packets | Discarded packets |
| A | 0 | 6 | 3 |
| B | 0 | 6 | 3 |
| C | 0 | 6 | 1 |
| D | 0 | 7 | 5 |
| Mode SS | |||
|---|---|---|---|
| Quadrant | BADHDUFLAG | Total packets | Discarded packets |
| A | 0 | 33 | 16 |
| B | 0 | 33 | 19 |
| C | 0 | 33 | 19 |
| D | 0 | 34 | 10 |
| Mode M0 | |||
|---|---|---|---|
| Quadrant | BADHDUFLAG | Total packets | Discarded packets |
| A | 0 | 4157 | 2435 |
| B | 0 | 4216 | 2574 |
| C | 0 | 3600 | 1945 |
| D | 0 | 3871 | 2254 |
| Quadrant | Total seconds | Saturated seconds | Saturation percentage |
|---|---|---|---|
| A | 755 | 7 | 0.927152% |
| B | 719 | 4 | 0.556328% |
| C | 814 | 2 | 0.245700% |
| D | 776 | 3 | 0.386598% |
Noise dominated data is calculated using 1-second bins in cleaned event files. If a bin has >2000 counts, and if more than 50% of those come from <1% of pixels, then it is considered to be noise-dominated and hence unusable.
| Quadrant | # 1 sec bins | Bins with >0 counts | Bins with >2000 counts | High rate bins dominated by noise | Noise dominated (total time) | Noise dominated (detector-on time) | Marked lightcurve |
|---|---|---|---|---|---|---|---|
| A | 1736 | 1118 | 0 | 0 | 0.00% | 0.00% | 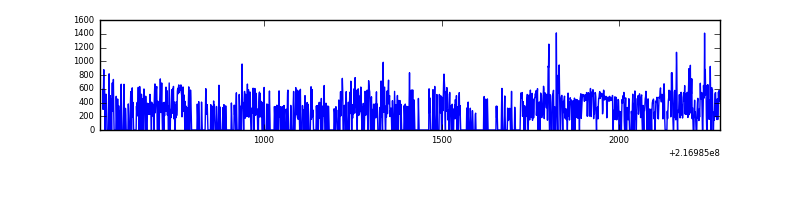 |
| B | 1743 | 1068 | 2 | 2 | 0.11% | 0.19% | 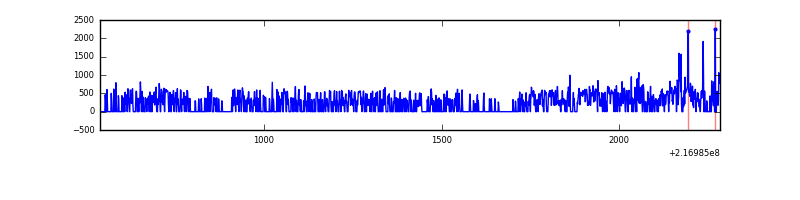 |
| C | 1744 | 1169 | 0 | 0 | 0.00% | 0.00% |  |
| D | 1744 | 1118 | 1 | 1 | 0.06% | 0.09% | 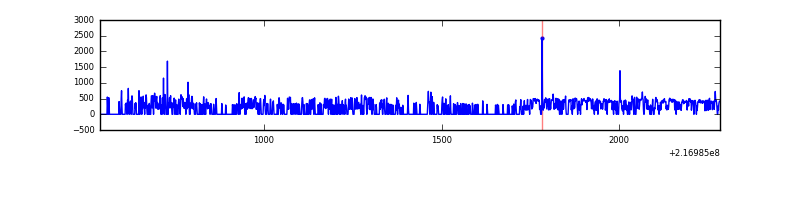 |
Top three noisy pixels from each quadrant. If the there are fewer than three noisy pixels in the level2.evt file, extra rows are filled as -1
| Pixel properties | Quadrant properties | ||||||
|---|---|---|---|---|---|---|---|
| Quadrant | DetID | PixID | Counts | Sigma | Mean | Median | Sigma |
| A | 8 | 15 | 54800 | 2512.9 | 96 | 94 | 21.8 |
| A | 0 | 226 | 1002 | 41.71 | 96 | 94 | 21.8 |
| A | 12 | 194 | 958 | 39.69 | 96 | 94 | 21.8 |
| B | 3 | 64 | 24073 | 1205.32 | 90 | 88 | 19.9 |
| B | 0 | 219 | 17637 | 881.89 | 90 | 88 | 19.9 |
| B | 0 | 214 | 16549 | 827.22 | 90 | 88 | 19.9 |
| C | 9 | 16 | 1775 | 67.85 | 99 | 99 | 24.7 |
| C | 13 | 61 | 817 | 29.07 | 99 | 99 | 24.7 |
| C | 8 | 222 | 349 | 10.12 | 99 | 99 | 24.7 |
| D | 13 | 169 | 11263 | 441.95 | 94 | 91 | 25.3 |
| D | 5 | 97 | 4162 | 161.04 | 94 | 91 | 25.3 |
| D | 8 | 195 | 2687 | 102.69 | 94 | 91 | 25.3 |
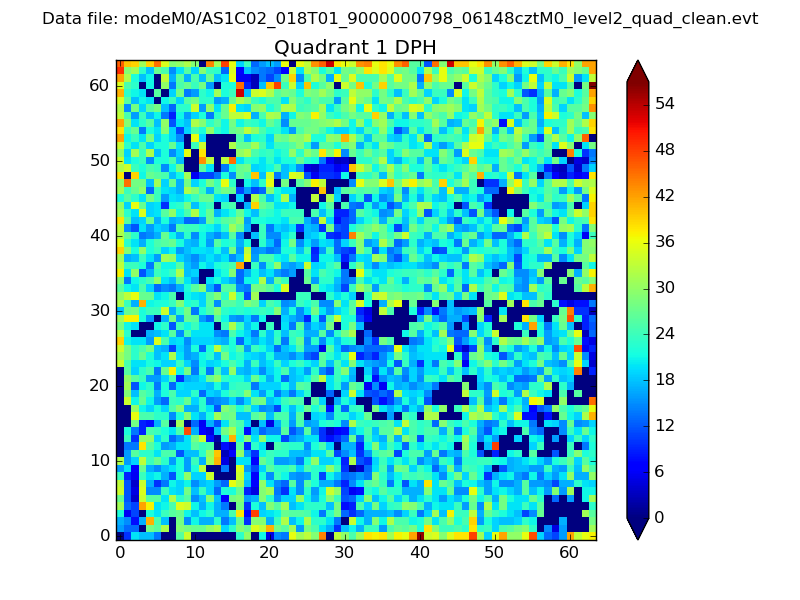
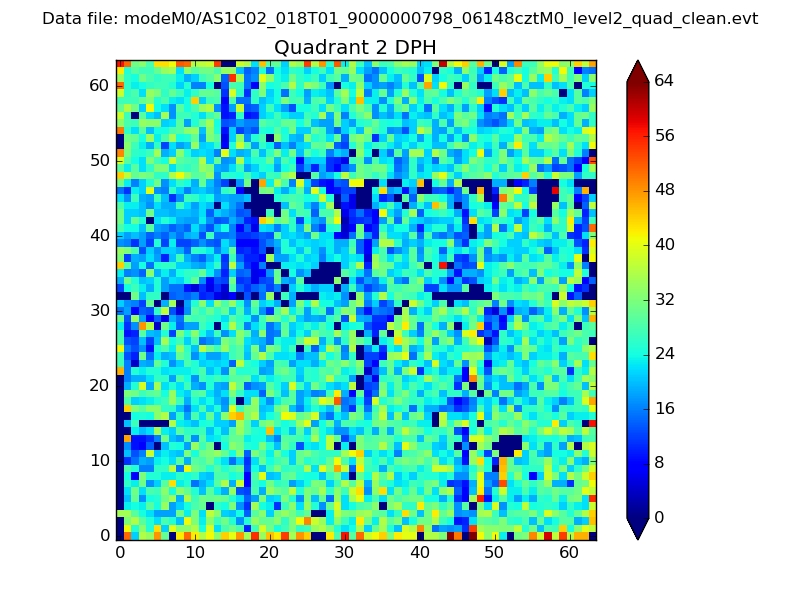
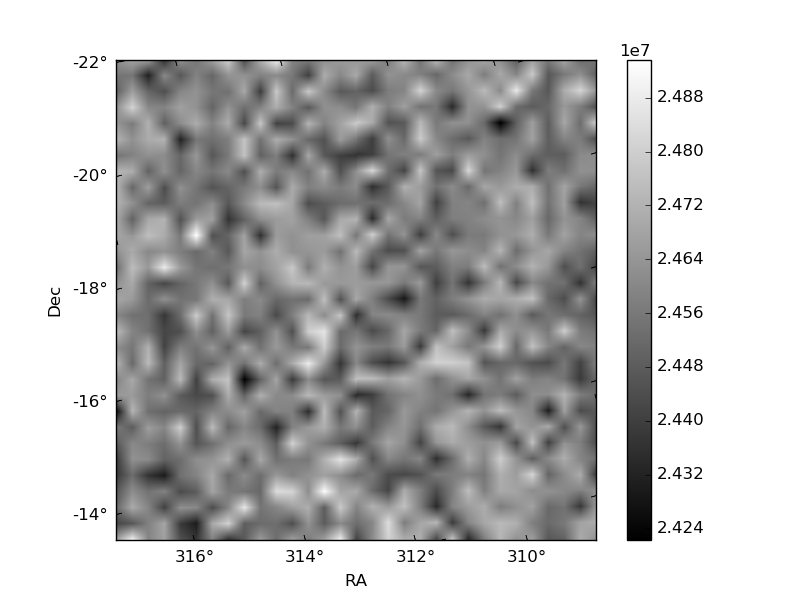
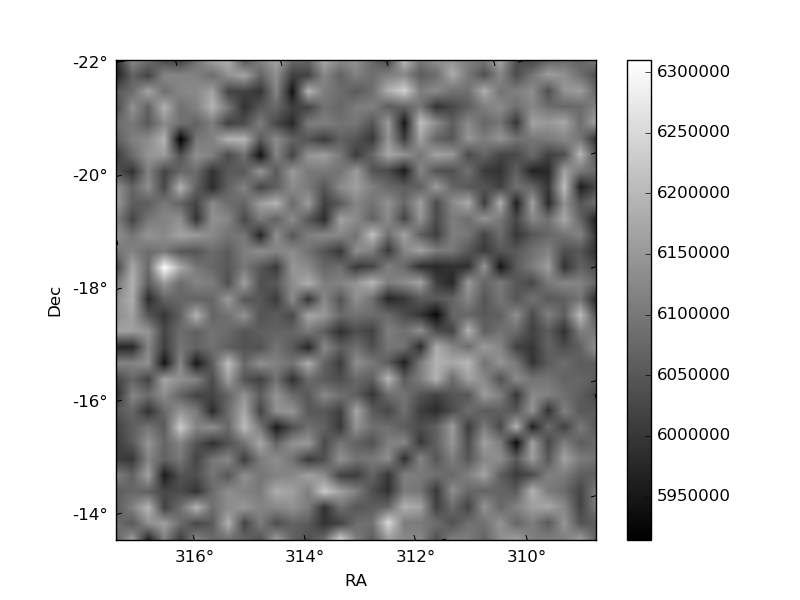
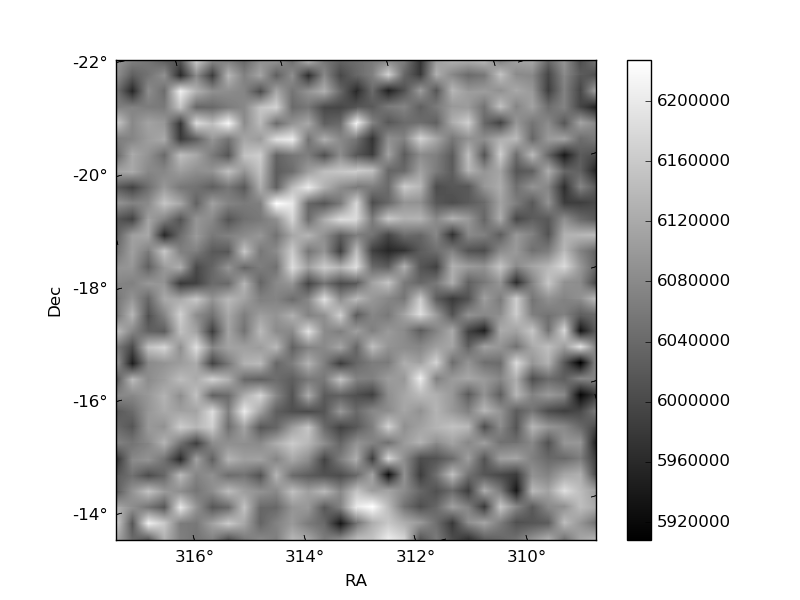
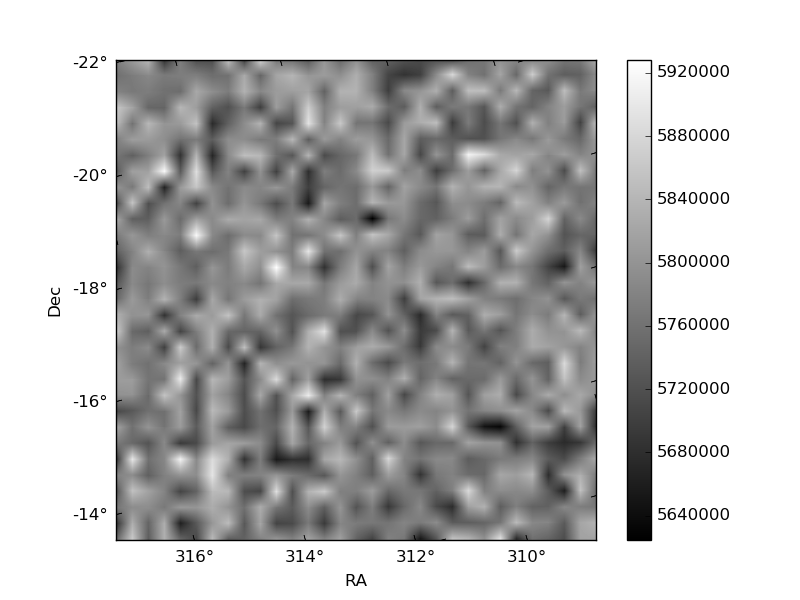
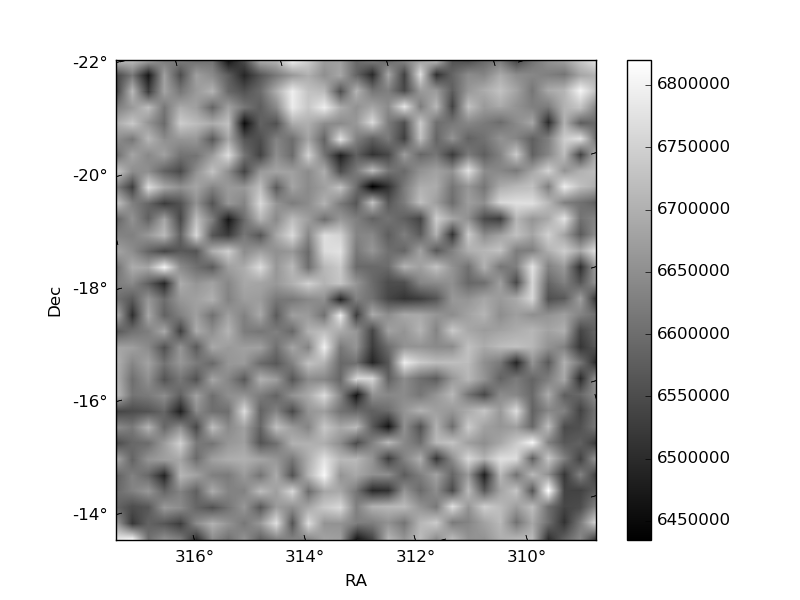
Histogram calculated using DETX and DETY for each event in the final _common_clean file
| Quadrant A | 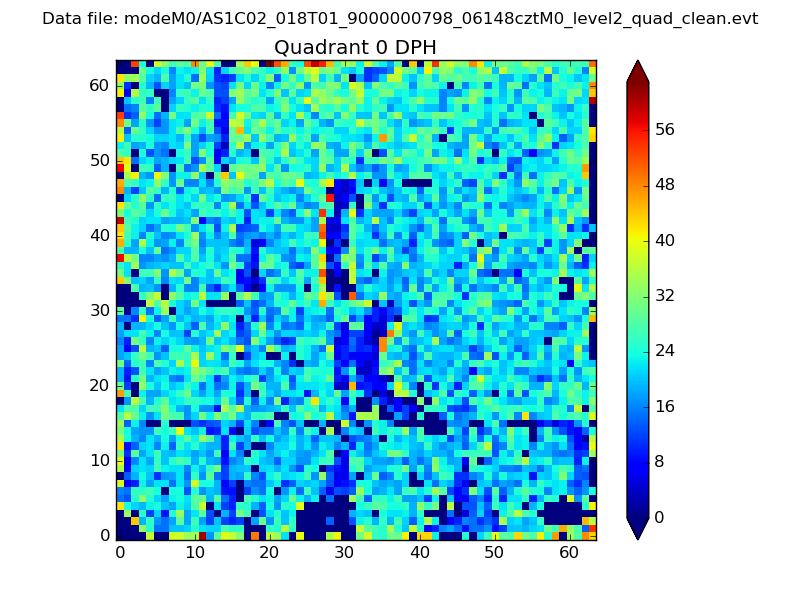 |
 |
Quadrant B |
|---|---|---|---|
| Quadrant D | 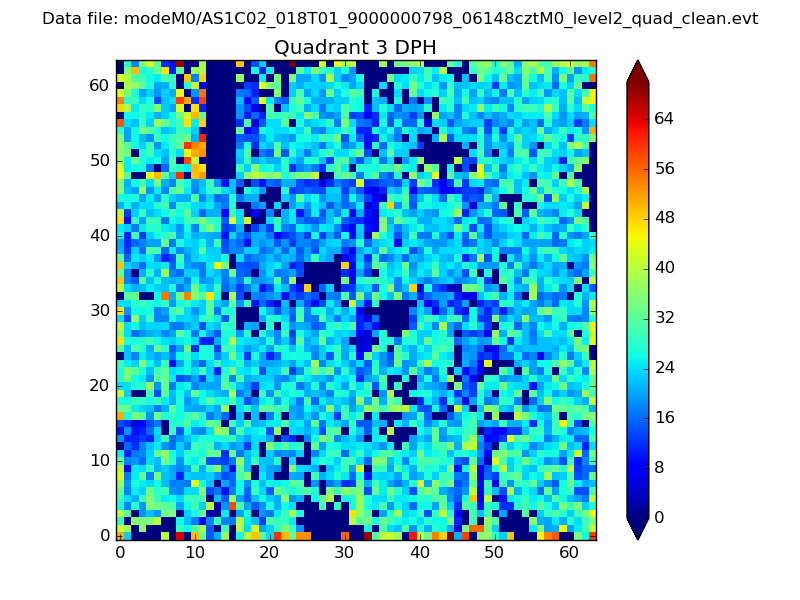 |
 |
Quadrant C |
| Plot type | Count rate plots | Images |
|---|---|---|
| Comparison with Poisson distribution Blue bars denote a histogram of data divided into 1 sec bins. Red curve is a Poisson curve with rate = median count rate of data. |
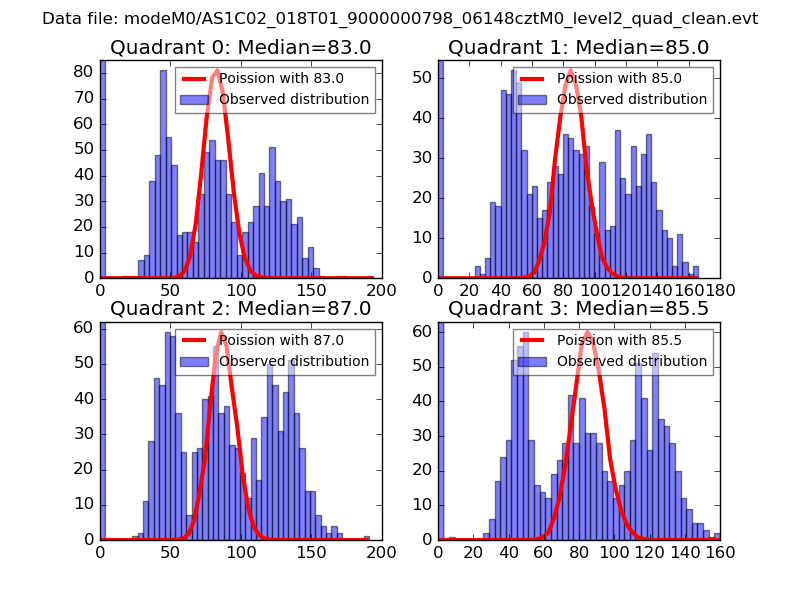 |
 |
| Quadrant-wise count rates Data is divided into 100 sec bins |
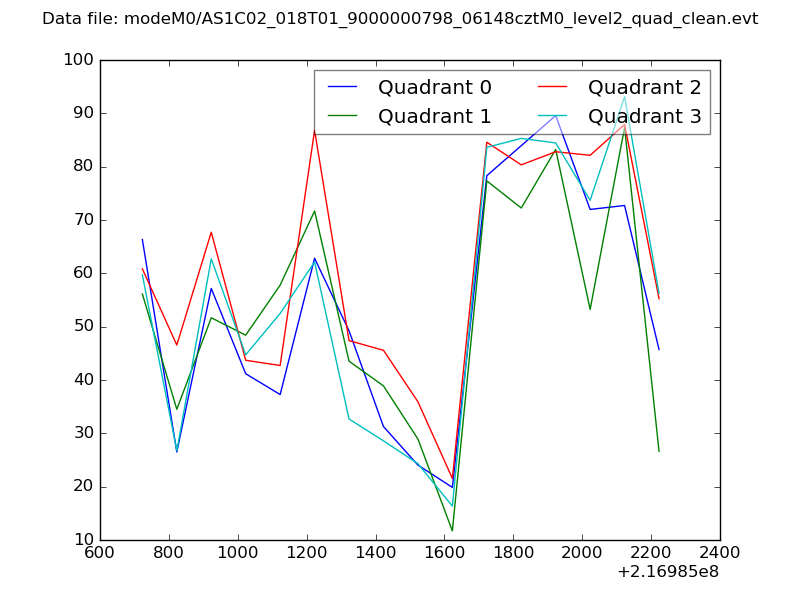 |
|
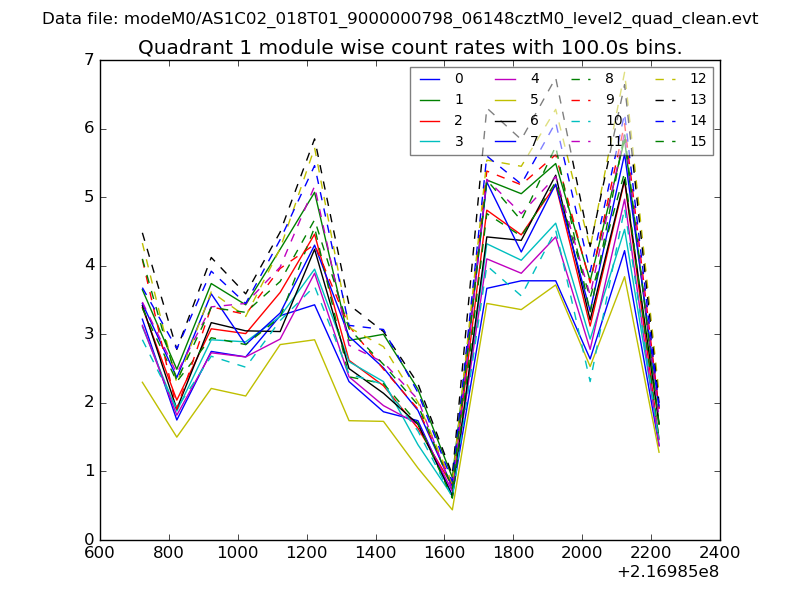
| Module-wise count rates for Quadrant A Data is divided into 100 sec bins |
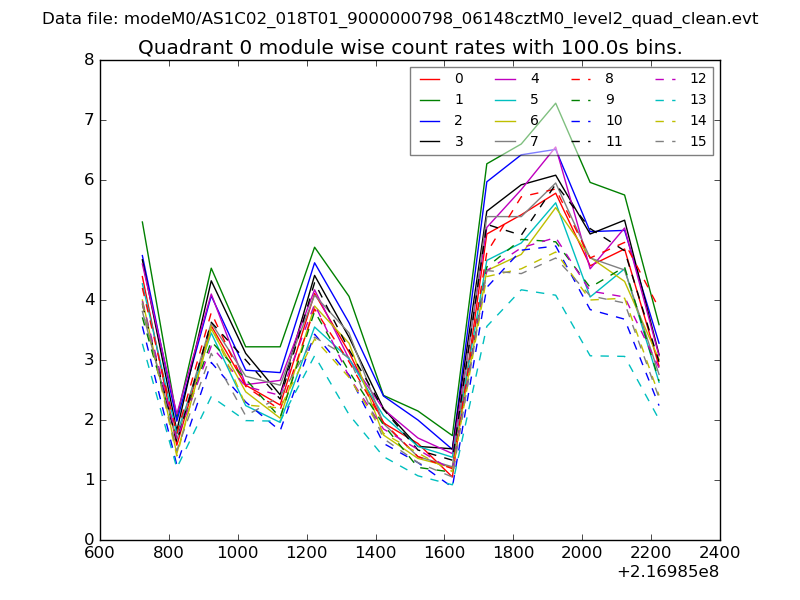 |
 |
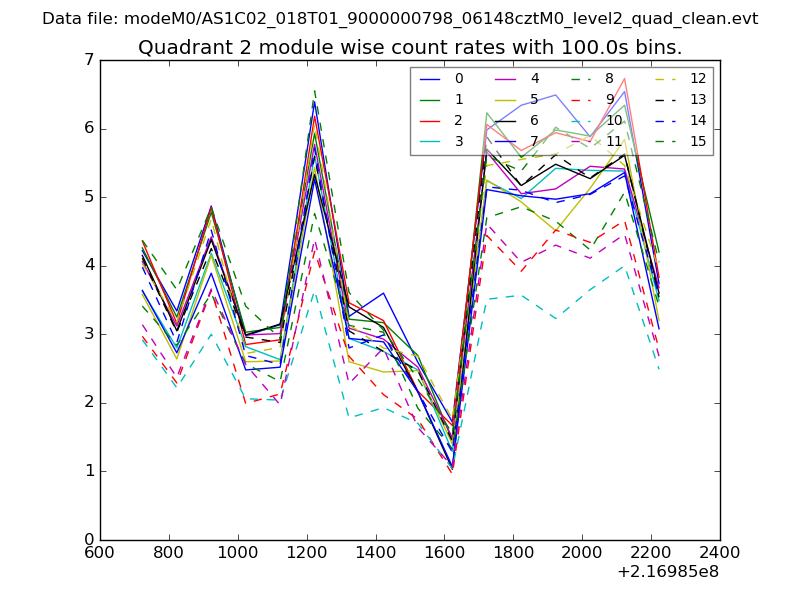
| Module-wise count rates for Quadrant B Data is divided into 100 sec bins |
 |
 |
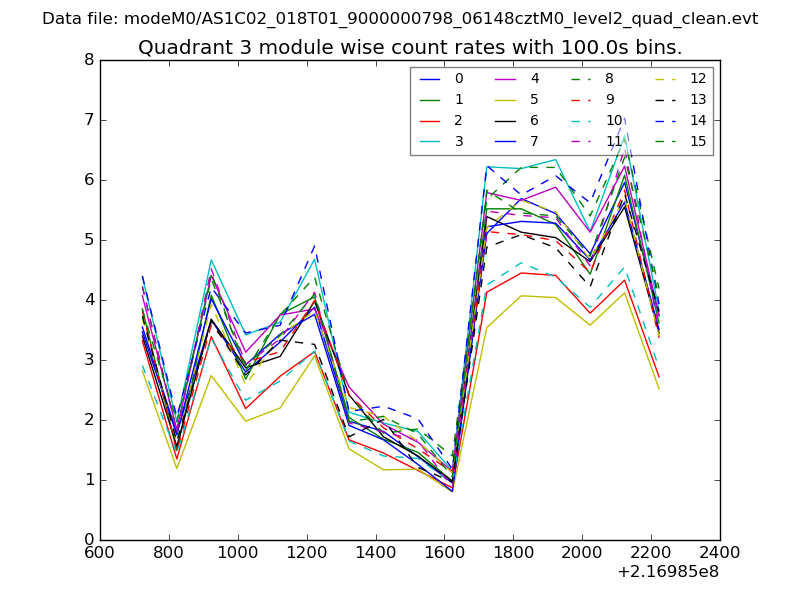
| Module-wise count rates for Quadrant C Data is divided into 100 sec bins |
 |
 |
| Module-wise count rates for Quadrant D Data is divided into 100 sec bins |
 |
 |
| Parameter | Plot |
|---|---|
| CZT HV Monitor | 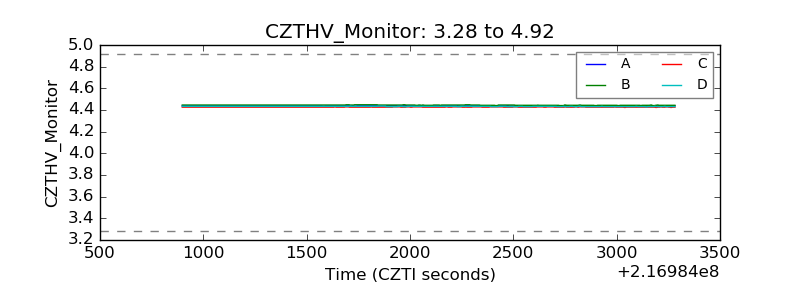 |
| D_VDD | 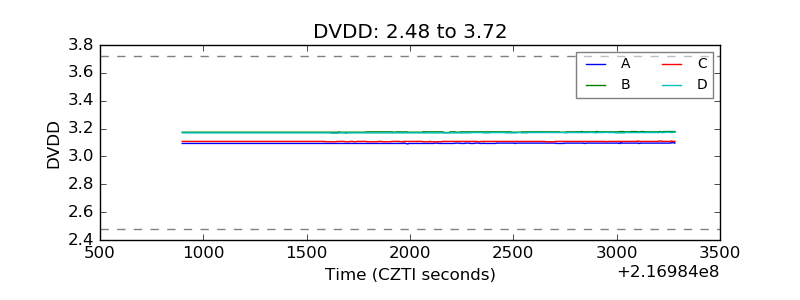 |
| Temperature 1 | 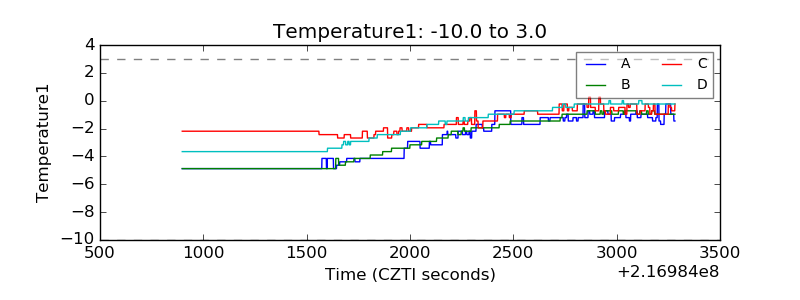 |
| Veto HV Monitor | 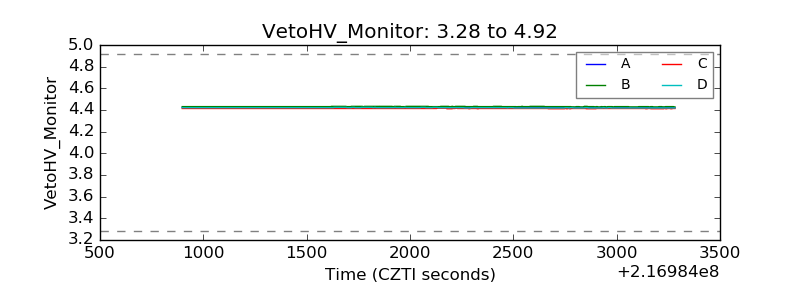 |
| Veto LLD |  |
| Alpha Counter | 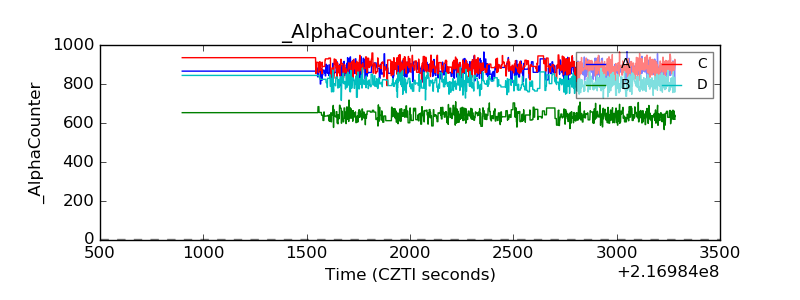 |
| _CPM_Rate | 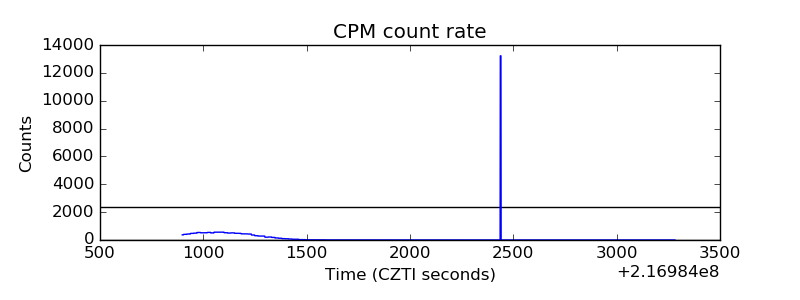 |
| CZT Counter | 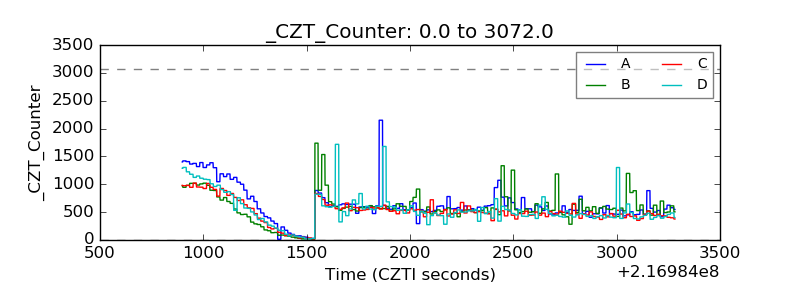 |
| +2.5 Volts monitor |  |
| +5 Volts monitor |  |
| _ROLL_ROT | 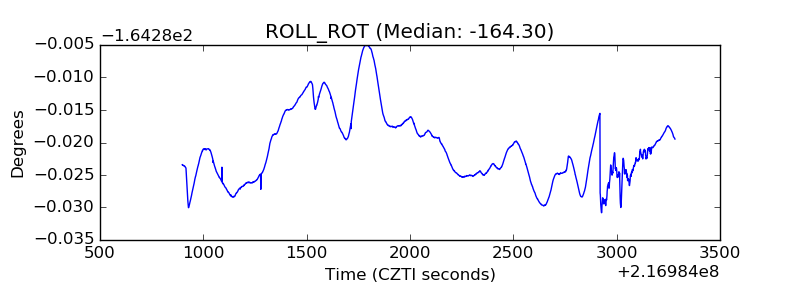 |
| _Roll_DEC | 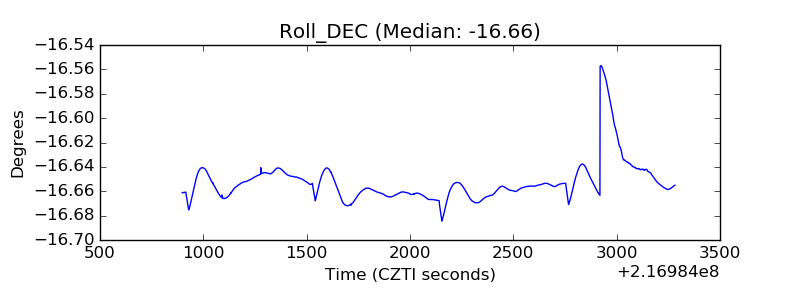 |
| _Roll_RA | 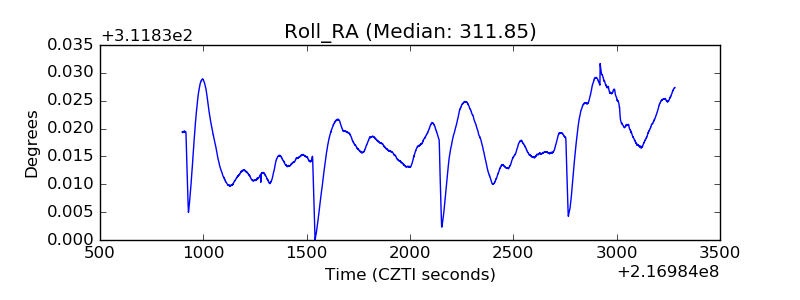 |
| Veto Counter | 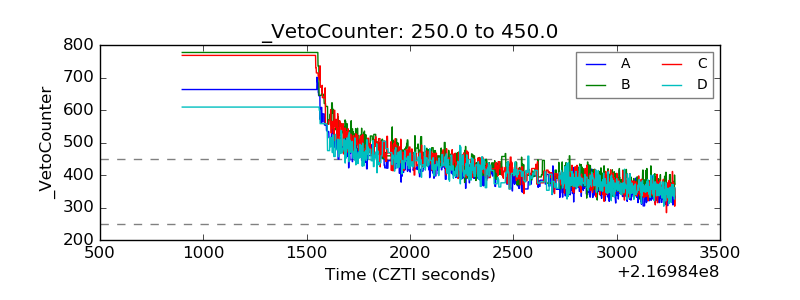 |