| Param | Original file | Final file |
|---|---|---|
| Filename | modeM0/AS1C02_018T01_9000000798_06151cztM0_level2.evt | modeM0/AS1C02_018T01_9000000798_06151cztM0_level2_quad_clean.evt |
| Size (bytes) | 1,636,937,280 | 297,449,280 |
| Size | 1.5 GB | 283.7 MB |
| Events in quadrant A | 12,019,906 | 1,836,828 |
| Events in quadrant B | 14,657,175 | 1,808,578 |
| Events in quadrant C | 10,480,527 | 1,919,438 |
| Events in quadrant D | 10,840,898 | 1,839,386 |
| Mode M9 | |||
|---|---|---|---|
| Quadrant | BADHDUFLAG | Total packets | Discarded packets |
| A | 0 | 25 | 0 |
| B | 0 | 25 | 0 |
| C | 0 | 25 | 0 |
| D | 0 | 25 | 0 |
| Mode SS | |||
|---|---|---|---|
| Quadrant | BADHDUFLAG | Total packets | Discarded packets |
| A | 0 | 474 | 0 |
| B | 0 | 474 | 0 |
| C | 0 | 474 | 0 |
| D | 0 | 474 | 0 |
| Mode M0 | |||
|---|---|---|---|
| Quadrant | BADHDUFLAG | Total packets | Discarded packets |
| A | 0 | 51406 | 4 |
| B | 0 | 58628 | 4 |
| C | 0 | 47556 | 4 |
| D | 0 | 49039 | 4 |
| Quadrant | Total seconds | Saturated seconds | Saturation percentage |
|---|---|---|---|
| A | 23323 | 472 | 2.023753% |
| B | 23323 | 1354 | 5.805428% |
| C | 23323 | 264 | 1.131930% |
| D | 23323 | 366 | 1.569266% |
Noise dominated data is calculated using 1-second bins in cleaned event files. If a bin has >2000 counts, and if more than 50% of those come from <1% of pixels, then it is considered to be noise-dominated and hence unusable.
| Quadrant | # 1 sec bins | Bins with >0 counts | Bins with >2000 counts | High rate bins dominated by noise | Noise dominated (total time) | Noise dominated (detector-on time) | Marked lightcurve |
|---|---|---|---|---|---|---|---|
| A | 25848 | 23325 | 85 | 85 | 0.33% | 0.36% | 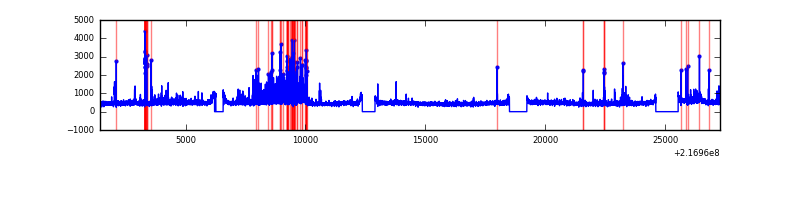 |
| B | 25848 | 23323 | 690 | 690 | 2.67% | 2.96% | 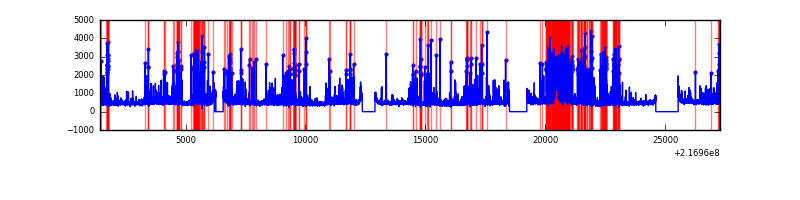 |
| C | 25848 | 23326 | 0 | 0 | 0.00% | 0.00% | 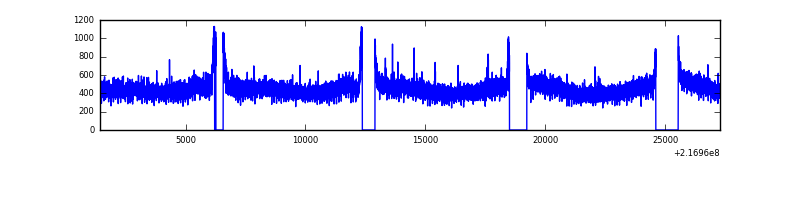 |
| D | 25848 | 23324 | 56 | 56 | 0.22% | 0.24% | 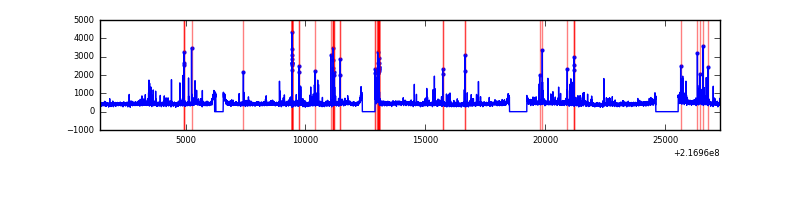 |
Top three noisy pixels from each quadrant. If the there are fewer than three noisy pixels in the level2.evt file, extra rows are filled as -1
| Pixel properties | Quadrant properties | ||||||
|---|---|---|---|---|---|---|---|
| Quadrant | DetID | PixID | Counts | Sigma | Mean | Median | Sigma |
| A | 8 | 15 | 1331994 | 2391.62 | 2718 | 2656 | 555.8 |
| A | 4 | 2 | 84907 | 147.98 | 2718 | 2656 | 555.8 |
| A | 0 | 50 | 83477 | 145.4 | 2718 | 2656 | 555.8 |
| B | 3 | 64 | 3185264 | 6199.25 | 2685 | 2624 | 513.4 |
| B | 0 | 219 | 543917 | 1054.35 | 2685 | 2624 | 513.4 |
| B | 0 | 214 | 209623 | 403.2 | 2685 | 2624 | 513.4 |
| C | 9 | 16 | 30125 | 44.44 | 2663 | 2677 | 617.6 |
| C | 8 | 128 | 25438 | 36.85 | 2663 | 2677 | 617.6 |
| C | 13 | 61 | 21080 | 29.8 | 2663 | 2677 | 617.6 |
| D | 13 | 169 | 412801 | 629.65 | 2661 | 2576 | 651.5 |
| D | 5 | 97 | 157190 | 237.31 | 2661 | 2576 | 651.5 |
| D | 8 | 195 | 98646 | 147.46 | 2661 | 2576 | 651.5 |
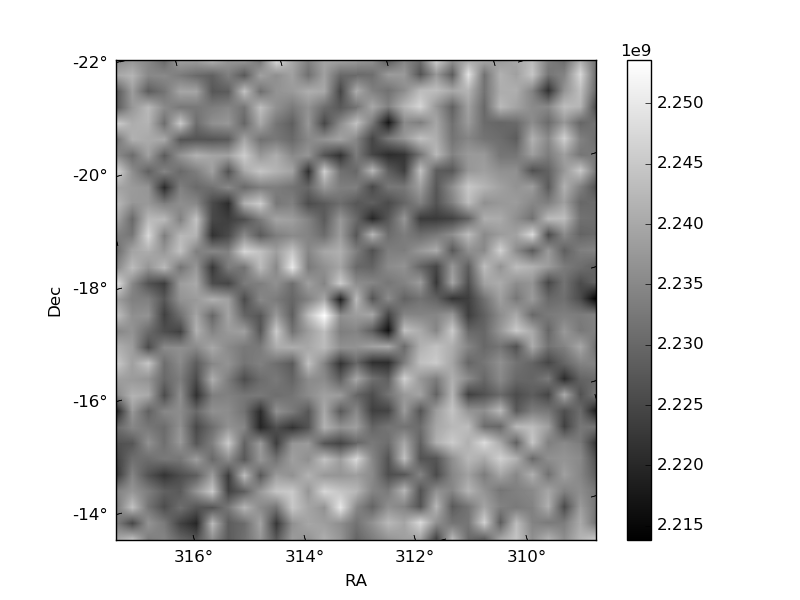
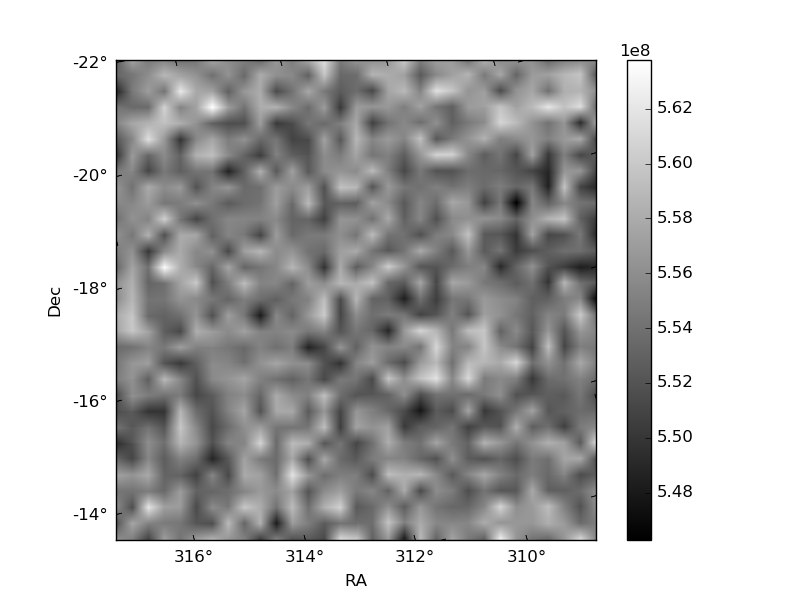
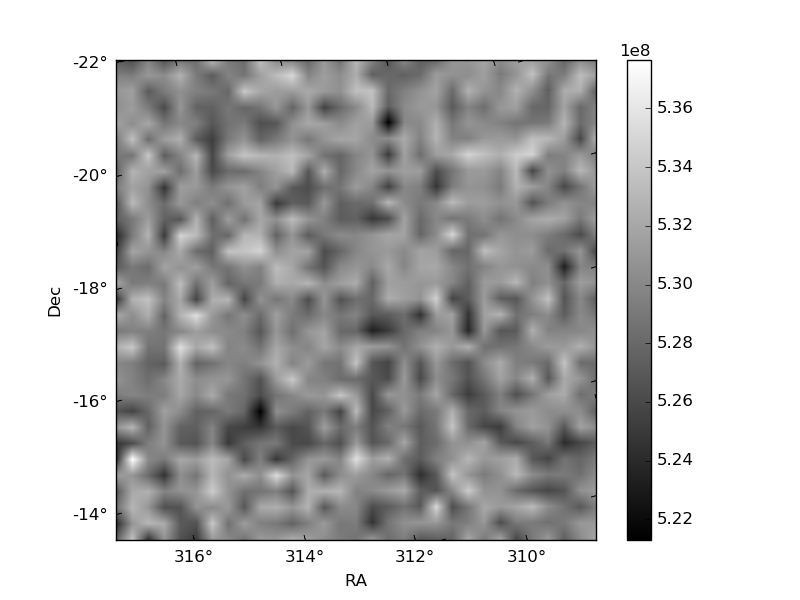
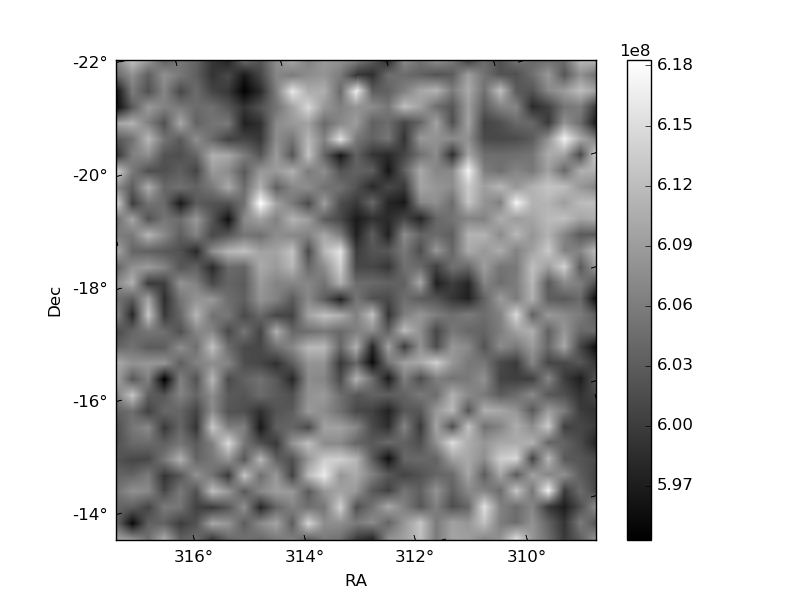
Histogram calculated using DETX and DETY for each event in the final _common_clean file
| Quadrant A | 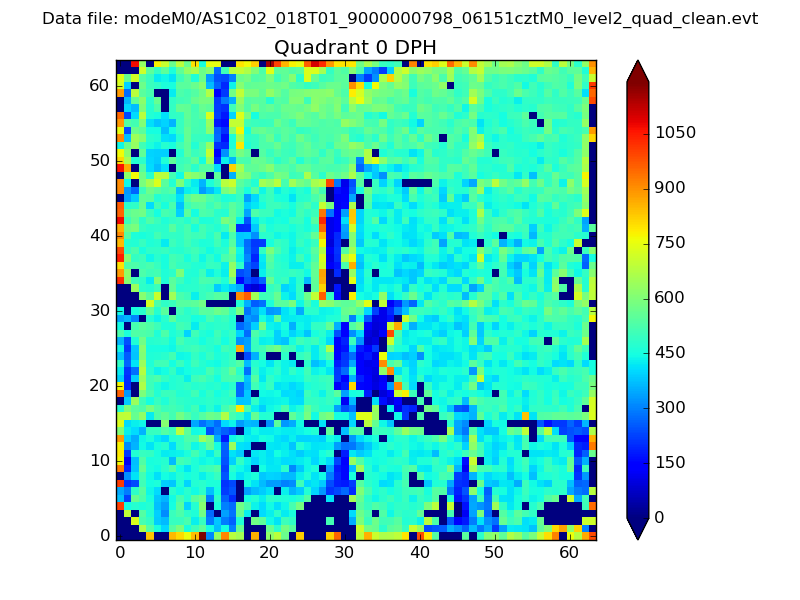 |
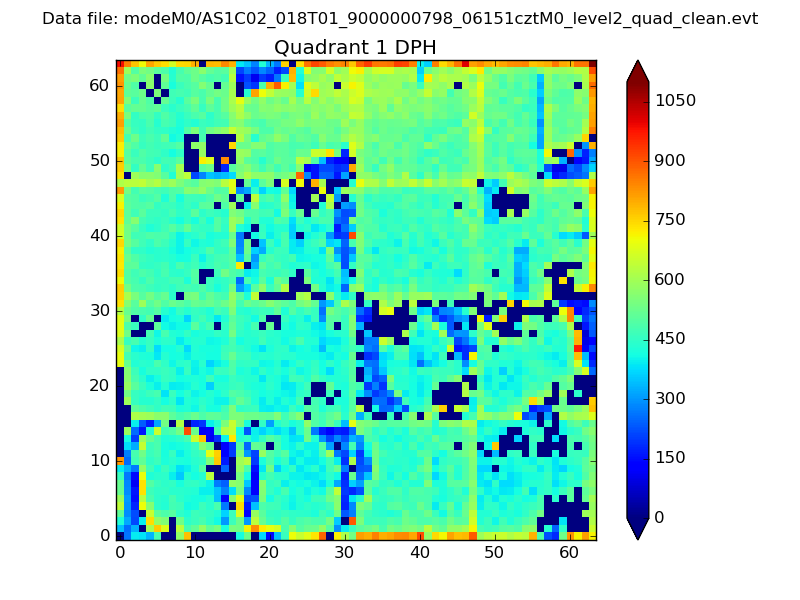 |
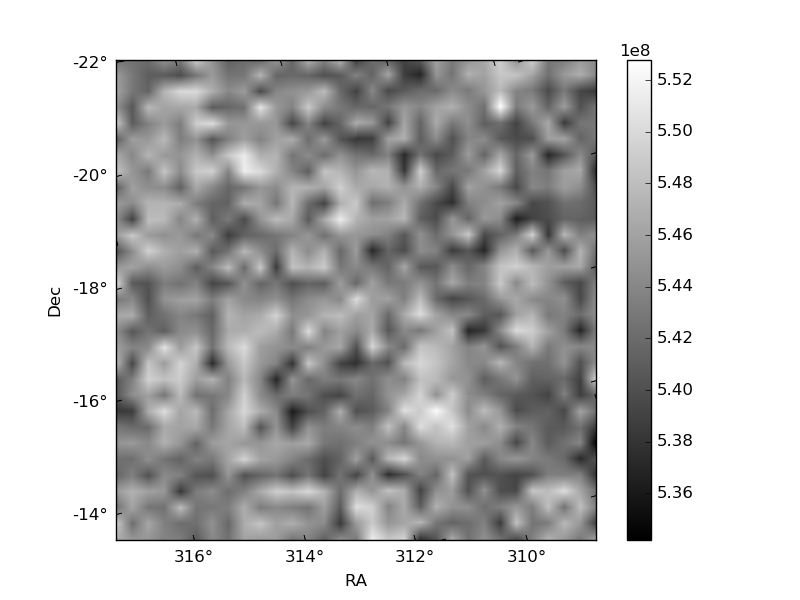
Quadrant B |
|---|---|---|---|
| Quadrant D | 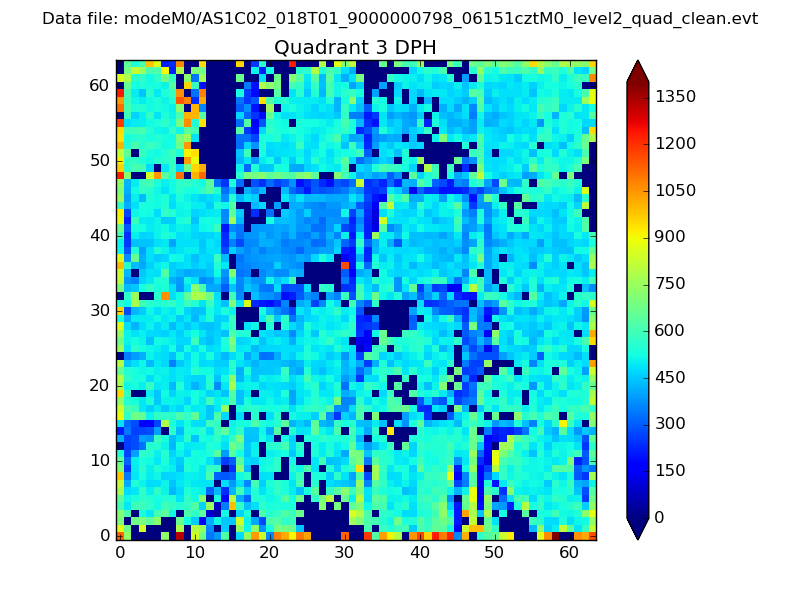 |
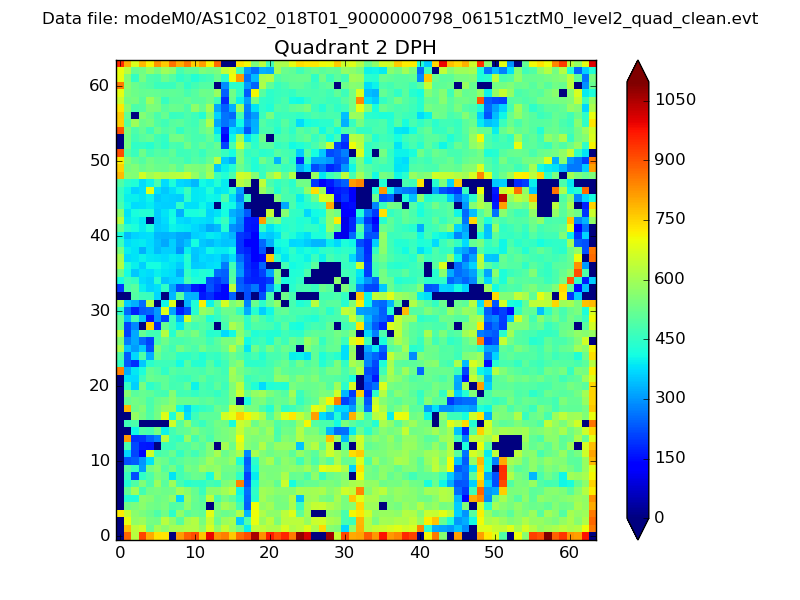 |
Quadrant C |
| Plot type | Count rate plots | Images |
|---|---|---|
| Comparison with Poisson distribution Blue bars denote a histogram of data divided into 1 sec bins. Red curve is a Poisson curve with rate = median count rate of data. |
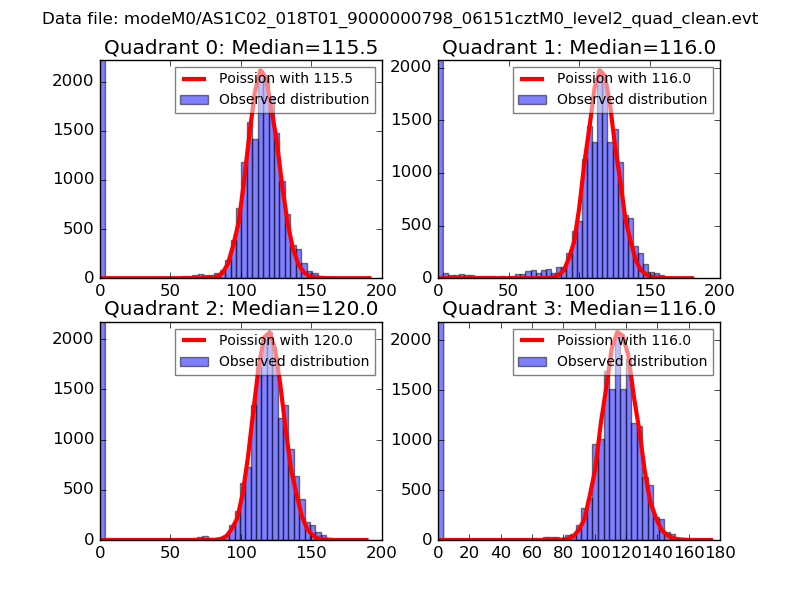 |
 |
| Quadrant-wise count rates Data is divided into 100 sec bins |
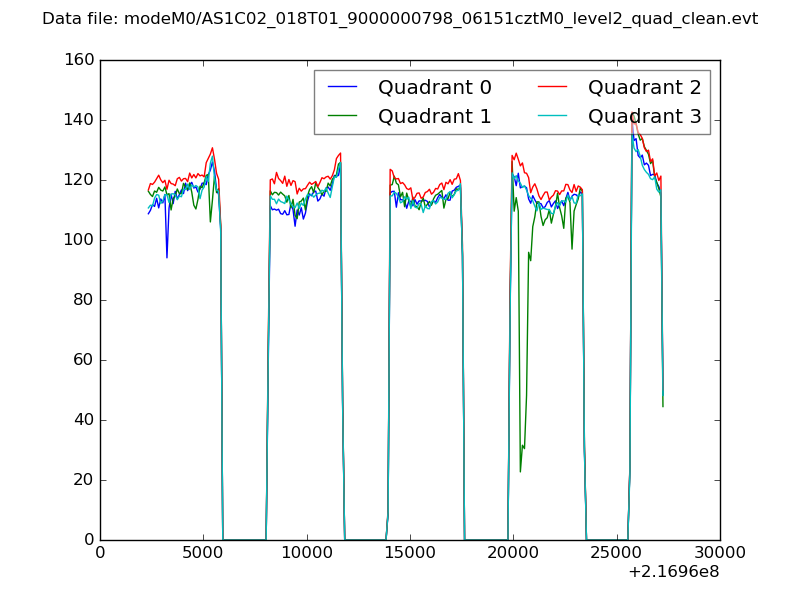 |
|
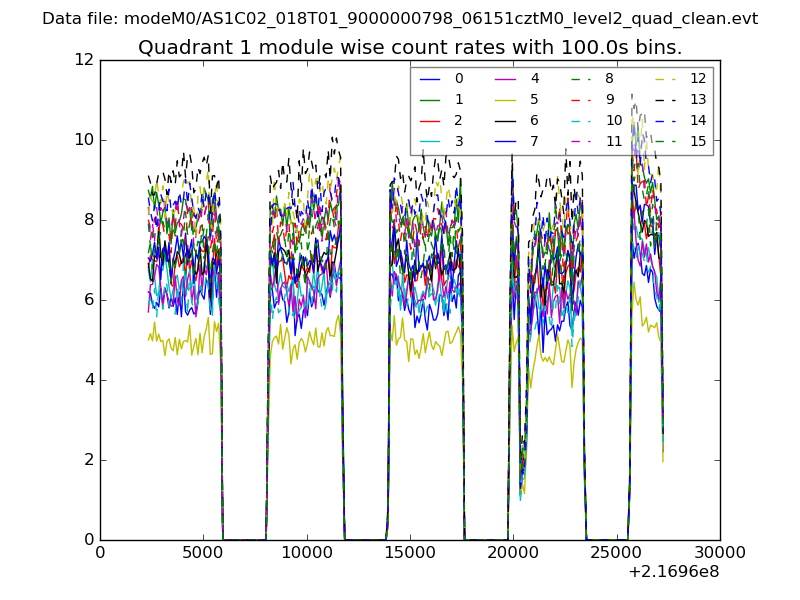
| Module-wise count rates for Quadrant A Data is divided into 100 sec bins |
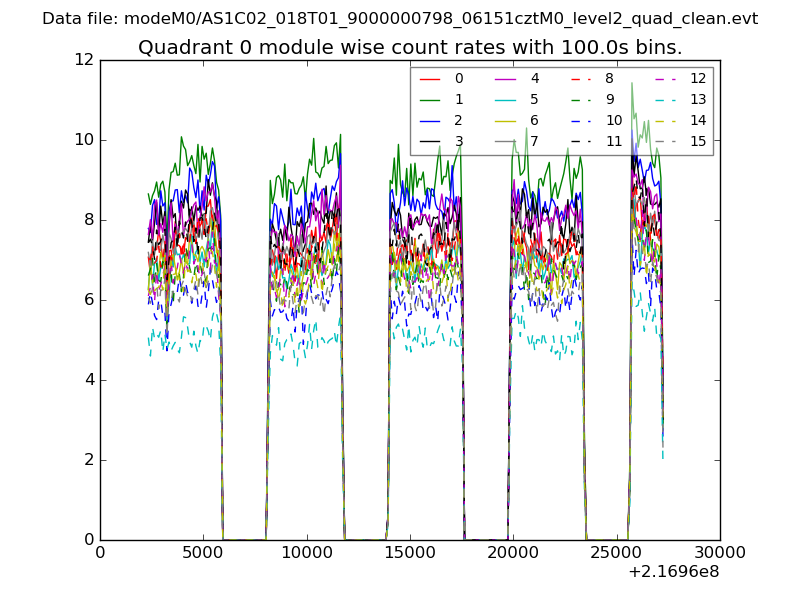 |
 |
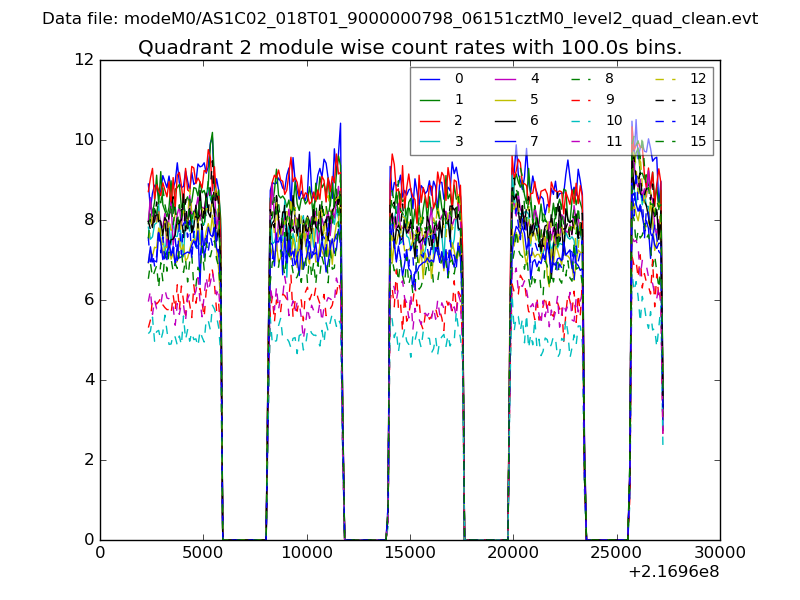
| Module-wise count rates for Quadrant B Data is divided into 100 sec bins |
 |
 |
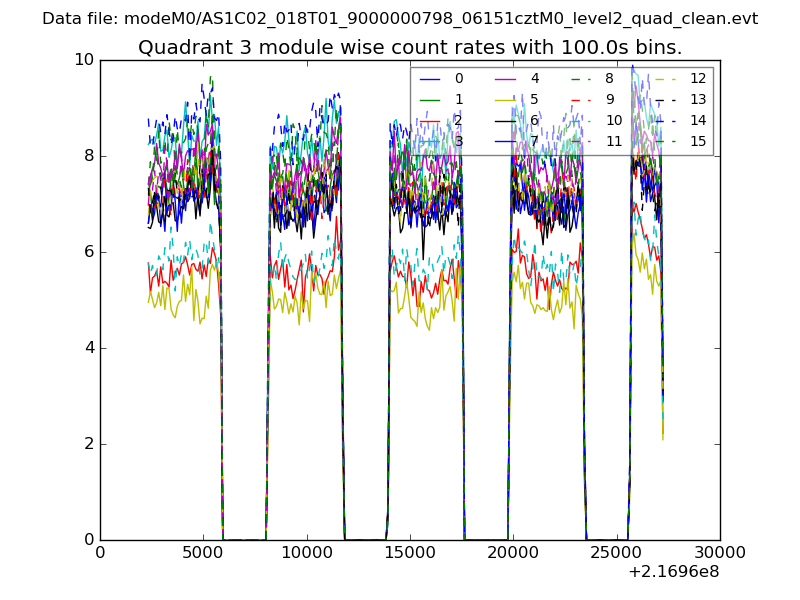
| Module-wise count rates for Quadrant C Data is divided into 100 sec bins |
 |
 |
| Module-wise count rates for Quadrant D Data is divided into 100 sec bins |
 |
 |
| Parameter | Plot |
|---|---|
| CZT HV Monitor | 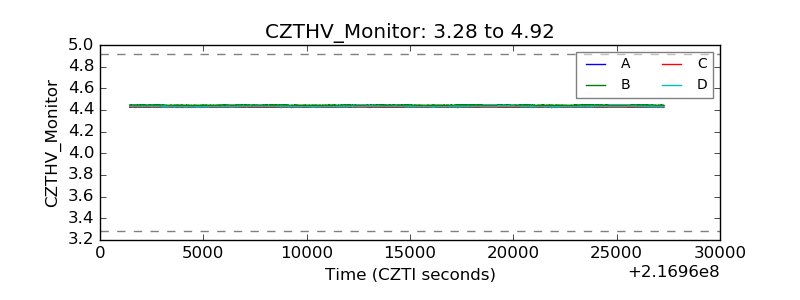 |
| D_VDD | 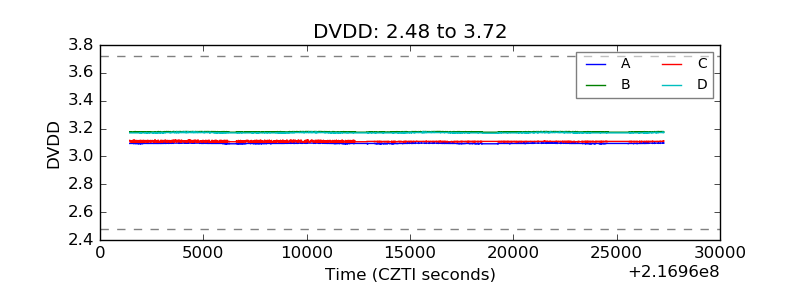 |
| Temperature 1 | 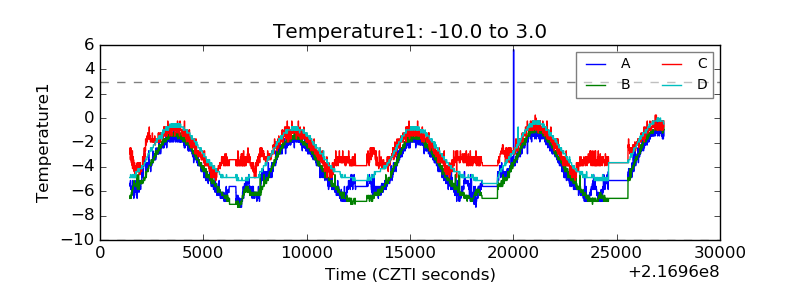 |
| Veto HV Monitor | 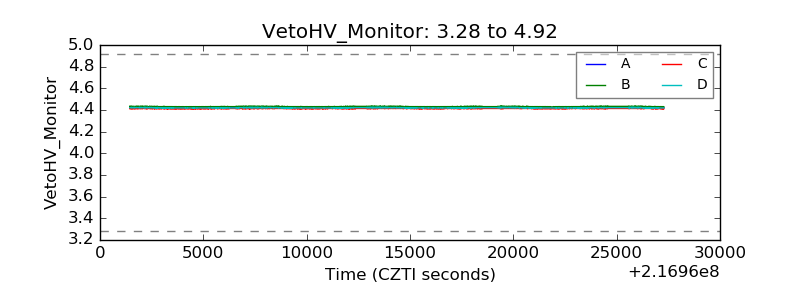 |
| Veto LLD | 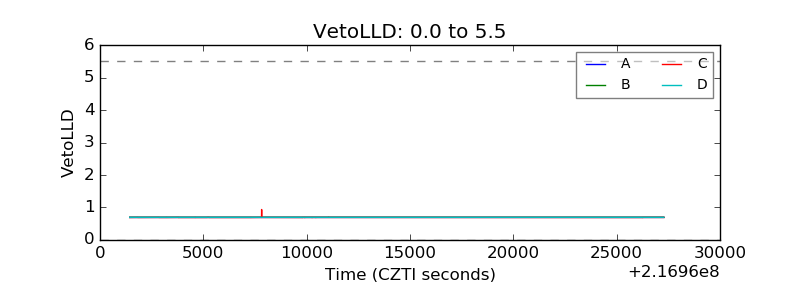 |
| Alpha Counter | 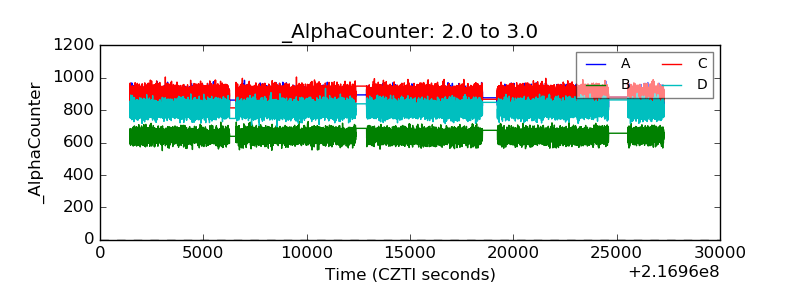 |
| _CPM_Rate |  |
| CZT Counter | 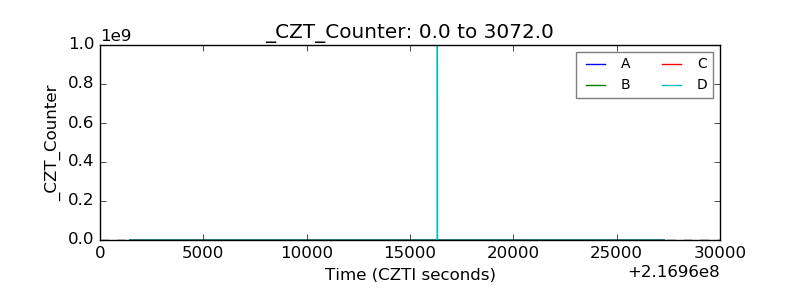 |
| +2.5 Volts monitor |  |
| +5 Volts monitor | 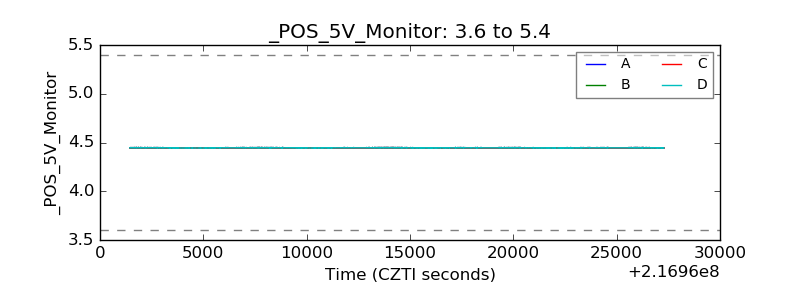 |
| _ROLL_ROT | 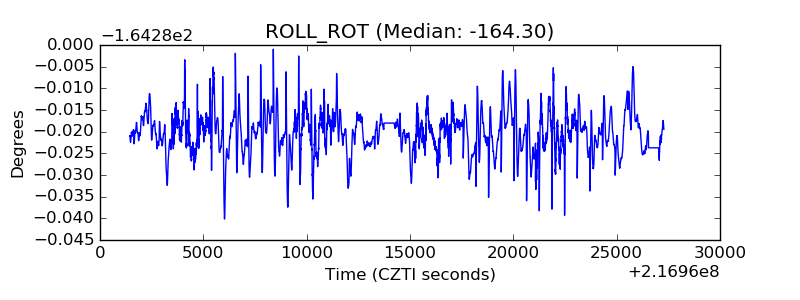 |
| _Roll_DEC | 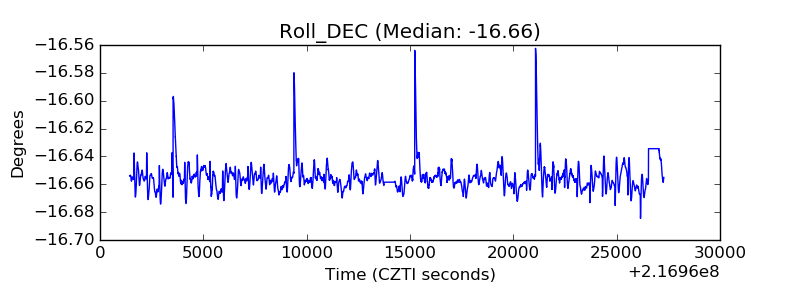 |
| _Roll_RA | 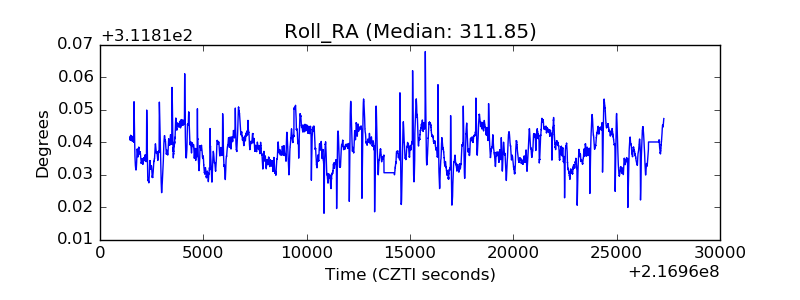 |
| Veto Counter | 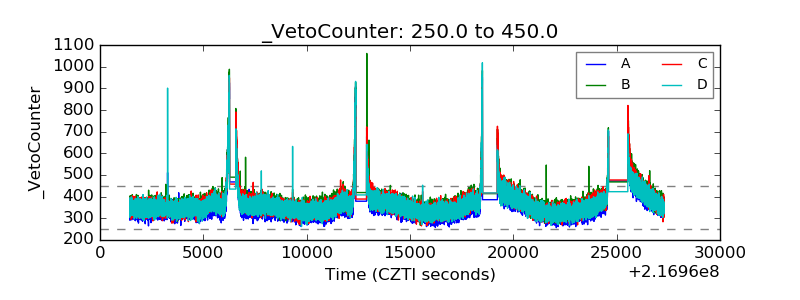 |